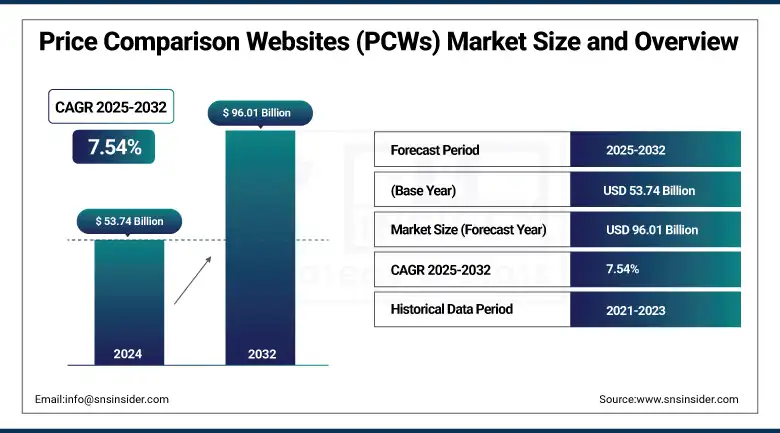
The Price Comparison Websites (PCWs) Market size was valued at USD 53.74 billion in 2024 and is expected to reach USD 96.01 billion by 2032, expanding at a CAGR of 7.54% over the forecast period of 2025-2032.
The Price Comparison Websites (PCWs) market has been expanding rapidly as more and more consumers seek to use digital aids to make well-informed purchase decisions. These applications provide price, feature, and review comparisons across the various store options, adding some measure of transparency and convenience to the shopping process. Commission, subscription, and hybrid are the key revenue models. Key service categories include general merchandise, travel, electronics, and financial services. Consumers are the overwhelming users, with increasing take-up among students and businesses. Retailer websites, user reviews, and AI-processed data all serve as the underpinning of these platforms. With the US at the front, APAC is analogously placed, and North America has a similar prospect of growth. PWcs are so important in the emergent e-commerce facility.
According to research, AI-powered PCWs enhance product match accuracy by 28%, while machine learning-driven personalization boosts repeat visits by 25%. Additionally, chatbot integration improves conversion rates by 12–15% for complex service comparisons, collectively driving stronger user engagement and platform efficiency.
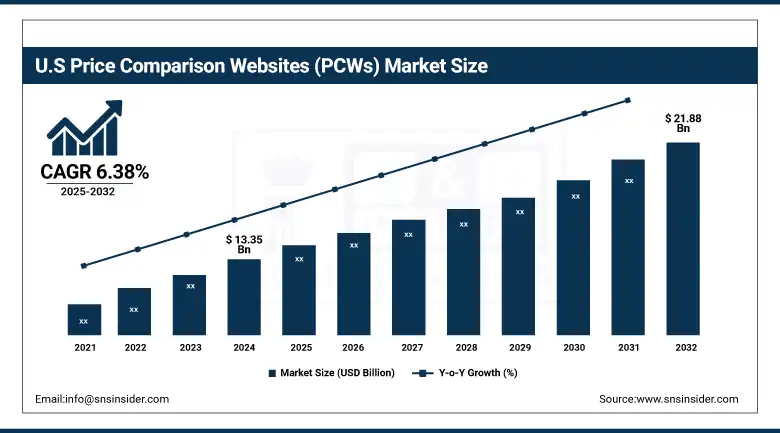
The U.S Price Comparison Websites (PCWs) market size reached USD 13.35 billion in 2024 and is expected to reach USD 21.88 billion in 2032 at a CAGR of 6.38% from 2025 to 2032.
The U.S. dominates the global Price Comparison Websites (PCWs) market due to its advanced digital infrastructure, widespread internet and smartphone usage, and a highly mature e-commerce ecosystem. Consumers in the U.S. are accustomed to leveraging PCWs for making value-driven decisions, particularly in sectors like electronics, travel, and insurance. Market penetration is distributed from key retailers like Google Shopping and Amazon. Major growth drivers are surging need for transparent pricing, AI-driven personalization, and growing online retail activities. These factors and tech-savvy consumers with a high level of digital integration further establish the United States of America as the dominant force of the global PCWs market.
Drives:
Rising Adoption of AI and Personalized Recommendations Enhances Consumer Engagement and Conversion Rates.
One of the lead factors behind the Price Comparison Websites (PCWs) market growth is the rapid adoption of artificial intelligence (AI) and machine learning in price comparison platforms. These features allow for highly personalized experiences that suggest products, dynamically track prices and tailor content to individual users. It is a big part of the reason customers feel happy and engaged, and those feelings often mean more conversions. And now the most recent innovations include AI-driven chatbots for instant service, predictive pricing algorithms, and super-personalized shopping experiences that are tailored to what are we have been looking at and how we have been behaving.. Major players are pouring money into data analysis to improve algorithms that allow faster, more precise comparisons. It’s not just that these advances are facilitating ease of use but they are driving competitive distinction.
Restraints:
Data Privacy and Regulatory Concerns Impede Platform Scalability and User Trust Across Regions.
Increasing data privacy and compliance laws act as a significant inhibitor for these platforms to scale. As personalization and performance are dependent on user data, managing compliance with regulations such as the GDPR, CCPA and other regional data protection laws has become cumbersome and cost-intensive. Consumers are also becoming more concerned with the misuse of data and are becoming less inclined to exchange any personal details. It’s becoming difficult for businesses to remain transparent in data-gathering amidst multiple jurisdictions.” In addition, recent focus on big tech platforms’ privacy breaches have ensured that the demand for strict data governance increases, stalling the quick growth of data-driven innovations.
Opportunities:
Expansion into Niche Markets and Localized Platforms Opens New Avenues for Growth and Monetization.
A significant opportunity lies in targeting niche markets and developing region-specific platforms tailored to local preferences and languages. As consumer demand diversifies beyond mainstream retail categories, price comparison tools can tap into segments like sustainable products, healthcare, education services, and regional goods. Recent developments also indicate an increasing number of hyperlocal PCWs that provide comparisons in local currency and vendor networks. This contextual approach not only increases user adoption in emerging markets, but also generates new revenue streams through local partnerships with merchants and fee-based access to premium features.
Challenges:
Maintaining Real-Time Accuracy Across Thousands of Retailers Presents a Major Operational and Technical Hurdle.
One of the biggest challenges when it comes to price comparison platforms is that of maintaining the real-time accuracy of the information across a large & ever-changing universe of retailers and products. Keeping price, inventory, and features up-to-date requires integrated flows with a variety of data sources and sophisticated, high-performance infrastructure. The smallest delay, the slightest mistake, and all the user's trust is gone, and so is the brand's credibility! The Bottom Line The needs of all those APIs have driven us to integrate with many web scraping tools as well as multiple payment gateways, discount rules, etc. The technical complexity and expense of this approach make scalability and dependability significant barriers.
By Business Model
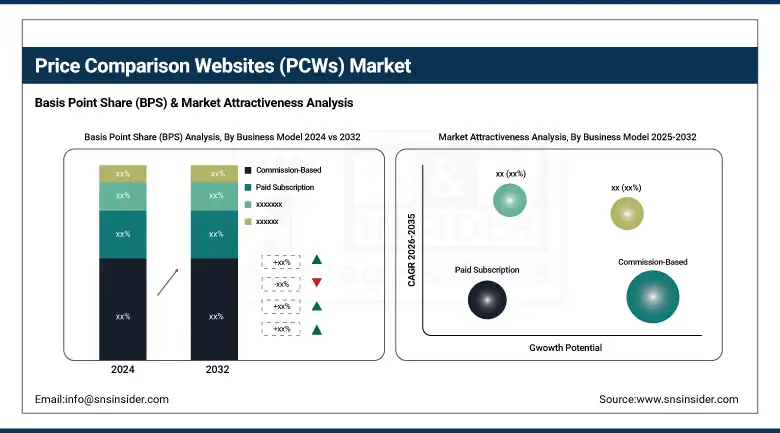
The Commission-Based segment holds the highest revenue share at 41.25% in 2024 because of its performance fee-based model, where the platform gets a cut when users make a transaction via referral links. This appeals to merchants and advertisers because it translates into something quantifiable. Price Comparison Websites (PCWs) market companies such as Priceline and Expedia have extended this business model with better partner integration and revenue-cascading commission models. One major catalyst is the growing need for transparent pricing and up-to-the-minute deal alerts. Enhancements like affiliate API optimization and increased product categories are improving platform functionality to underscore the increasing importance of this model in today’s e-commerce world.
The Hybrid model is growing rapidly at a CAGR of 8.60%. This flexibility allows platforms to monetize through multiple streams, appealing to both budget-conscious users and premium service seekers. Hybrid-model platforms, such as Shopzilla and Google Shopping, have even started to emerge, opening honest subscription access options, while taking their dues in commissions. The main motivation is the increasing demand for multiple sources of monetization due to fierce competition and high user requirements. New products have appeared, such as the tiered membership plan with value-added services and the performance-based merchant’s integration, so that hybrid models are now found to be easier and more efficient in the PCWs ecosystem.
By Service Scope
General Merchandise accounts for the largest revenue share at 40.17% in 2024, driven by high consumer demand for everyday items, from clothing to home goods. Price comparison sites like Amazon and Yahoo Shopping have capitalized on this with broad inventories and dynamic pricing tools. The main driver is the increased online shopping frequency and consumer preference for real-time deal hunting across various product categories. Product developments include personalized catalogs and predictive pricing alerts. With large SKUs and competitive pricing, general merchandise continues to attract repeat visitors, reinforcing its dominance within the PCWs landscape.
The Travel and Hospitality segment is experiencing the highest growth rate at a CAGR of 8.75%, a rebound in international travel, and a growing appetite for transparent travel pricing.’ KAYAK, Expedia, or Booking Holdings are other platforms that have also optimised their services by incorporating hotel reviews, flight insights, or AI-generated recommendations. The desire to compare fares in real time and to compare fares with bundled travel is major trigger. Recent features such as mobile-first design, virtual trip planner, and loyalty integration with air and hotel, continue to make travel price comparison easier and more intuitive for the user.
By Target Audience
Consumers remain the dominant segment in the PCWs market, accounting for 70.12% of the total revenue in 2024. The increasing reliance on digital tools for informed purchasing decisions across retail, electronics, and travel is a key driver. Services like Google Shopping and Bing Shopping are always driving a better-experience mentality with AI-driven recommendations. Recent releases that increase user engagement include custom dashboards and real-time deal notifications. This segment is the spine of PCW platform income, because the post-pandemic future of more price-conscious consumers requires comparison tools for well-informed choices.
The student segment is growing at a CAGR of 9.28%, driven by increased digital usage among younger users and their propensity for value shopping. Platforms appealing to this demographic, such as UNiDAYS and Student Beans, are combining price comparison with student discounts. The ultimate motivator is cost, backed by unique promotions and editorial product lists. Recent Price Comparison Websites market trends have seen student-only portals, subscription bundles, and AI-curated comparisons of academic software emerge. This tech-savvy generation now turns to PCWs to discover the best value deals, particularly for books, electronics, and course tools.
By Data Source
Retailer websites are the primary data source for PCWs, contributing 43.47% of market revenue in 2024. These sites provide real-time product availability, pricing, and promotions. Major platforms like Amazon and Walmart support rich data feeds that PCWs tap into for accurate comparisons. The main driver is consumer demand for up-to-date, retailer-verified pricing. Product developments include real-time inventory sync and automated discount tracking. As retailers become more open to third-party integrations, this data source ensures reliability and enhances user trust in comparison results.
AI-based data sources are growing at a CAGR of 10.52%, due to their capacity to deliver dynamic, predictive, and personalized feedback. Marketplaces such as Google Shopping can take advantage of AI to sort products intelligently, analyze sentiment in customer reviews, and apply dynamic pricing. The predominant motivation is the requirement of high-precision intelligence and improved user experience. New developments include natural language search, image-based product recognition, and AI-driven competitor benchmarking. These attributes not only increase data quality but also cast AI as a change agent for the PCW ecosystem.
By Value-Added Services
Personalized Shopping Experience has the largest revenue share at 11.92% in 2024. Sites such as Shopzilla and Amazon offer personalized product recommendations based on a user's behavior and interests. The primary motivator is increased consumer demand for timely and relevant product offerings. New developments involve preference learning with AI and cross-device personalization integrated into the framework. These tools boost user experience and satisfaction, which has a direct impact on conversion rates. As personalization is now the norm, its effect on user loyalty and average order value further solidifies its stronghold.
Loyalty Programs are growing at a CAGR of 9.35% due to the urgency for improving customer retention and lifetime value. Market leaders like Expedia Group and Booking Holdings have rewards systems as part of their comparison features. The primary catalyst is user affinity towards cumulative saving and personalized benefits. Recent developments involve gamified loyalty functionality, tiered membership, and cross-platform point redemption. These programs not only differentiate platforms in a competitive environment but also establish repeat engagement, serving as a means for sustaining long-term user acquisition efforts.
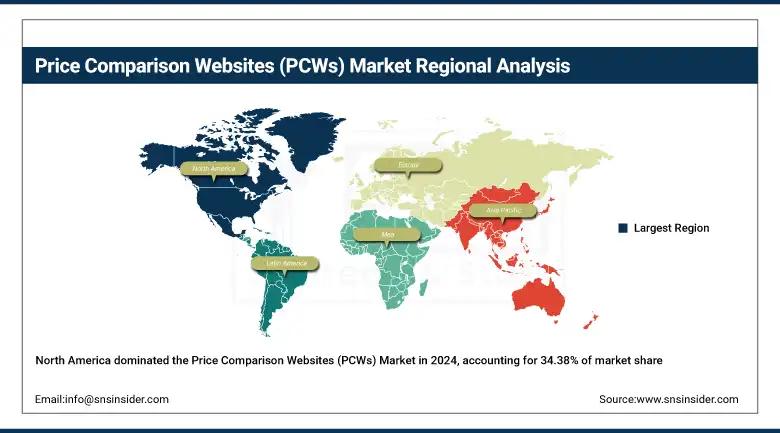
North America, holding the dominant position with a 34.38% Price Comparison Websites (PCWs) market share in 2024, leads the global PCWs market due to advanced digital infrastructure, high penetration of the Internet, and an established e-commerce ecosystem. Being aware of price transparency, consumers increasingly use the AI technologies adopted by the retail comparison platforms. Besides, Google Shopping and Amazon hugely reinforce the PCWs market as the leading market players.
The U.S. dominates the North American market, driven by high consumer demand for competitive pricing, robust e-commerce penetration, and technological advancements like AI-based comparison engines.
Europe exhibits steady growth in the PCWs market, supported by consumer preference for informed buying and regulatory encouragement for transparency in digital markets. Countries like Germany, the UK, and France are major contributors due to their mature online retail and travel sectors.
The UK dominates the European market owing to its highly developed online shopping ecosystem and strong presence of PCW platforms across finance, insurance, and retail sectors.
Asia Pacific is the fastest-growing region in the market, projected to expand at a CAGR of 8.87% during the forecast period. This growth is fueled by increasing internet and smartphone usage, an expanding middle class, and rising online retail penetration. Increasing consumer need for deal comparison and mobile-first shopping behavior is a crucial market accelerator in all emerging economies.
China leads the Asia Pacific market due to its massive e-commerce ecosystem, strong digital adoption, and government support for digital economy initiatives, which fuel demand for PCWs across categories.
Middle East & Africa and Latin America are expected to grow at a constant pace in the PCWs market as a result of digital transformation, enhanced payment infrastructure, high e-commerce presence, and the rising trend of online price comparison. The UAE and Brazil are front-runners in the regions, with strong internet penetration, supportive steps by governments, and localized comparison platforms taking out.
The major key players of the Price Comparison Websites (PCWs) Market are Shopzilla, Priceline, Kayak, Expedia, Orbitz, Travelocity, Google, Yahoo, Bing, Booking Holdings, and others.
In April 2025, Expedia unveiled enhanced “Bundle & Save” features, allowing travelers to combine flights, hotels, and car rentals for up to 10% savings. The update includes flexible payment options, aiming to boost booking convenience and value.
In April 2025, Kayak debuted Kayak.ai, an AI-driven, chat-first interface offering real-time pricing from over 400 providers and conversational travel planning. They also appointed a dedicated CTO to accelerate their AI capabilities, signaling a strong focus on innovation.
Report Attributes | Details |
---|---|
Market Size in 2024 | USD 53.74 Billion |
Market Size by 2032 | USD 96.01 Billion |
CAGR | CAGR of 7.54% From 2025 to 2032 |
Base Year | 2024 |
Forecast Period | 2025-2032 |
Historical Data | 2021-2023 |
Report Scope & Coverage | Market Size, Segments Analysis, Competitive Landscape, Regional Analysis, DROC & SWOT Analysis, Forecast Outlook |
Key Segments | • By Business Model (Free Service, Paid Subscription, Commission-Based, Hybrid (Combination of Models)) • By Service Scope (General Merchandise, Travel and Hospitality, Financial Services, Electronics, Software and Technology) • By Target Audience (Consumers, Businesses, Students, Senior Citizens, Budget-Conscious Individuals) • By Data Source (Retailer Websites, Manufacturer Data, User Reviews, Crowdsourced Data, Artificial Intelligence (AI)) • By Value-Added Services (Product Recommendations, Price Alerts, Loyalty Programs, Exclusive Deals, Personalized Shopping Experiences) |
Regional Analysis/Coverage | North America (US, Canada, Mexico), Europe (Germany, France, UK, Italy, Spain, Poland, Turkey, Rest of Europe), Asia Pacific (China, India, Japan, South Korea, Singapore, Australia, Rest of Asia Pacific), Middle East & Africa (UAE, Saudi Arabia, Qatar, South Africa, Rest of Middle East & Africa), Latin America (Brazil, Argentina, Rest of Latin America) |
Company Profiles | Shopzilla, Priceline, Kayak, Expedia, Orbitz, Travelocity, Google, Yahoo, Bing, Booking Holdings. |
Ans: The market is projected to expand at a CAGR of 7.54% from 2025 to 2032.
Ans: The market size was USD 53.74 billion in 2024.
Ans: The major growth factor is the rising adoption of AI and personalized recommendations, which enhances consumer engagement and conversion rates through features like dynamic pricing, AI-driven chatbots, and tailored content.
Ans: By Business Model, the Commission-Based segment held the highest revenue share at 41.25% in 2024, making it the dominant type throughout the projected years.
Ans: North America dominated the Price Comparison Websites (PCWs) Market in 2024 with a 34.38% market share, driven by advanced digital infrastructure, high internet penetration, and a mature e-commerce ecosystem.
Table of Contents:
1. Introduction
1.1 Market Definition
1.2 Scope (Inclusion and Exclusions)
1.3 Research Assumptions
2. Executive Summary
2.1 Market Overview
2.2 Regional Synopsis
2.3 Competitive Summary
3. Research Methodology
3.1 Top-Down Approach
3.2 Bottom-up Approach
3.3. Data Validation
3.4 Primary Interviews
4. Market Dynamics Impact Analysis
4.1 Market Driving Factors Analysis
4.1.1 Drivers
4.1.2 Restraints
4.2 PESTLE Analysis
4.3 Porter’s Five Forces Model
5. Statistical Insights and Trends Reporting
5.1 Time-to-Purchase Reduction
5.2 AI-Powered Matching Accuracy
5.3 Dynamic Pricing Alerts Usage
5.4 Cross-Border Comparison Trends
5.5 PCW Impact on Retailer Pricing Strategy
5.7 Trust & Transparency Metrics
6. Competitive Landscape
6.1 List of Major Companies, By Region
6.2 Market Share Analysis, By Region
6.3 Product Benchmarking
6.3.1 Product specifications and features
6.3.2 Pricing
6.4 Strategic Initiatives
6.4.1 Marketing and promotional activities
6.4.2 Distribution and supply chain strategies
6.4.3 Expansion plans and new product launches
6.4.4 Strategic partnerships and collaborations
6.5 Technological Advancements
6.6 Market Positioning and Branding
7. Price Comparison Websites (PCWs) Market Segmentation, By Business Model
7.1 Chapter Overview
7.2 Free Service
7.2.1 Free Service Market Trends Analysis (2021-2032)
7.2.2 Free Service Market Size Estimates and Forecasts to 2032 (USD Billion)
7.3 Paid Subscription
7.3.1 Paid Subscription Market Trends Analysis (2021-2032)
7.3.2 Paid Subscription Market Size Estimates and Forecasts to 2032 (USD Billion)
7.4 Commission-Based
7.4.1 Commission-Based Market Trends Analysis (2021-2032)
7.4.2 Commission-Based Market Size Estimates and Forecasts to 2032 (USD Billion)
7.5 Hybrid (Combination of Models)
7.5.1 Hybrid (Combination of Models) Market Trends Analysis (2021-2032)
7.5.2 Hybrid (Combination of Models) Market Size Estimates and Forecasts to 2032 (USD Billion)
8. Price Comparison Websites (PCWs) Market Segmentation, By Service Scope
8.1 Chapter Overview
8.2 General Merchandise
8.2.1 General Merchandise Market Trends Analysis (2021-2032)
8.2.2 General Merchandise Market Size Estimates And Forecasts To 2032 (USD Billion)
8.3 Travel and Hospitality
8.3.1 Travel and Hospitality Market Trends Analysis (2021-2032)
8.3.2 Travel and Hospitality Market Size Estimates And Forecasts To 2032 (USD Billion)
8.4 Financial Services
8.4.1 Financial Services Market Trends Analysis (2021-2032)
8.4.2 Financial Services Market Size Estimates And Forecasts To 2032 (USD Billion)
8.5 Electronics
8.5.1 Electronics Market Trends Analysis (2021-2032)
8.5.2 Electronics Market Size Estimates And Forecasts To 2032 (USD Billion)
8.6 Software and Technology
8.6.1 Software and Technology Market Trends Analysis (2021-2032)
8.6.2 Software and Technology Market Size Estimates And Forecasts To 2032 (USD Billion)
9. Price Comparison Websites (PCWs) Market Segmentation, By Data Source
9.1 Chapter Overview
9.2 Retailer Websites
9.2.1 Retailer Websites Market Trends Analysis (2021-2032)
9.2.2 Retailer Websites Market Size Estimates And Forecasts To 2032 (USD Billion)
9.3 Manufacturer Data
9.3.1 Manufacturer Data Market Trends Analysis (2021-2032)
9.3.2 Manufacturer Data Market Size Estimates And Forecasts To 2032 (USD Billion)
9.4 User Reviews
9.4.1 User Reviews Market Trends Analysis (2021-2032)
9.4.2 User Reviews Market Size Estimates And Forecasts To 2032 (USD Billion)
9.5 Crowdsourced Data
9.5.1 Crowdsourced Data Market Trends Analysis (2021-2032)
9.5.2 Crowdsourced Data Market Size Estimates And Forecasts To 2032 (USD Billion)
9.6 Artificial Intelligence (AI)
9.6.1 Artificial Intelligence (AI) Market Trends Analysis (2021-2032)
9.6.2 Artificial Intelligence (AI) Market Size Estimates And Forecasts To 2032 (USD Billion)
10. Price Comparison Websites (PCWs) Market Segmentation, By Target Audience
10.1 Chapter Overview
10.2 Consumers
10.2.1 Consumers Market Trends Analysis (2021-2032)
10.2.2 Consumers Market Size Estimates And Forecasts To 2032 (USD Billion)
10.3 Businesses
10.3.1 Businesses Market Trends Analysis (2021-2032)
10.3.2 Businesses Market Size Estimates And Forecasts To 2032 (USD Billion)
10.4 Students
10.4.1 Students Market Trends Analysis (2021-2032)
10.4.2 Students Market Size Estimates And Forecasts To 2032 (USD Billion)
10.5 Senior Citizens
10.5.1 Senior Citizens Market Trends Analysis (2021-2032)
10.5.2 Senior Citizens Market Size Estimates And Forecasts To 2032 (USD Billion)
10.6 Budget-Conscious Individuals
10.6.1 Budget-Conscious Individuals Market Trends Analysis (2021-2032)
10.6.2 Budget-Conscious Individuals Market Size Estimates And Forecasts To 2032 (USD Billion)
11. Price Comparison Websites (PCWs) Market Segmentation, By Value-Added Services
11.1 Chapter Overview
11.2 Product Recommendations
11.2.1 Product Recommendations Market Trends Analysis (2021-2032)
11.2.2 Product Recommendations Market Size Estimates And Forecasts To 2032 (USD Billion)
11.3 Price Alerts
11.3.1 Price Alerts Market Trends Analysis (2021-2032)
11.3.2 Price Alerts Market Size Estimates And Forecasts To 2032 (USD Billion)
11.4 Loyalty Programs
11.4.1 Loyalty Programs Market Trends Analysis (2021-2032)
11.4.2 Loyalty Programs Market Size Estimates And Forecasts To 2032 (USD Billion)
11.5 Exclusive Deals
11.5.1 Exclusive Deals Market Trends Analysis (2021-2032)
11.5.2 Exclusive Deals Market Size Estimates And Forecasts To 2032 (USD Billion)
11.6 Personalized Shopping Experiences
11.6.1 Personalized Shopping Experiences Market Trends Analysis (2021-2032)
11.6.2 Personalized Shopping Experiences Market Size Estimates And Forecasts To 2032 (USD Billion)
12. Regional Analysis
12.1 Chapter Overview
12.2 North America
12.2.1 Trends Analysis
12.2.2 North America Price Comparison Websites (PCWs) Market Estimates And Forecasts, By Country (2021-2032) (USD Billion)
12.2.3 North America Price Comparison Websites (PCWs) Market Estimates And Forecasts, By Business Model (2021-2032) (USD Billion)
12.2.4 North America Price Comparison Websites (PCWs) Market Estimates And Forecasts, By Service Scope (2021-2032) (USD Billion)
12.2.5 North America Price Comparison Websites (PCWs) Market Estimates And Forecasts, By Data Source (2021-2032) (USD Billion)
12.2.6 North America Price Comparison Websites (PCWs) Market Estimates And Forecasts, By Target Audience (2021-2032) (USD Billion)
12.2.7 North America Price Comparison Websites (PCWs) Market Estimates And Forecasts, By Value-Added Services (2021-2032) (USD Billion)
12.2.8 USA
12.2.8.1 USA Price Comparison Websites (PCWs) Market Estimates And Forecasts, By Business Model (2021-2032) (USD Billion)
12.2.8.2 USA Price Comparison Websites (PCWs) Market Estimates And Forecasts, By Service Scope (2021-2032) (USD Billion)
12.2.8.3 USA Price Comparison Websites (PCWs) Market Estimates And Forecasts, By Data Source (2021-2032) (USD Billion)
12.2.8.4 USA Price Comparison Websites (PCWs) Market Estimates And Forecasts, By Target Audience (2021-2032) (USD Billion)
12.2.8.5 USA Price Comparison Websites (PCWs) Market Estimates And Forecasts, By Value-Added Services (2021-2032) (USD Billion)
12.2.9 Canada
12.2.9.1 Canada Price Comparison Websites (PCWs) Market Estimates And Forecasts, By Business Model (2021-2032) (USD Billion)
12.2.9.2 Canada Price Comparison Websites (PCWs) Market Estimates And Forecasts, By Service Scope (2021-2032) (USD Billion)
12.2.9.3 Canada Price Comparison Websites (PCWs) Market Estimates And Forecasts, By Data Source (2021-2032) (USD Billion)
12.2.9.4 Canada Price Comparison Websites (PCWs) Market Estimates And Forecasts, By Target Audience (2021-2032) (USD Billion)
12.2.9.5 Canada Price Comparison Websites (PCWs) Market Estimates And Forecasts, By Value-Added Services (2021-2032) (USD Billion)
12.2.10 Mexico
12.2.10.1 Mexico Price Comparison Websites (PCWs) Market Estimates And Forecasts, By Business Model (2021-2032) (USD Billion)
12.2.10.2 Mexico Price Comparison Websites (PCWs) Market Estimates And Forecasts, By Service Scope (2021-2032) (USD Billion)
12.2.10.3 Mexico Price Comparison Websites (PCWs) Market Estimates And Forecasts, By Data Source (2021-2032) (USD Billion)
12.2.10.4 Mexico Price Comparison Websites (PCWs) Market Estimates And Forecasts, By Target Audience (2021-2032) (USD Billion)
12.2.10.5 Mexico Price Comparison Websites (PCWs) Market Estimates And Forecasts, By Value-Added Services (2021-2032) (USD Billion)
12.3 Europe
12.3.1 Trends Analysis
12.3.2 Eastern Europe Price Comparison Websites (PCWs) Market Estimates And Forecasts, By Country (2021-2032) (USD Billion)
12.3.3 Eastern Europe Price Comparison Websites (PCWs) Market Estimates And Forecasts, By Business Model (2021-2032) (USD Billion)
12.3.4 Eastern Europe Price Comparison Websites (PCWs) Market Estimates And Forecasts, By Service Scope (2021-2032) (USD Billion)
12.3.5 Eastern Europe Price Comparison Websites (PCWs) Market Estimates And Forecasts, By Data Source (2021-2032) (USD Billion)
12.3.6 Eastern Europe Price Comparison Websites (PCWs) Market Estimates And Forecasts, By Target Audience (2021-2032) (USD Billion)
12.3.7 Eastern Europe Price Comparison Websites (PCWs) Market Estimates And Forecasts, By Value-Added Services (2021-2032) (USD Billion)
12.3.8 Poland
12.3.8.1 Poland Price Comparison Websites (PCWs) Market Estimates And Forecasts, By Business Model (2021-2032) (USD Billion)
12.3.8.2 Poland Price Comparison Websites (PCWs) Market Estimates And Forecasts, By Service Scope (2021-2032) (USD Billion)
12.3.8.3 Poland Price Comparison Websites (PCWs) Market Estimates And Forecasts, By Data Source (2021-2032) (USD Billion)
12.3.8.4 Poland Price Comparison Websites (PCWs) Market Estimates And Forecasts, By Target Audience (2021-2032) (USD Billion)
12.3.8.5 Poland Price Comparison Websites (PCWs) Market Estimates And Forecasts, By Value-Added Services (2021-2032) (USD Billion)
12.3.9 Turkey
12.3.9.1 Turkey Price Comparison Websites (PCWs) Market Estimates And Forecasts, By Business Model (2021-2032) (USD Billion)
12.3.9.2 Turkey Price Comparison Websites (PCWs) Market Estimates And Forecasts, By Service Scope (2021-2032) (USD Billion)
12.3.9.3 Turkey Price Comparison Websites (PCWs) Market Estimates And Forecasts, By Data Source (2021-2032) (USD Billion)
12.3.9.4 Turkey Price Comparison Websites (PCWs) Market Estimates And Forecasts, By Target Audience (2021-2032) (USD Billion)
12.3.9.5 Turkey Price Comparison Websites (PCWs) Market Estimates And Forecasts, By Value-Added Services (2021-2032) (USD Billion)
12.3.10 Germany
12.3.10.1 Germany Price Comparison Websites (PCWs) Market Estimates And Forecasts, By Business Model (2021-2032) (USD Billion)
12.3.10.2 Germany Price Comparison Websites (PCWs) Market Estimates And Forecasts, By Service Scope (2021-2032) (USD Billion)
12.3.10.3 Germany Price Comparison Websites (PCWs) Market Estimates And Forecasts, By Data Source (2021-2032) (USD Billion)
12.3.10.4 Germany Price Comparison Websites (PCWs) Market Estimates And Forecasts, By Target Audience (2021-2032) (USD Billion)
12.3.10.5 Germany Price Comparison Websites (PCWs) Market Estimates And Forecasts, By Value-Added Services (2021-2032) (USD Billion)
12.3.11 France
12.3.11.1 France Price Comparison Websites (PCWs) Market Estimates And Forecasts, By Business Model (2021-2032) (USD Billion)
12.3.11.2 France Price Comparison Websites (PCWs) Market Estimates And Forecasts, By Service Scope (2021-2032) (USD Billion)
12.3.11.3 France Price Comparison Websites (PCWs) Market Estimates And Forecasts, By Data Source (2021-2032) (USD Billion)
12.3.11.4 France Price Comparison Websites (PCWs) Market Estimates And Forecasts, By Target Audience (2021-2032) (USD Billion)
12.3.11.5 France Price Comparison Websites (PCWs) Market Estimates And Forecasts, By Value-Added Services (2021-2032) (USD Billion)
12.3.12 UK
12.3.12.1 UK Price Comparison Websites (PCWs) Market Estimates And Forecasts, By Business Model (2021-2032) (USD Billion)
12.3.12.2 UK Price Comparison Websites (PCWs) Market Estimates And Forecasts, By Service Scope (2021-2032) (USD Billion)
12.3.12.3 UK Price Comparison Websites (PCWs) Market Estimates And Forecasts, By Data Source (2021-2032) (USD Billion)
12.3.12.4 UK Price Comparison Websites (PCWs) Market Estimates And Forecasts, By Target Audience (2021-2032) (USD Billion)
12.3.12.5 UK Price Comparison Websites (PCWs) Market Estimates And Forecasts, By Value-Added Services (2021-2032) (USD Billion)
12.3.13 Italy
12.3.13.1 Italy Price Comparison Websites (PCWs) Market Estimates And Forecasts, By Business Model (2021-2032) (USD Billion)
12.3.13.2 Italy Price Comparison Websites (PCWs) Market Estimates And Forecasts, By Service Scope (2021-2032) (USD Billion)
12.3.13.3 Italy Price Comparison Websites (PCWs) Market Estimates And Forecasts, By Data Source (2021-2032) (USD Billion)
12.3.13.4 Italy Price Comparison Websites (PCWs) Market Estimates And Forecasts, By Target Audience (2021-2032) (USD Billion)
12.3.13.5 Italy Price Comparison Websites (PCWs) Market Estimates And Forecasts, By Value-Added Services (2021-2032) (USD Billion)
12.3.14 Spain
12.3.14.1 Spain Price Comparison Websites (PCWs) Market Estimates And Forecasts, By Business Model (2021-2032) (USD Billion)
12.3.14.2 Spain Price Comparison Websites (PCWs) Market Estimates And Forecasts, By Service Scope (2021-2032) (USD Billion)
12.3.14.3 Spain Price Comparison Websites (PCWs) Market Estimates And Forecasts, By Data Source (2021-2032) (USD Billion)
12.3.14.4 Spain Price Comparison Websites (PCWs) Market Estimates And Forecasts, By Target Audience (2021-2032) (USD Billion)
12.3.14.5 Spain Price Comparison Websites (PCWs) Market Estimates And Forecasts, By Value-Added Services (2021-2032) (USD Billion)
12.3.15 Rest Of Europe
12.3.15.1 Rest Of Western Europe Price Comparison Websites (PCWs) Market Estimates And Forecasts, By Business Model (2021-2032) (USD Billion)
12.3.15.2 Rest Of Western Europe Price Comparison Websites (PCWs) Market Estimates And Forecasts, By Service Scope (2021-2032) (USD Billion)
12.3.15.3 Rest Of Western Europe Price Comparison Websites (PCWs) Market Estimates And Forecasts, By Data Source (2021-2032) (USD Billion)
12.3.15.4 Rest Of Western Europe Price Comparison Websites (PCWs) Market Estimates And Forecasts, By Target Audience (2021-2032) (USD Billion)
12.3.15.5 Rest Of Western Europe Price Comparison Websites (PCWs) Market Estimates And Forecasts, By Value-Added Services (2021-2032) (USD Billion)
12.4 Asia Pacific
12.4.1 Trends Analysis
12.4.2 Asia Pacific Price Comparison Websites (PCWs) Market Estimates And Forecasts, By Country (2021-2032) (USD Billion)
12.4.3 Asia Pacific Price Comparison Websites (PCWs) Market Estimates And Forecasts, By Business Model (2021-2032) (USD Billion)
12.4.4 Asia Pacific Price Comparison Websites (PCWs) Market Estimates And Forecasts, By Service Scope (2021-2032) (USD Billion)
12.4.5 Asia Pacific Price Comparison Websites (PCWs) Market Estimates And Forecasts, By Data Source (2021-2032) (USD Billion)
12.4.6 Asia Pacific Price Comparison Websites (PCWs) Market Estimates And Forecasts, By Target Audience (2021-2032) (USD Billion)
12.4.7 Asia Pacific Price Comparison Websites (PCWs) Market Estimates And Forecasts, By Value-Added Services (2021-2032) (USD Billion)
12.4.8 China
12.4.8.1 China Price Comparison Websites (PCWs) Market Estimates And Forecasts, By Business Model (2021-2032) (USD Billion)
12.4.8.2 China Price Comparison Websites (PCWs) Market Estimates And Forecasts, By Service Scope (2021-2032) (USD Billion)
12.4.8.3 China Price Comparison Websites (PCWs) Market Estimates And Forecasts, By Data Source (2021-2032) (USD Billion)
12.4.8.4 China Price Comparison Websites (PCWs) Market Estimates And Forecasts, By Target Audience (2021-2032) (USD Billion)
12.4.8.5 China Price Comparison Websites (PCWs) Market Estimates And Forecasts, By Value-Added Services (2021-2032) (USD Billion)
12.4.9 India
12.4.9.1 India Price Comparison Websites (PCWs) Market Estimates And Forecasts, By Business Model (2021-2032) (USD Billion)
12.4.9.2 India Price Comparison Websites (PCWs) Market Estimates And Forecasts, By Service Scope (2021-2032) (USD Billion)
12.4.9.3 India Price Comparison Websites (PCWs) Market Estimates And Forecasts, By Data Source (2021-2032) (USD Billion)
12.4.9.4 India Price Comparison Websites (PCWs) Market Estimates And Forecasts, By Target Audience (2021-2032) (USD Billion)
12.4.9.5 India Price Comparison Websites (PCWs) Market Estimates And Forecasts, By Value-Added Services (2021-2032) (USD Billion)
12.4.10 Japan
12.4.10.1 Japan Price Comparison Websites (PCWs) Market Estimates And Forecasts, By Business Model (2021-2032) (USD Billion)
12.4.10.2 Japan Price Comparison Websites (PCWs) Market Estimates And Forecasts, By Service Scope (2021-2032) (USD Billion)
12.4.10.3 Japan Price Comparison Websites (PCWs) Market Estimates And Forecasts, By Data Source (2021-2032) (USD Billion)
12.4.10.4 Japan Price Comparison Websites (PCWs) Market Estimates And Forecasts, By Target Audience (2021-2032) (USD Billion)
12.4.10.5 Japan Price Comparison Websites (PCWs) Market Estimates And Forecasts, By Value-Added Services (2021-2032) (USD Billion)
12.4.11 South Korea
12.4.11.1 South Korea Price Comparison Websites (PCWs) Market Estimates And Forecasts, By Business Model (2021-2032) (USD Billion)
12.4.11.2 South Korea Price Comparison Websites (PCWs) Market Estimates And Forecasts, By Service Scope (2021-2032) (USD Billion)
12.4.11.3 South Korea Price Comparison Websites (PCWs) Market Estimates And Forecasts, By Data Source (2021-2032) (USD Billion)
12.4.11.4 South Korea Price Comparison Websites (PCWs) Market Estimates And Forecasts, By Target Audience (2021-2032) (USD Billion)
12.4.11.5 South Korea Price Comparison Websites (PCWs) Market Estimates And Forecasts, By Value-Added Services (2021-2032) (USD Billion)
12.4.12 Singapore
12.4.12.1 Singapore Price Comparison Websites (PCWs) Market Estimates And Forecasts, By Business Model (2021-2032) (USD Billion)
12.4.12.2 Singapore Price Comparison Websites (PCWs) Market Estimates And Forecasts, By Service Scope (2021-2032) (USD Billion)
12.4.12.3 Singapore Price Comparison Websites (PCWs) Market Estimates And Forecasts, By Data Source (2021-2032) (USD Billion)
12.4.12.4 Singapore Price Comparison Websites (PCWs) Market Estimates And Forecasts, By Target Audience (2021-2032) (USD Billion)
12.4.12.5 Singapore Price Comparison Websites (PCWs) Market Estimates And Forecasts, By Value-Added Services (2021-2032) (USD Billion)
12.4.13 Australia
12.4.13.1 Australia Price Comparison Websites (PCWs) Market Estimates And Forecasts, By Business Model (2021-2032) (USD Billion)
12.4.13.2 Australia Price Comparison Websites (PCWs) Market Estimates And Forecasts, By Service Scope (2021-2032) (USD Billion)
12.4.13.3 Australia Price Comparison Websites (PCWs) Market Estimates And Forecasts, By Data Source (2021-2032) (USD Billion)
12.4.13.4 Australia Price Comparison Websites (PCWs) Market Estimates And Forecasts, By Target Audience (2021-2032) (USD Billion)
12.4.13.5 Australia Price Comparison Websites (PCWs) Market Estimates And Forecasts, By Value-Added Services (2021-2032) (USD Billion)
12.4.14 Rest Of Asia Pacific
12.4.14.1 Rest Of Asia Pacific Price Comparison Websites (PCWs) Market Estimates And Forecasts, By Business Model (2021-2032) (USD Billion)
12.4.14.2 Rest Of Asia Pacific Price Comparison Websites (PCWs) Market Estimates And Forecasts, By Service Scope (2021-2032) (USD Billion)
12.4.14.3 Rest Of Asia Pacific Price Comparison Websites (PCWs) Market Estimates And Forecasts, By Data Source (2021-2032) (USD Billion)
12.4.14.4 Rest Of Asia Pacific Price Comparison Websites (PCWs) Market Estimates And Forecasts, By Target Audience (2021-2032) (USD Billion)
12.4.14.5 Rest Of Asia Pacific Price Comparison Websites (PCWs) Market Estimates And Forecasts, By Value-Added Services (2021-2032) (USD Billion)
12.5 Middle East And Africa
12.5.1 Trends Analysis
12.5.2 Middle East And Africa Price Comparison Websites (PCWs) Market Estimates And Forecasts, By Country (2021-2032) (USD Billion)
12.5.3 Middle East And Africa Price Comparison Websites (PCWs) Market Estimates And Forecasts, By Business Model (2021-2032) (USD Billion)
12.5.4 Middle East And Africa Price Comparison Websites (PCWs) Market Estimates And Forecasts, By Service Scope (2021-2032) (USD Billion)
12.5.5 Middle East And Africa Price Comparison Websites (PCWs) Market Estimates And Forecasts, By Data Source (2021-2032) (USD Billion)
12.5.6 Middle East And Africa Price Comparison Websites (PCWs) Market Estimates And Forecasts, By Target Audience (2021-2032) (USD Billion)
12.5.7 Middle East And Africa Price Comparison Websites (PCWs) Market Estimates And Forecasts, By Value-Added Services (2021-2032) (USD Billion)
12.5.8 UAE
12.5.8.1 UAE Price Comparison Websites (PCWs) Market Estimates And Forecasts, By Business Model (2021-2032) (USD Billion)
12.5.8.2 UAE Price Comparison Websites (PCWs) Market Estimates And Forecasts, By Service Scope (2021-2032) (USD Billion)
12.5.8.3 UAE Price Comparison Websites (PCWs) Market Estimates And Forecasts, By Data Source (2021-2032) (USD Billion)
12.5.8.4 UAE Price Comparison Websites (PCWs) Market Estimates And Forecasts, By Target Audience (2021-2032) (USD Billion)
12.5.8.5 UAE Price Comparison Websites (PCWs) Market Estimates And Forecasts, By Value-Added Services (2021-2032) (USD Billion)
12.5.9 Saudi Arabia
12.5.9.1 Saudi Arabia Price Comparison Websites (PCWs) Market Estimates And Forecasts, By Business Model (2021-2032) (USD Billion)
12.5.9.2 Saudi Arabia Price Comparison Websites (PCWs) Market Estimates And Forecasts, By Service Scope (2021-2032) (USD Billion)
12.5.9.3 Saudi Arabia Price Comparison Websites (PCWs) Market Estimates And Forecasts, By Data Source (2021-2032) (USD Billion)
12.5.9.4 Saudi Arabia Price Comparison Websites (PCWs) Market Estimates And Forecasts, By Target Audience (2021-2032) (USD Billion)
12.5.9.5 Saudi Arabia Price Comparison Websites (PCWs) Market Estimates And Forecasts, By Value-Added Services (2021-2032) (USD Billion)
12.5.10 Qatar
12.5.10.1 Qatar Price Comparison Websites (PCWs) Market Estimates And Forecasts, By Business Model (2021-2032) (USD Billion)
12.5.10.2 Qatar Price Comparison Websites (PCWs) Market Estimates And Forecasts, By Service Scope (2021-2032) (USD Billion)
12.5.10.3 Qatar Price Comparison Websites (PCWs) Market Estimates And Forecasts, By Data Source (2021-2032) (USD Billion)
12.5.10.4 Qatar Price Comparison Websites (PCWs) Market Estimates And Forecasts, By Target Audience (2021-2032) (USD Billion)
12.5.10.5 Qatar Price Comparison Websites (PCWs) Market Estimates And Forecasts, By Value-Added Services (2021-2032) (USD Billion)
12.5.11 South Africa
12.5.11.1 South Africa Price Comparison Websites (PCWs) Market Estimates And Forecasts, By Business Model (2021-2032) (USD Billion)
12.5.11.2 South Africa Price Comparison Websites (PCWs) Market Estimates And Forecasts, By Service Scope (2021-2032) (USD Billion)
12.5.11.3 South Africa Price Comparison Websites (PCWs) Market Estimates And Forecasts, By Data Source (2021-2032) (USD Billion)
12.5.11.4 South Africa Price Comparison Websites (PCWs) Market Estimates And Forecasts, By Target Audience (2021-2032) (USD Billion)
12.5.11.5 South Africa Price Comparison Websites (PCWs) Market Estimates And Forecasts, By Value-Added Services (2021-2032) (USD Billion)
12.5.12 Rest Of Africa
12.5.12.1 Rest Of Africa Price Comparison Websites (PCWs) Market Estimates And Forecasts, By Business Model (2021-2032) (USD Billion)
12.5.12.2 Rest Of Africa Price Comparison Websites (PCWs) Market Estimates And Forecasts, By Service Scope (2021-2032) (USD Billion)
12.5.12.3 Rest Of Africa Price Comparison Websites (PCWs) Market Estimates And Forecasts, By Data Source (2021-2032) (USD Billion)
12.5.12.4 Rest Of Africa Price Comparison Websites (PCWs) Market Estimates And Forecasts, By Target Audience (2021-2032) (USD Billion)
12.5.12.5 Rest Of Africa Price Comparison Websites (PCWs) Market Estimates And Forecasts, By Value-Added Services (2021-2032) (USD Billion)
12.6 Latin America
12.6.1 Trends Analysis
12.6.2 Latin America Price Comparison Websites (PCWs) Market Estimates And Forecasts, By Country (2021-2032) (USD Billion)
12.6.3 Latin America Price Comparison Websites (PCWs) Market Estimates And Forecasts, By Business Model (2021-2032) (USD Billion)
12.6.4 Latin America Price Comparison Websites (PCWs) Market Estimates And Forecasts, By Service Scope (2021-2032) (USD Billion)
12.6.5 Latin America Price Comparison Websites (PCWs) Market Estimates And Forecasts, By Data Source (2021-2032) (USD Billion)
12.6.6 Latin America Price Comparison Websites (PCWs) Market Estimates And Forecasts, By Target Audience (2021-2032) (USD Billion)
12.6.7 Latin America Price Comparison Websites (PCWs) Market Estimates And Forecasts, By Value-Added Services (2021-2032) (USD Billion)
12.6.8 Brazil
12.6.8.1 Brazil Price Comparison Websites (PCWs) Market Estimates And Forecasts, By Business Model (2021-2032) (USD Billion)
12.6.8.2 Brazil Price Comparison Websites (PCWs) Market Estimates And Forecasts, By Service Scope (2021-2032) (USD Billion)
12.6.8.3 Brazil Price Comparison Websites (PCWs) Market Estimates And Forecasts, By Data Source (2021-2032) (USD Billion)
12.6.8.4 Brazil Price Comparison Websites (PCWs) Market Estimates And Forecasts, By Target Audience (2021-2032) (USD Billion)
12.6.8.5 Brazil Price Comparison Websites (PCWs) Market Estimates And Forecasts, By Value-Added Services (2021-2032) (USD Billion)
12.6.9 Argentina
12.6.9.1 Argentina Price Comparison Websites (PCWs) Market Estimates And Forecasts, By Business Model (2021-2032) (USD Billion)
12.6.9.2 Argentina Price Comparison Websites (PCWs) Market Estimates And Forecasts, By Service Scope (2021-2032) (USD Billion)
12.6.9.3 Argentina Price Comparison Websites (PCWs) Market Estimates And Forecasts, By Data Source (2021-2032) (USD Billion)
12.6.9.4 Argentina Price Comparison Websites (PCWs) Market Estimates And Forecasts, By Target Audience (2021-2032) (USD Billion)
12.6.9.5 Argentina Price Comparison Websites (PCWs) Market Estimates And Forecasts, By Value-Added Services (2021-2032) (USD Billion)
12.6.10 Rest Of Latin America
12.6.10.1 Rest Of Latin America Price Comparison Websites (PCWs) Market Estimates And Forecasts, By Business Model (2021-2032) (USD Billion)
12.6.10.2 Rest Of Latin America Price Comparison Websites (PCWs) Market Estimates And Forecasts, By Service Scope (2021-2032) (USD Billion)
12.6.10.3 Rest Of Latin America Price Comparison Websites (PCWs) Market Estimates And Forecasts, By Data Source (2021-2032) (USD Billion)
12.6.10.4 Rest Of Latin America Price Comparison Websites (PCWs) Market Estimates And Forecasts, By Target Audience (2021-2032) (USD Billion)
12.6.10.5 Rest Of Latin America Price Comparison Websites (PCWs) Market Estimates And Forecasts, By Value-Added Services (2021-2032) (USD Billion)
13. Company Profiles
13.1 Shopzilla
13.1.1 Company Overview
13.1.2 Financial
13.1.3 Products/ Services Offered
13.1.4 SWOT Analysis
13.2 Priceline
13.2.1 Company Overview
13.2.2 Financial
13.2.3 Products/ Services Offered
13.2.4 SWOT Analysis
13.3 Kayak
13.3.1 Company Overview
13.3.2 Financial
13.3.3 Products/ Services Offered
13.3.4 SWOT Analysis
13.4 Expedia
13.4.1 Company Overview
13.4.2 Financial
13.4.3 Products/ Services Offered
13.4.4 SWOT Analysis
13.5 Orbitz
13.5.1 Company Overview
13.5.2 Financial
13.5.3 Products/ Services Offered
13.5.4 SWOT Analysis
13.6 Travelocity
13.6.1 Company Overview
13.6.2 Financial
13.6.3 Products/ Services Offered
13.6.4 SWOT Analysis
13.7 Google
13.7.1 Company Overview
13.7.2 Financial
13.7.3 Products/ Services Offered
13.7.4 SWOT Analysis
13.8 Yahoo
13.8.1 Company Overview
13.8.2 Financial
13.8.3 Products/ Services Offered
13.8.4 SWOT Analysis
13.9 Bing
13.9.1 Company Overview
13.9.2 Financial
13.9.3 Products/ Services Offered
13.9.4 SWOT Analysis
13.10 Booking Holdings
13.10.1 Company Overview
13.10.2 Financial
13.10.3 Products/ Services Offered
13.10.4 SWOT Analysis
14. Use Cases and Best Practices
15. Conclusion
An accurate research report requires proper strategizing as well as implementation. There are multiple factors involved in the completion of good and accurate research report and selecting the best methodology to compete the research is the toughest part. Since the research reports we provide play a crucial role in any company’s decision-making process, therefore we at SNS Insider always believe that we should choose the best method which gives us results closer to reality. This allows us to reach at a stage wherein we can provide our clients best and accurate investment to output ratio.
Each report that we prepare takes a timeframe of 350-400 business hours for production. Starting from the selection of titles through a couple of in-depth brain storming session to the final QC process before uploading our titles on our website we dedicate around 350 working hours. The titles are selected based on their current market cap and the foreseen CAGR and growth.
The 5 steps process:
Step 1: Secondary Research:
Secondary Research or Desk Research is as the name suggests is a research process wherein, we collect data through the readily available information. In this process we use various paid and unpaid databases which our team has access to and gather data through the same. This includes examining of listed companies’ annual reports, Journals, SEC filling etc. Apart from this our team has access to various associations across the globe across different industries. Lastly, we have exchange relationships with various university as well as individual libraries.
Step 2: Primary Research
When we talk about primary research, it is a type of study in which the researchers collect relevant data samples directly, rather than relying on previously collected data. This type of research is focused on gaining content specific facts that can be sued to solve specific problems. Since the collected data is fresh and first hand therefore it makes the study more accurate and genuine.
We at SNS Insider have divided Primary Research into 2 parts.
Part 1 wherein we interview the KOLs of major players as well as the upcoming ones across various geographic regions. This allows us to have their view over the market scenario and acts as an important tool to come closer to the accurate market numbers. As many as 45 paid and unpaid primary interviews are taken from both the demand and supply side of the industry to make sure we land at an accurate judgement and analysis of the market.
This step involves the triangulation of data wherein our team analyses the interview transcripts, online survey responses and observation of on filed participants. The below mentioned chart should give a better understanding of the part 1 of the primary interview.
Part 2: In this part of primary research the data collected via secondary research and the part 1 of the primary research is validated with the interviews from individual consultants and subject matter experts.
Consultants are those set of people who have at least 12 years of experience and expertise within the industry whereas Subject Matter Experts are those with at least 15 years of experience behind their back within the same space. The data with the help of two main processes i.e., FGDs (Focused Group Discussions) and IDs (Individual Discussions). This gives us a 3rd party nonbiased primary view of the market scenario making it a more dependable one while collation of the data pointers.
Step 3: Data Bank Validation
Once all the information is collected via primary and secondary sources, we run that information for data validation. At our intelligence centre our research heads track a lot of information related to the market which includes the quarterly reports, the daily stock prices, and other relevant information. Our data bank server gets updated every fortnight and that is how the information which we collected using our primary and secondary information is revalidated in real time.
Step 4: QA/QC Process
After all the data collection and validation our team does a final level of quality check and quality assurance to get rid of any unwanted or undesired mistakes. This might include but not limited to getting rid of the any typos, duplication of numbers or missing of any important information. The people involved in this process include technical content writers, research heads and graphics people. Once this process is completed the title gets uploader on our platform for our clients to read it.
Step 5: Final QC/QA Process:
This is the last process and comes when the client has ordered the study. In this process a final QA/QC is done before the study is emailed to the client. Since we believe in giving our clients a good experience of our research studies, therefore, to make sure that we do not lack at our end in any way humanly possible we do a final round of quality check and then dispatch the study to the client.
Key Segments:
By Business Model
Free Service
Paid Subscription
Commission-Based
Hybrid (Combination of Models)
By Service Scope
General Merchandise
Travel and Hospitality
Financial Services
Electronics
Software and Technology
By Target Audience
Consumers
Businesses
Students
Senior Citizens
Budget-Conscious Individuals
By Data Source
Retailer Websites
Manufacturer Data
User Reviews
Crowdsourced Data
Artificial Intelligence (AI)
By Value-Added Services
Product Recommendations
Price Alerts
Loyalty Programs
Exclusive Deals
Personalized Shopping Experiences
Request for Segment Customization as per your Business Requirement: Segment Customization Request
Regional Coverage:
North America
US
Canada
Mexico
Europe
Germany
France
UK
Italy
Spain
Poland
Turkey
Rest of Europe
Asia Pacific
China
India
Japan
South Korea
Singapore
Australia
Rest of Asia Pacific
Middle East & Africa
UAE
Saudi Arabia
Qatar
South Africa
Rest of Middle East & Africa
Latin America
Brazil
Argentina
Rest of Latin America
Request for Country Level Research Report: Country Level Customization Request
Available Customization
With the given market data, SNS Insider offers customization as per the company’s specific needs. The following customization options are available for the report:
Detailed Volume Analysis
Criss-Cross segment analysis (e.g. Product X Application)
Competitive Product Benchmarking
Geographic Analysis
Additional countries in any of the regions
Customized Data Representation
Detailed analysis and profiling of additional market players