image

Public Transportation Market Size & Overview

Public Transportation Market Revenue Analysis

Get More Information on Public Transportation Market - Request Sample Report

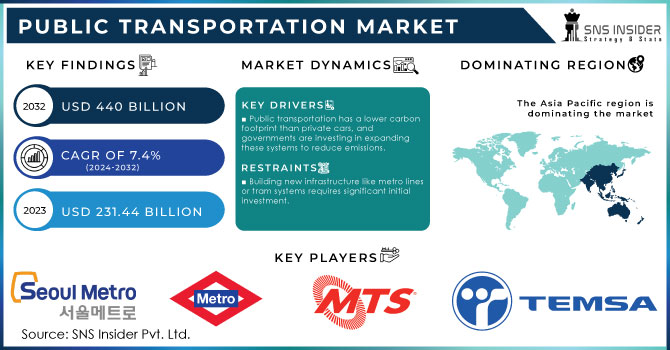
The Public Transportation Market size was valued at USD 231.44 billion in 2023 and is expected to reach USD 409.71 billion by 2031 and grow at a CAGR of 7.4% over the forecast period 2024-2031. As cities expand and populations rise, efficient and affordable transportation becomes a necessity. Public transportation systems provide a cost-effective way for people to commute to work, access education, and participate in social activities, reducing traffic congestion and reliance on personal vehicles. The growing environmental concerns are pushing a shift towards sustainable transportation options. Public transportation has a lower carbon footprint compared to private cars, contributing to cleaner air and reduced greenhouse gas emissions. Governments around the world are actively investing in expanding public transport infrastructure and promoting its use through subsidies and incentives.

Integration of intelligent transportation systems (ITS) is optimizing routes, improving passenger information, and streamlining fare collection.  For example, real-time arrival and departure information displayed at bus stops and train stations allows passengers to plan their journeys more efficiently. The cashless fare payment systems using mobile apps or contactless cards offer convenience and faster boarding times. High upfront costs for infrastructure development, particularly for new metro lines or tram systems, can be a hurdle. Ensuring efficient and well-maintained public transport networks requires ongoing investment, which can be a challenge for some municipalities.  

Public Transportation Market Dynamics:

Key Drivers:

  • Public transportation has a lower carbon footprint than private cars, and governments are investing in expanding these systems to reduce emissions.
  • As the cost of gasoline and diesel continues to rise, public transportation becomes a more affordable option for many people.

As the price at the pump goes up, individual car ownership and operation become a more significant financial burden for many people. This economic pressure creates a natural shift towards public transportation, which offers a more cost-effective way to travel. Rising fuel costs translate to a higher monthly budget dedicated solely to transportation. Public transportation, on the other hand, provides a fixed-rate option, regardless of fluctuating fuel prices. This predictability and affordability make it a more attractive choice, especially for budget-conscious individuals and families. The public transportation eliminates the need for car maintenance, further reducing transportation-related expenses.  The increasing cost of gasoline and diesel acts as a powerful incentive for people to explore and adopt public transportation, ultimately contributing to a more sustainable and economically viable transportation landscape.

Restraints:

  • Building new infrastructure like metro lines or tram systems requires significant initial investment.
  • The rise of ride-hailing apps like Uber and Lyft provides an alternative for some commuters, potentially impacting ridership on public transport.

The emergence of ride-hailing apps like Uber and Lyft has introduced a new competitor to public transportation, potentially impacting ridership. These app-based services offer on-demand car rides with features like convenient pick-up and drop-off locations, often perceived as more convenient than fixed public transport routes and schedules. This convenience factor, coupled with sometimes competitive pricing, can entice some commuters, particularly those who might have previously relied on buses or trains, to switch to ride-hailing services. This shift could lead to a decrease in public transport ridership, impacting revenue generation for public transport authorities.

Opportunities:

  • Collaboration between public authorities and private companies can accelerate infrastructure development and service innovation.
  • Prioritizing comfort, safety, and real-time information through upgrades and mobile apps can attract new riders.

Challenges:

  • Overcoming negative stereotypes about safety, cleanliness, or reliability is crucial to attracting new riders.

Public Transportation Market Segmentation:

by Distribution Channel

  • Online
  • Offline

Offline is the dominating sub-segment in the Public Transportation Market by distribution channel holding around 70-80% of market share. Public transportation ticketing is primarily dominated by offline channels. This dominance can be attributed to several factors.  The significant portion of the public transportation user base, particularly in developing economies, might lack access to smartphones or internet connectivity, making online ticketing impractical.  The fare collection systems at stations and onboard vehicles are often not yet fully integrated with online payment options. Some users prefer the familiarity and convenience of purchasing tickets in person at kiosks or booths, especially for occasional travellers or those buying multi-day passes.

by Mode Type

  • Road
  • Rail
  • Others

Road is the dominating sub-segment in the Public Transportation Market by mode type. Road-based public transportation, encompassing buses, trams, and trolleybuses, remains the dominant mode type in the Public Transportation Market. Road-based systems offer greater flexibility in terms of route planning, allowing them to reach more neighbourhoods and cater to diverse travel needs within a city. The upfront cost of establishing and maintaining road infrastructure is generally lower compared to rail systems. The buses can be easily rerouted to navigate traffic congestion or accommodate special events, offering adaptability that fixed rail lines might lack.

by End Use

  • Intracity
  • Intercity
  • Others

Intracity is the dominating sub-segment in the Public Transportation Market by end use. Intracity travel, encompassing daily commutes within a city or urban area, represents the dominant segment in the Public Transportation Market. This dominance is primarily driven by the high concentration of population and workplaces within cities.  Public transportation systems provide a cost-effective and efficient way for residents to navigate urban centres, reducing traffic congestion and reliance on personal vehicles.  Intracity routes typically experience high passenger volumes throughout the day, making them a significant revenue generator for public transport authorities.

by Application

  • Rural
  • Urban

by Mobility

  • Bus  
  • Tram  
  • Train  
  • Car Sharing
  • Others

by Propulsion

  • Diesel
  • Gasoline
  • Electric
  • Others

Public Transportation Market Segment Analysis

Get Customized Report as per your Business Requirement - Request For Customized Report

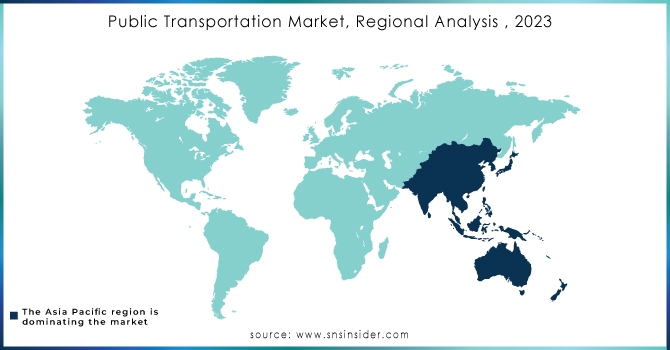
Public Transportation Market Regional Analyses

The Asia Pacific is the dominating region in the Public Transportation Market holding around 45-50% of market share. The rapid urbanization across Asian countries is driving the demand for efficient and affordable transportation solutions. The stringent emission regulations and growing environmental awareness are propelling a shift towards public transportation as a more sustainable alternative to private vehicles.

Europe holds the second-highest position in the Public Transportation Market. This strong presence is driven by a well-established and well-integrated public transport network across many European countries. The high population density in urban areas creates a demand for efficient public transportation systems to manage traffic congestion.

The Middle East and Africa region is experiencing the fastest growth trajectory in the Public Transportation Market, with the Compound Annual Growth Rate (CAGR) exceeding 6%. The increasing government investments in infrastructure development, including metro lines and bus rapid transit systems, are expanding public transportation options in many countries.


Regional Coverage:

North America

  • US

  • Canada

  • Mexico

Europe

  • Eastern Europe

    • Poland

    • Romania

    • Hungary

    • Turkey

    • Rest of Eastern Europe

  • Western Europe

    • Germany

    • France

    • UK

    • Italy

    • Spain

    • Netherlands

    • Switzerland

    • Austria

    • Rest of Western Europe

Asia Pacific

  • China

  • India

  • Japan

  • South Korea

  • Vietnam

  • Singapore

  • Australia

  • Rest of Asia Pacific

Middle East & Africa

  • Middle East

    • UAE

    • Egypt

    • Saudi Arabia

    • Qatar

    • Rest of the Middle East

  • Africa

    • Nigeria

    • South Africa

    • Rest of Africa

Latin America

  • Brazil

  • Argentina

  • Colombia

  • Rest of Latin America

Key Players in Public Transportation Market

The major key players are Seoul Metro (South Korea), Madrid Metro, Transport For London (UK), The San Diego Metropolitan Transit System (US), TEMSA Global, MTR Corporation (Hong Kong), Metropolitan Transportation Authority (US), Gillig Corporation, Chicago Transit Authority (US), Bay Area Rapid Transit (BART) (US), and Massachusetts Bay Transportation Authority (US) and other key players.

Madrid Metro-Company Financial Analysis

Public Transportation Market Recent Development

  • In Jan. 2024: Senegal's President Macky Sall has launched a new fleet of e-buses in Dakar's public transport network. This initiative aims to enhance transportation sustainability and curb carbon emissions, marking a pivotal move towards greener mobility and combatting urban pollution. The e-buses offer a cleaner commuting option, promoting a sustainable transportation system for Dakar's residents.

  • In Dec. 2023: China prioritizes safety for self-driving public transport with new rules. These cover passenger well-being, secure operations, and emergency plans. They require passenger monitoring, speed limits, and malfunction shutdowns, while mandating software updates, network protection, and unforeseen scenario handling.

Public Transportation Market Report Scope:

Report Attributes Details
Market Size in 2023 US$ 231.44 Billion
Market Size by 2031 US$ 409.71 Billion
CAGR CAGR of 7.4% From 2024 to 2031
Base Year 2023
Forecast Period 2024-2031
Historical Data 2020-2022
Report Scope & Coverage Market Size, Segments Analysis, Competitive  Landscape, Regional Analysis, DROC & SWOT Analysis, Forecast Outlook
Key Segments • by Type (Bus, Light rail, Metro, Regional taxi, Tram)
• by Application (Rural, City),
Regional Analysis/Coverage North America (USA, Canada, Mexico), Europe
(Germany, UK, France, Italy, Spain, Netherlands,
Rest of Europe), Asia-Pacific (Japan, South Korea,
China, India, Australia, Rest of Asia-Pacific), The
Middle East & Africa (Israel, UAE, South Africa,
Rest of Middle East & Africa), Latin America (Brazil, Argentina, Rest of Latin America)
Company Profiles Seoul Metro (South Korea), Madrid Metro, Transport For London (UK), The San Diego Metropolitan Transit System (US), TEMSA Global, MTR Corporation (Hong Kong), Metropolitan Transportation Authority (US), Gillig Corporation, Chicago Transit Authority (US), Bay Area Rapid Transit (BART) (US), and Massachusetts Bay Transportation Authority (US)
Key Drivers •Consumer preferences are shifting toward carpooling, train travel, ride-sharing, air travel, and bus travel.

•Increase in urban population and easier and more convenient transportation for these people.

•Many raw material supplying industries are shifting their focus to distributing their goods via public transportation.
RESTRAINTS •Commute preference for passenger automobiles and two-wheelers is growing.

•Political systems that favor public transportation investments stifle global market expansion.

Frequently Asked Questions

CAGR of Public Transportation market is 7.4% over the forecast period 2024-2031.

Public Transportation Market Size was valued at USD 231.44 billion in 2023.

Forecast period of Public Transportation market is 2024-2031.

  • Consumer preferences are shifting toward carpooling, train travel, ride-sharing, air travel, and bus travel.
  • Increase in urban population and easier and more convenient transportation for these people.

Asia Pacific region is dominating the Public Transportation Market.

TABLE OF CONTENTS

1. Introduction
1.1 Market Definition
1.2 Scope
1.3 Research Assumptions

2. Industry Flowchart

3. Research Methodology

4. Market Dynamics
4.1 Drivers
4.2 Restraints
4.3 Opportunities
4.4 Challenge

5. Porter’s 5 Forces Model

6.  Pest Analysis

7. Public Transportation Market Segmentation, by Distribution Channel
7.1 Introduction
7.2 Online
7.3 Offline

8. Public Transportation Market Segmentation, by Mode Type
8.1 Introduction
8.2 Road
8.3 Rail
8.4 Others

9. Public Transportation Market Segmentation, by End Use
9.1 Introduction
9.2 Intracity
9.3 Intercity
9.4 Others

10. Public Transportation Market Segmentation, by Application
10.1 Introduction
10.2 Rural
10.3 Urban

11. Public Transportation Market Segmentation, by Mobility
11.1 Introduction
11.2 Bus
11.3 Tram
11.4 Train
11.5 Car Sharing
11.6 Others

12. Public Transportation Market Segmentation, by Propulsion
12.1 Introduction
12.2 Diesel
12.3 Gasoline
12.4 Electric
12.5 Others

13. Regional Analysis
13.1 Introduction
13.2 North America
13.2.1 Trend Analysis
13.2.2 North America Public Transportation Market, by Country
13.2.3 North America Public Transportation Market Segmentation, by Distribution Channel
13.2.4 North America Public Transportation Market Segmentation, by Mode Type
13.2.5 North America Public Transportation Market Segmentation, by End Use
13.2.6 North America Public Transportation Market Segmentation, by Application
13.2.7 North America Public Transportation Market Segmentation, by Mobility
13.2.8 North America Public Transportation Market Segmentation, by Propulsion
13.2.9 USA
13.2.9.1 USA Public Transportation Market Segmentation, by Distribution Channel
13.2.9.2 USA Public Transportation Market Segmentation, by Mode Type
13.2.9.3 USA Public Transportation Market Segmentation, by End Use
13.2.9.4 USA Public Transportation Market Segmentation, by Application
13.2.9.5 USA Public Transportation Market Segmentation, by Mobility
13.2.9.6 USA Public Transportation Market Segmentation, by Propulsion
13.2.10 Canada
13.2.10.1 Canada Public Transportation Market Segmentation, by Distribution Channel
13.2.10.2 Canada Public Transportation Market Segmentation, by Mode Type
13.2.10.3 Canada Public Transportation Market Segmentation, by End Use
13.2.10.4 Canada Public Transportation Market Segmentation, by Application
13.2.10.5 Canada Public Transportation Market Segmentation, by Mobility
13.2.10.6 Canada Public Transportation Market Segmentation, by Propulsion
13.2.11 Mexico
13.2.11.1 Mexico Public Transportation Market Segmentation, by Distribution Channel
13.2.11.2 Mexico Public Transportation Market Segmentation, by Mode Type
13.2.11.3 Mexico Public Transportation Market Segmentation, by End Use
13.2.11.4 Mexico Public Transportation Market Segmentation, by Application
13.2.11.5 Mexico Public Transportation Market Segmentation, by Mobility
13.2.11.6 Mexico Public Transportation Market Segmentation, by Propulsion
13.3 Europe
13.3.1 Trend Analysis
13.3.2 Eastern Europe
13.3.2.1 Eastern Europe Public Transportation Market, by Country
13.3.2.2 Eastern Europe Public Transportation Market Segmentation, by Distribution Channel
13.3.2.3 Eastern Europe Public Transportation Market Segmentation, by Mode Type
13.3.2.4 Eastern Europe Public Transportation Market Segmentation, by End Use
13.3.2.5 Eastern Europe Public Transportation Market Segmentation, by Application
13.3.2.6 Eastern Europe Public Transportation Market Segmentation, by Mobility
13.3.2.7 Eastern Europe Public Transportation Market Segmentation, by Propulsion
13.3.2.8 Poland
13.3.2.8.1 Poland Public Transportation Market Segmentation, by Distribution Channel
13.3.2.8.2 Poland Public Transportation Market Segmentation, by Mode Type
13.3.2.8.3 Poland Public Transportation Market Segmentation, by End Use
13.3.2.8.4 Poland Public Transportation Market Segmentation, by Application
13.3.2.8.5 Poland Public Transportation Market Segmentation, by Mobility
13.3.2.8.6 Poland Public Transportation Market Segmentation, by Propulsion
13.3.2.9 Romania
13.3.2.9.1 Romania Public Transportation Market Segmentation, by Distribution Channel
13.3.2.9.2 Romania Public Transportation Market Segmentation, by Mode Type
13.3.2.9.3 Romania Public Transportation Market Segmentation, by End Use
13.3.2.9.4 Romania Public Transportation Market Segmentation, by Application
13.3.2.9.5 Romania Public Transportation Market Segmentation, by Mobility
13.3.2.9.6 Romania Public Transportation Market Segmentation, by Propulsion
13.3.2.10 Hungary
13.3.2.10.1 Hungary Public Transportation Market Segmentation, by Distribution Channel
13.3.2.10.2 Hungary Public Transportation Market Segmentation, by Mode Type
13.3.2.10.3 Hungary Public Transportation Market Segmentation, by End Use
13.3.2.10.4 Hungary Public Transportation Market Segmentation, by Application
13.3.2.10.5 Hungary Public Transportation Market Segmentation, by Mobility
13.3.2.10.6 Hungary Public Transportation Market Segmentation, by Propulsion
13.3.2.11 Turkey
13.3.2.11.1 Turkey Public Transportation Market Segmentation, by Distribution Channel
13.3.2.11.2 Turkey Public Transportation Market Segmentation, by Mode Type
13.3.2.11.3 Turkey Public Transportation Market Segmentation, by End Use
13.3.2.11.4 Turkey Public Transportation Market Segmentation, by Application
13.3.2.11.5 Turkey Public Transportation Market Segmentation, by Mobility
13.3.2.11.6 Turkey Public Transportation Market Segmentation, by Propulsion
13.3.2.12 Rest of Eastern Europe
13.3.2.12.1 Rest of Eastern Europe Public Transportation Market Segmentation, by Distribution Channel
13.3.2.12.2 Rest of Eastern Europe Public Transportation Market Segmentation, by Mode Type
13.3.2.12.3 Rest of Eastern Europe Public Transportation Market Segmentation, by End Use
13.3.2.12.4 Rest of Eastern Europe Public Transportation Market Segmentation, by Application
13.3.2.12.5 Rest of Eastern Europe Public Transportation Market Segmentation, by Mobility
13.3.2.12.6 Rest of Eastern Europe Public Transportation Market Segmentation, by Propulsion
13.3.3 Western Europe
13.3.3.1 Western Europe Public Transportation Market, by Country
13.3.3.2 Western Europe Public Transportation Market Segmentation, by Distribution Channel
13.3.3.3 Western Europe Public Transportation Market Segmentation, by Mode Type
13.3.3.4 Western Europe Public Transportation Market Segmentation, by End Use
13.3.3.5 Western Europe Public Transportation Market Segmentation, by Application
13.3.3.6 Western Europe Public Transportation Market Segmentation, by Mobility
13.3.3.7 Western Europe Public Transportation Market Segmentation, by Propulsion
13.3.3.8 Germany
13.3.3.8.1 Germany Public Transportation Market Segmentation, by Distribution Channel
13.3.3.8.2 Germany Public Transportation Market Segmentation, by Mode Type
13.3.3.8.3 Germany Public Transportation Market Segmentation, by End Use
13.3.3.8.4 Germany Public Transportation Market Segmentation, by Application
13.3.3.8.5 Germany Public Transportation Market Segmentation, by Mobility
13.3.3.8.6 Germany Public Transportation Market Segmentation, by Propulsion
13.3.3.9 France
13.3.3.9.1 France Public Transportation Market Segmentation, by Distribution Channel
13.3.3.9.2 France Public Transportation Market Segmentation, by Mode Type
13.3.3.9.3 France Public Transportation Market Segmentation, by End Use
13.3.3.9.4 France Public Transportation Market Segmentation, by Application
13.3.3.9.5 France Public Transportation Market Segmentation, by Mobility
13.3.3.9.6 France Public Transportation Market Segmentation, by Propulsion
13.3.3.10 UK
13.3.3.10.1 UK Public Transportation Market Segmentation, by Distribution Channel
13.3.3.10.2 UK Public Transportation Market Segmentation, by Mode Type
13.3.3.10.3 UK Public Transportation Market Segmentation, by End Use
13.3.3.10.4 UK Public Transportation Market Segmentation, by Application
13.3.3.10.5 UK Public Transportation Market Segmentation, by Mobility
13.3.3.10.6 UK Public Transportation Market Segmentation, by Propulsion
13.3.3.11 Italy
13.3.3.11.1 Italy Public Transportation Market Segmentation, by Distribution Channel
13.3.3.11.2 Italy Public Transportation Market Segmentation, by Mode Type
13.3.3.11.3 Italy Public Transportation Market Segmentation, by End Use
13.3.3.11.4 Italy Public Transportation Market Segmentation, by Application
13.3.3.11.5 Italy Public Transportation Market Segmentation, by Mobility
13.3.3.11.6 Italy Public Transportation Market Segmentation, by Propulsion
13.3.3.12 Spain
13.3.3.12.1 Spain Public Transportation Market Segmentation, by Distribution Channel
13.3.3.12.2 Spain Public Transportation Market Segmentation, by Mode Type
13.3.3.12.3 Spain Public Transportation Market Segmentation, by End Use
13.3.3.12.4 Spain Public Transportation Market Segmentation, by Application
13.3.3.12.5 Spain Public Transportation Market Segmentation, by Mobility
13.3.3.12.6 Spain Public Transportation Market Segmentation, by Propulsion
13.3.3.13 Netherlands
13.3.3.13.1 Netherlands Public Transportation Market Segmentation, by Distribution Channel
13.3.3.13.2 Netherlands Public Transportation Market Segmentation, by Mode Type
13.3.3.13.3 Netherlands Public Transportation Market Segmentation, by End Use
13.3.3.13.4 Netherlands Public Transportation Market Segmentation, by Application
13.3.3.13.5 Netherlands Public Transportation Market Segmentation, by Mobility
13.3.3.13.6 Netherlands Public Transportation Market Segmentation, by Propulsion
13.3.3.14 Switzerland
13.3.3.14.1 Switzerland Public Transportation Market Segmentation, by Distribution Channel
13.3.3.14.2 Switzerland Public Transportation Market Segmentation, by Mode Type
13.3.3.14.3 Switzerland Public Transportation Market Segmentation, by End Use
13.3.3.14.4 Switzerland Public Transportation Market Segmentation, by Application
13.3.3.14.5 Switzerland Public Transportation Market Segmentation, by Mobility
13.3.3.14.6 Switzerland Public Transportation Market Segmentation, by Propulsion
13.3.3.15 Austria
13.3.3.15.1 Austria Public Transportation Market Segmentation, by Distribution Channel
13.3.3.15.2 Austria Public Transportation Market Segmentation, by Mode Type
13.3.3.15.3 Austria Public Transportation Market Segmentation, by End Use
13.3.3.15.4 Austria Public Transportation Market Segmentation, by Application
13.3.3.15.5 Austria Public Transportation Market Segmentation, by Mobility
13.3.3.15.6 Austria Public Transportation Market Segmentation, by Propulsion
13.3.3.16 Rest of Western Europe
13.3.3.16.1 Rest of Western Europe Public Transportation Market Segmentation, by Distribution Channel
13.3.3.16.2 Rest of Western Europe Public Transportation Market Segmentation, by Mode Type
13.3.3.16.3 Rest of Western Europe Public Transportation Market Segmentation, by End Use
13.3.3.16.4 Rest of Western Europe Public Transportation Market Segmentation, by Application
13.3.3.16.5 Rest of Western Europe Public Transportation Market Segmentation, by Mobility
13.3.3.16.6 Rest of Western Europe Public Transportation Market Segmentation, by Propulsion
13.4 Asia-Pacific
13.4.1 Trend Analysis
13.4.2 Asia-Pacific Public Transportation Market, by Country
13.4.3 Asia-Pacific Public Transportation Market Segmentation, by Distribution Channel
13.4.4 Asia-Pacific Public Transportation Market Segmentation, by Mode Type
13.4.5 Asia-Pacific Public Transportation Market Segmentation, by End Use
13.4.6 Asia-Pacific Public Transportation Market Segmentation, by Application
13.4.7 Asia-Pacific Public Transportation Market Segmentation, by Mobility
13.4.8 Asia-Pacific Public Transportation Market Segmentation, by Propulsion
13.4.9 China
13.4.9.1 China Public Transportation Market Segmentation, by Distribution Channel
13.4.9.2 China Public Transportation Market Segmentation, by Mode Type
13.4.9.3 China Public Transportation Market Segmentation, by End Use
13.4.9.4 China Public Transportation Market Segmentation, by Application
13.4.9.5 China Public Transportation Market Segmentation, by Mobility
13.4.9.6 China Public Transportation Market Segmentation, by Propulsion
13.4.10 India
13.4.10.1 India Public Transportation Market Segmentation, by Distribution Channel
13.4.10.2 India Public Transportation Market Segmentation, by Mode Type
13.4.10.3 India Public Transportation Market Segmentation, by End Use
13.4.10.4 India Public Transportation Market Segmentation, by Application
13.4.10.5 India Public Transportation Market Segmentation, by Mobility
13.4.10.6 India Public Transportation Market Segmentation, by Propulsion
13.4.11 Japan
13.4.11.1 Japan Public Transportation Market Segmentation, by Distribution Channel
13.4.11.2 Japan Public Transportation Market Segmentation, by Mode Type
13.4.11.3 Japan Public Transportation Market Segmentation, by End Use
13.4.11.4 Japan Public Transportation Market Segmentation, by Application
13.4.11.5 Japan Public Transportation Market Segmentation, by Mobility
13.4.11.6 Japan Public Transportation Market Segmentation, by Propulsion
13.4.12 South Korea
13.4.12.1 South Korea Public Transportation Market Segmentation, by Distribution Channel
13.4.12.2 South Korea Public Transportation Market Segmentation, by Mode Type
13.4.12.3 South Korea Public Transportation Market Segmentation, by End Use
13.4.12.4 South Korea Public Transportation Market Segmentation, by Application
13.4.12.5 South Korea Public Transportation Market Segmentation, by Mobility
13.4.12.6 South Korea Public Transportation Market Segmentation, by Propulsion
13.4.13 Vietnam
13.4.13.1 Vietnam Public Transportation Market Segmentation, by Distribution Channel
13.4.13.2 Vietnam Public Transportation Market Segmentation, by Mode Type
13.4.13.3 Vietnam Public Transportation Market Segmentation, by End Use
13.4.13.4 Vietnam Public Transportation Market Segmentation, by Application
13.4.13.5 Vietnam Public Transportation Market Segmentation, by Mobility
13.4.13.6 Vietnam Public Transportation Market Segmentation, by Propulsion
13.4.14 Singapore
13.4.14.1 Singapore Public Transportation Market Segmentation, by Distribution Channel
13.4.14.2 Singapore Public Transportation Market Segmentation, by Mode Type
13.4.14.3 Singapore Public Transportation Market Segmentation, by End Use
13.4.14.4 Singapore Public Transportation Market Segmentation, by Application
13.4.14.5 Singapore Public Transportation Market Segmentation, by Mobility
13.4.14.6 Singapore Public Transportation Market Segmentation, by Propulsion
13.4.15 Australia
13.4.15.1 Australia Public Transportation Market Segmentation, by Distribution Channel
13.4.15.2 Australia Public Transportation Market Segmentation, by Mode Type
13.4.15.3 Australia Public Transportation Market Segmentation, by End Use
13.4.15.4 Australia Public Transportation Market Segmentation, by Application
13.4.15.5 Australia Public Transportation Market Segmentation, by Mobility
13.4.15.6 Australia Public Transportation Market Segmentation, by Propulsion
13.4.16 Rest of Asia-Pacific
13.4.16.1 Rest of Asia-Pacific Public Transportation Market Segmentation, by Distribution Channel
13.4.16.2 Rest of Asia-Pacific Public Transportation Market Segmentation, by Mode Type
13.4.16.3 Rest of Asia-Pacific Public Transportation Market Segmentation, by End Use
13.4.16.4 Rest of Asia-Pacific Public Transportation Market Segmentation, by Application
13.4.16.5 Rest of Asia-Pacific Public Transportation Market Segmentation, by Mobility
13.4.16.6 Rest of Asia-Pacific Public Transportation Market Segmentation, by Propulsion
13.5 Middle East & Africa
13.5.1 Trend Analysis
13.5.2 Middle East
13.5.2.1 Middle East Public Transportation Market, by Country
13.5.2.2 Middle East Public Transportation Market Segmentation, by Distribution Channel
13.5.2.3 Middle East Public Transportation Market Segmentation, by Mode Type
13.5.2.4 Middle East Public Transportation Market Segmentation, by End Use
13.5.2.5 Middle East Public Transportation Market Segmentation, by Application
13.5.2.6 Middle East Public Transportation Market Segmentation, by Mobility
13.5.2.7 Middle East Public Transportation Market Segmentation, by Propulsion
13.5.2.8 UAE
13.5.2.8.1 UAE Public Transportation Market Segmentation, by Distribution Channel
13.5.2.8.2 UAE Public Transportation Market Segmentation, by Mode Type
13.5.2.8.3 UAE Public Transportation Market Segmentation, by End Use
13.5.2.8.4 UAE Public Transportation Market Segmentation, by Application
13.5.2.8.5 UAE Public Transportation Market Segmentation, by Mobility
13.5.2.8.6 UAE Public Transportation Market Segmentation, by Propulsion
13.5.2.9 Egypt
13.5.2.9.1 Egypt Public Transportation Market Segmentation, by Distribution Channel
13.5.2.9.2 Egypt Public Transportation Market Segmentation, by Mode Type
13.5.2.9.3 Egypt Public Transportation Market Segmentation, by End Use
13.5.2.9.4 Egypt Public Transportation Market Segmentation, by Application
13.5.2.9.5 Egypt Public Transportation Market Segmentation, by Mobility
13.5.2.9.6 Egypt Public Transportation Market Segmentation, by Propulsion
13.5.2.10 Saudi Arabia
13.5.2.10.1 Saudi Arabia Public Transportation Market Segmentation, by Distribution Channel
13.5.2.10.2 Saudi Arabia Public Transportation Market Segmentation, by Mode Type
13.5.2.10.3 Saudi Arabia Public Transportation Market Segmentation, by End Use
13.5.2.10.4 Saudi Arabia Public Transportation Market Segmentation, by Application
13.5.2.10.5 Saudi Arabia Public Transportation Market Segmentation, by Mobility
13.5.2.10.6 Saudi Arabia Public Transportation Market Segmentation, by Propulsion
13.5.2.11 Qatar
13.5.2.11.1 Qatar Public Transportation Market Segmentation, by Distribution Channel
13.5.2.11.2 Qatar Public Transportation Market Segmentation, by Mode Type
13.5.2.11.3 Qatar Public Transportation Market Segmentation, by End Use
13.5.2.11.4 Qatar Public Transportation Market Segmentation, by Application
13.5.2.11.5 Qatar Public Transportation Market Segmentation, by Mobility
13.5.2.11.6 Qatar Public Transportation Market Segmentation, by Propulsion
13.5.2.12 Rest of Middle East
13.5.2.12.1 Rest of Middle East Public Transportation Market Segmentation, by Distribution Channel
13.5.2.12.2 Rest of Middle East Public Transportation Market Segmentation, by Mode Type
13.5.2.12.3 Rest of Middle East Public Transportation Market Segmentation, by End Use
13.5.2.12.4 Rest of Middle East Public Transportation Market Segmentation, by Application
13.5.2.12.5 Rest of Middle East Public Transportation Market Segmentation, by Mobility
13.5.2.12.6 Rest of Middle East Public Transportation Market Segmentation, by Propulsion
13.5.3 Africa
13.5.3.1 Africa Public Transportation Market, by Country
13.5.3.2 Africa Public Transportation Market Segmentation, by Distribution Channel
13.5.3.3 Africa Public Transportation Market Segmentation, by Mode Type
13.5.3.4 Africa Public Transportation Market Segmentation, by End Use
13.5.3.5 Africa Public Transportation Market Segmentation, by Application
13.5.3.6 Africa Public Transportation Market Segmentation, by Mobility
13.5.3.7 Africa Public Transportation Market Segmentation, by Propulsion
13.5.3.8 Nigeria
13.5.3.8.1 Nigeria Public Transportation Market Segmentation, by Distribution Channel
13.5.3.8.2 Nigeria Public Transportation Market Segmentation, by Mode Type
13.5.3.8.3 Nigeria Public Transportation Market Segmentation, by End Use
13.5.3.8.4 Nigeria Public Transportation Market Segmentation, by Application
13.5.3.8.5 Nigeria Public Transportation Market Segmentation, by Mobility
13.5.3.8.6 Nigeria Public Transportation Market Segmentation, by Propulsion
13.5.3.9 South Africa
13.5.3.9.1 South Africa Public Transportation Market Segmentation, by Distribution Channel
13.5.3.9.2 South Africa Public Transportation Market Segmentation, by Mode Type
13.5.3.9.3 South Africa Public Transportation Market Segmentation, by End Use
13.5.3.9.4 South Africa Public Transportation Market Segmentation, by Application
13.5.3.9.5 South Africa Public Transportation Market Segmentation, by Mobility
13.5.3.9.6 South Africa Public Transportation Market Segmentation, by Propulsion
13.5.3.10 Rest of Africa
13.5.3.10.1 Rest of Africa Public Transportation Market Segmentation, by Distribution Channel
13.5.3.10.2 Rest of Africa Public Transportation Market Segmentation, by Mode Type
13.5.3.10.3 Rest of Africa Public Transportation Market Segmentation, by End Use
13.5.3.10.4 Rest of Africa Public Transportation Market Segmentation, by Application
13.5.3.10.5 Rest of Africa Public Transportation Market Segmentation, by Mobility
13.5.3.10.6 Rest of Africa Public Transportation Market Segmentation, by Propulsion
13.6 Latin America
13.6.1 Trend Analysis
13.6.2 Latin America Public Transportation Market, by Country
13.6.3 Latin America Public Transportation Market Segmentation, by Distribution Channel
13.6.4 Latin America Public Transportation Market Segmentation, by Mode Type
13.6.5 Latin America Public Transportation Market Segmentation, by End Use
13.6.6 Latin America Public Transportation Market Segmentation, by Application
13.6.7 Latin America Public Transportation Market Segmentation, by Mobility
13.6.8 Latin America Public Transportation Market Segmentation, by Propulsion
13.6.9 Brazil
13.6.9.1 Brazil Public Transportation Market Segmentation, by Distribution Channel
13.6.9.2 Brazil Public Transportation Market Segmentation, by Mode Type
13.6.9.3 Brazil Public Transportation Market Segmentation, by End Use
13.6.9.4 Brazil Public Transportation Market Segmentation, by Application
13.6.9.5 Brazil Public Transportation Market Segmentation, by Mobility
13.6.9.6 Brazil Public Transportation Market Segmentation, by Propulsion
13.6.10 Argentina
13.6.10.1 Argentina Public Transportation Market Segmentation, by Distribution Channel
13.6.10.2 Argentina Public Transportation Market Segmentation, by Mode Type
13.6.10.3 Argentina Public Transportation Market Segmentation, by End Use
13.6.10.4 Argentina Public Transportation Market Segmentation, by Application
13.6.10.5 Argentina Public Transportation Market Segmentation, by Mobility
13.6.10.6 Argentina Public Transportation Market Segmentation, by Propulsion
13.6.11 Colombia
13.6.11.1 Colombia Public Transportation Market Segmentation, by Distribution Channel
13.6.11.2 Colombia Public Transportation Market Segmentation, by Mode Type
13.6.11.3 Colombia Public Transportation Market Segmentation, by End Use
13.6.11.4 Colombia Public Transportation Market Segmentation, by Application
13.6.11.5 Colombia Public Transportation Market Segmentation, by Mobility
13.6.11.6 Colombia Public Transportation Market Segmentation, by Propulsion
13.6.12 Rest of Latin America
13.6.12.1 Rest of Latin America Public Transportation Market Segmentation, by Distribution Channel
13.6.12.2 Rest of Latin America Public Transportation Market Segmentation, by Mode Type
13.6.12.3 Rest of Latin America Public Transportation Market Segmentation, by End Use
13.6.12.4 Rest of Latin America Public Transportation Market Segmentation, by Application
13.6.12.5 Rest of Latin America Public Transportation Market Segmentation, by Mobility
13.6.12.6 Rest of Latin America Public Transportation Market Segmentation, by Propulsion

14 Company Profiles
14.1 Seoul Metro (South Korea)
14.1.1 Company Overview
14.1.2 Financial
14.1.3 Products/ Services Offered
14.1.4 The SNS View
14.2 Madrid Metro
14.2.1 Company Overview
14.2.2 Financial
14.2.3 Products/ Services Offered
14.2.4 The SNS View
14.3 Transport For London (UK)
14.3.1 Company Overview
14.3.2 Financial
14.3.3 Products/ Services Offered
14.3.4 The SNS View
14.4 The San Diego Metropolitan Transit System (US)
14.4.1 Company Overview
14.4.2 Financial
14.4.3 Products/ Services Offered
14.4.4 The SNS View
14.5 TEMSA Global
14.5.1 Company Overview
14.5.2 Financial
14.5.3 Products/ Services Offered
14.5.4 The SNS View
14.6 MTR Corporation (Hong Kong)
14.6.1 Company Overview
14.6.2 Financial
14.6.3 Products/ Services Offered
14.6.4 The SNS View
14.7 Metropolitan Transportation Authority (US)
14.7.1 Company Overview
14.7.2 Financial
14.7.3 Products/ Services Offered
14.7.4 The SNS View
14.8 Gillig Corporation
14.8.1 Company Overview
14.8.2 Financial
14.8.3 Products/ Services Offered
14.8.4 The SNS View
14.9 Chicago Transit Authority (US)
14.9.1 Company Overview
14.9.2 Financial
14.9.3 Products/ Services Offered
14.9.4 The SNS View
14.10 Bay Area Rapid Transit (BART) (US)
14.10.1 Company Overview
14.10.2 Financial
14.10.3 Products/ Services Offered
14.10.4 The SNS View

15. Competitive Landscape
15.1 Competitive Benchmarking
15.2 Market Share Analysis
15.3 Recent Developments
15.3.1 Industry News
15.3.2 Company News
15.3.3 Mergers & Acquisitions

16. Use Case and Best Practices

17. Conclusion

An accurate research report requires proper strategizing as well as implementation. There are multiple factors involved in the completion of good and accurate research report and selecting the best methodology to compete the research is the toughest part. Since the research reports we provide play a crucial role in any company’s decision-making process, therefore we at SNS Insider always believe that we should choose the best method which gives us results closer to reality. This allows us to reach at a stage wherein we can provide our clients best and accurate investment to output ratio.

Each report that we prepare takes a timeframe of 350-400 business hours for production. Starting from the selection of titles through a couple of in-depth brain storming session to the final QC process before uploading our titles on our website we dedicate around 350 working hours. The titles are selected based on their current market cap and the foreseen CAGR and growth.


The 5 steps process:

Step 1: Secondary Research:

Secondary Research or Desk Research is as the name suggests is a research process wherein, we collect data through the readily available information. In this process we use various paid and unpaid databases which our team has access to and gather data through the same. This includes examining of listed companies’ annual reports, Journals, SEC filling etc. Apart from this our team has access to various associations across the globe across different industries. Lastly, we have exchange relationships with various university as well as individual libraries.

Secondary Research

Step 2: Primary Research

When we talk about primary research, it is a type of study in which the researchers collect relevant data samples directly, rather than relying on previously collected data.  This type of research is focused on gaining content specific facts that can be sued to solve specific problems. Since the collected data is fresh and first hand therefore it makes the study more accurate and genuine.

We at SNS Insider have divided Primary Research into 2 parts.

Part 1 wherein we interview the KOLs of major players as well as the upcoming ones across various geographic regions. This allows us to have their view over the market scenario and acts as an important tool to come closer to the accurate market numbers. As many as 45 paid and unpaid primary interviews are taken from both the demand and supply side of the industry to make sure we land at an accurate judgement and analysis of the market.

This step involves the triangulation of data wherein our team analyses the interview transcripts, online survey responses and observation of on filed participants. The below mentioned chart should give a better understanding of the part 1 of the primary interview.

Primary Research

Part 2: In this part of primary research the data collected via secondary research and the part 1 of the primary research is validated with the interviews from individual consultants and subject matter experts.

Consultants are those set of people who have at least 12 years of experience and expertise within the industry whereas Subject Matter Experts are those with at least 15 years of experience behind their back within the same space. The data with the help of two main processes i.e., FGDs (Focused Group Discussions) and IDs (Individual Discussions). This gives us a 3rd party nonbiased primary view of the market scenario making it a more dependable one while collation of the data pointers.

Step 3: Data Bank Validation

Once all the information is collected via primary and secondary sources, we run that information for data validation. At our intelligence centre our research heads track a lot of information related to the market which includes the quarterly reports, the daily stock prices, and other relevant information. Our data bank server gets updated every fortnight and that is how the information which we collected using our primary and secondary information is revalidated in real time.

Data Bank Validation

Step 4: QA/QC Process

After all the data collection and validation our team does a final level of quality check and quality assurance to get rid of any unwanted or undesired mistakes. This might include but not limited to getting rid of the any typos, duplication of numbers or missing of any important information. The people involved in this process include technical content writers, research heads and graphics people. Once this process is completed the title gets uploader on our platform for our clients to read it.

Step 5: Final QC/QA Process:

This is the last process and comes when the client has ordered the study. In this process a final QA/QC is done before the study is emailed to the client. Since we believe in giving our clients a good experience of our research studies, therefore, to make sure that we do not lack at our end in any way humanly possible we do a final round of quality check and then dispatch the study to the client.


  •            5000 (33% Discount)


  •            8950 (40% Discount)


  •            3050 (23% Discount)

Start a Conversation

Hi! Click one of our member below to chat on Phone