Radar & LiDAR Technology for Railways Application Market Report Scope & Overview:
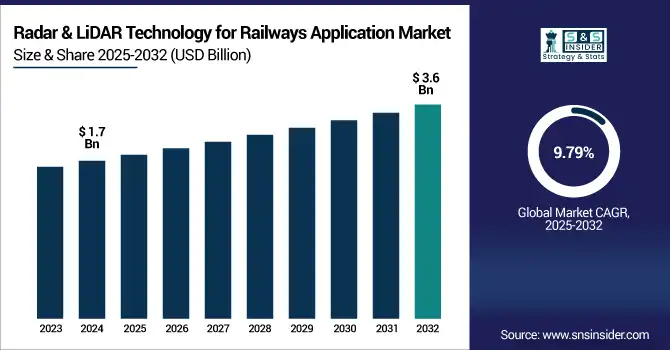
The Radar & LiDAR Technology for Railways Application Market size was valued at USD 1.7 billion in 2024 and is expected to reach USD 3.6 billion by 2032, growing at a CAGR of 9.79% during 2025-2032.
To Get more information on Radar-LiDAR-Technology-for-Railways-Application-Market - Request Free Sample Report
Radar & LiDAR Technology for Railways Application Market growth is being driven by the increased demand for advanced safety systems, enhanced autonomous and semi-autonomous rail operations, and a growing initiative towards smart transportation infrastructure. Radar and LiDAR play a vital role in performing real-time obstacle detection, predictive maintenance, and effective control and monitoring of the train system. The increasing investment of governments and railway operators toward digital transformation also aids in the proliferation of these technologies in high-speed and metro rail networks. In addition to this, abundance in urbanisation along with the quest to reduce fatalities promotes extensive deployment. AI supercharged LiDAR is on the rise, while radar, an established winner in tough weather, provides enhanced operational resilience. Double-digit CAGR throughout 2032. The market is set to see strong double-digit CAGR through 2032, with Asia-Pacific and North America leading the adoption of such solutions, FuSion said, supported by the modernization of aged infrastructure and an increasing number of smart city development and planning projects.
The demand for U.S. Radar & LiDAR Technology for Railways Application Market is driven by growing investments in rail automation, improving safety compliance, and modernization of aging Railway infrastructure. In 2024, the market is valued at USD 312 million and is projected to reach USD 755 million by 2032, growing at a CAGR of 11.9%. Radar & LiDAR Technology for Railways Application Market trend in the U.S. highlights growing adoption of AI-integrated sensors for predictive rail management.
Market Dynamics:
Drivers:
-
Rising Safety Concerns and Automation Needs Are Driving the Adoption of Radar and LiDAR Systems in Modern Rail Infrastructure
Thus, growing demand for decreasing rail accidents and increasing passenger and freight safety is again leading to the growth of radar and LiDAR technologies in the forecast period. Features such as real-time detection of obstacles, monitoring of track conditions, and support for automated braking and control systems are provided by these systems. Due to the rising focus of governments and railway operators towards upgrading rail tracks and implementing safety mandates, especially in high-speed and urban transit systems, radar and LiDAR-based solutions are being widely deployed. They are way better than the traditional systems in terms of their accuracy in bad weather and low-light conditions. It is in line with the wider shift toward driverless and semi-driverless rail systems.
For instance, AI-enabled safety systems, leveraging radar and LiDAR, have reduced railway accidents caused by human error by 25% and near-miss incidents by 15% in recent deployments
Restraints:
-
High Implementation Costs and System Integration Complexities Are Limiting Widespread Deployment Across Older Rail Networks
High up-front costs associated with upgrading legacy infrastructure make the implementation of radar and LiDAR systems in railways less attractive. Installing new sensors along miles of rail networks and then integrating those systems with current signaling and control technologies represents financial and technical challenges. In particular, the budget of the railway authorities in many regions, especially developing regions, makes the technology take a long time for the technology to adapt to the railway systems. Moreover, fusing radar and lidar with legacy software involves extensive engineering and retraining. In addition, there are still no standard protocols between different systems, making large-scale deployment a challenge. Even though they offer operational and safety advantages in the long haul, these barriers hamper mass adoption.
For instance, during a Normandy pilot, SNCF found that integrating AI-driven collision systems into existing infrastructure raised implementation costs by 27%, due to added sensor installation and data integration.
Opportunities:
-
Advancements in AI and Predictive Analytics Are Enabling Radar and LiDAR To Support Smart and Autonomous Railway Operations
AI is a game changer when it comes to fusion with radar and LiDAR technology for rail applications. AI-driven platforms can ingest real-time sensor data and help move railway operators towards predictive maintenance, lowering downtime and the overall lifespan of existing assets. These technologies can detect micro-defects on tracks, overhead lines, and structural components ahead of any failure. AI-augmented data analytics, in turn, enable efficient route planning and automated decision-making. As intelligent transport continues to make strides globally, the potential lies in creating smart rail networks that combine the use of radar and LiDAR sensors with a cloud platform. Such evolution opens up lucrative opportunities for technology providers and software developers, especially in the field of railway automation.
AI-driven predictive maintenance systems have reduced train derailments tied to equipment failure by 60%, improving system reliability
Challenges:
-
Massive Data Output and Processing Limits Are Hindering Radar and LiDAR Scalability in High-Speed Rail Environments
In high-speed rail, for example,1000s of radar and LiDAR data are generated per second. Real-time handling, storage, and analysis of this data, however, continues to be a challenge for technology. To enable quicker decision-making, rail operators should build high-performance computing infrastructure and deploy edge computing solutions. Even data accuracy, cleanup of noise, and low latency are also mandatory for operational safety. For some railway environments, limited bandwidth limits communication of critical alerts in real-time. If left unaddressed, these will make the benefits of radar and LiDAR deployments, especially in large-scale or transnational rail, far less effective.
Segmentation Analysis:
By Radar Technology:
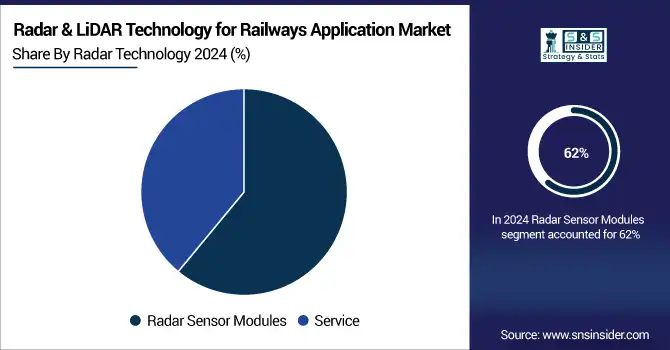
The Radar Sensor Modules segment dominated the market in 2024 and accounted for 62% of the radar and lidar technology for railways application market share, owing to a rise in demand for real-time obstacle detection, speed monitoring, and automation of the system in modern rail operations. Rail operators like these modules because they are stable in less-than-optimal conditions and can add safety features. The continuous advancements in sensor technology, including the integration of AI and leveraging multi-band data, will support the preference of sensors in the industry in light of the modernization of infrastructure over the timeframe covered by this market
The Services segment is expected to register the fastest CAGR as railway operators seek support services such as integration, maintenance, and predictive analytics for integrated radar and LiDAR systems. With the industry trend of increasing system complexity and flourishing digital transformation efforts, enterprises are driven to have expert consulting and lifecycle services. AI-based diagnostic services and real-time cloud help are further adding to the demand for the services that become critical to offer seamless operation and improvement in ROI.
By LiDAR Technology:
The LiDAR Devices segment dominated the radar and lidar technology for railways application market in 2024 and accounted for 48% of revenue share, owing to deployment in track inspection, obstacle detection, and structural monitoring. LiDAR hardware features high-resolution, 3D scanning capabilities that rail operators use to ensure safety and accuracy in freight and high-speed rail. Rising protection capabilities needed for LiDAR devices, owing to the improvement of infrastructure, are anticipated to continue demand for climatic conditions tested, durable LiDAR instruments through 2032.
The LiDAR Processing & Mapping Software segment is expected to register the fastest CAGR, driven by the growing requirements for real-time data analysis, digital twins, and automated route planning. With more LiDAR deployments in action, rail operators needed better software to transform point-cloud data into insights. With platforms becoming AI-driven, along with the cloud integration, the pace of software adoption and scale will only increase further.
By Application:
The Railway Track Faults Detection segment dominated the radar and lidar technology for railways application market in 2024 and accounted for a significant revenue share, as track defect detection is key in avoiding derailments and also in conserving maintenance costs and continuity of operations. These Radar and LiDAR systems allow for early detection of cracks, misalignments. This segment will continue acquiring traction across freight and passenger rail networks until 2032, driven by increasing infrastructure safety investments and predictive maintenance.
The Train Tracking & Control segment is expected to register the fastest CAGR Due to increased automation, real-time operations, and AI-enabled decision-making, the Train Tracking & Control segment is anticipated to achieve the fastest CAGR. The deployment of smart rail systems worldwide utilizes critical radar and LiDAR technologies to facilitate dynamic positioning, movement, and speed systems, so the network can be synchronized and requires minimal human monitoring of trains. An increase in high-speed rail deployments will continue to drive growth in this segment
Regional Analysis:
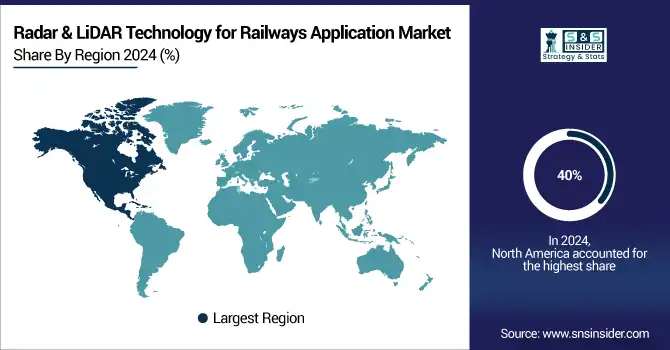
The North America region dominated the market in 2024 and accounted for 40% of revenue share, early adoption of advanced technologies for railway safety, high investments in smart transportation, and strong rail freight infrastructure. Demand is fueled by demand-driven modernization programs and government-backed programs or funding for autonomous systems. The top U.S. and Canadian operators are using more radar and LiDAR for predictive maintenance and are not giving up on leading through 2032.
The U.S. Federal Railroad Administration’s pilot programs implementing radar-based obstacle detection have resulted in a 30% decrease in collision incidents on equipped tracks
The Asia-Pacific region is expected to register the fastest CAGR, owing to rapid rail infrastructure development in China, India, and Southeast Asia. Urbanization, high-speed rail investment, and smart cities are the key vehicle growth drivers. This is set to position the region at the forefront of next-generation railway innovations, with governments embracing AI-powered radar and LiDAR technologies to improve both safety and efficiency.
Europe’s growth is driven by Strong rail safety and high investment in automation and sustainable transport initiatives are underlying Europe’s growth. Radar and LiDAR deployment backed by EU funding, smart mobility policies. Nationwide, widespread deployment of advanced systems on metro, freight, and high-speed rail networks by 2032
Germany dominates the European market. Due to the in-depth development of rail infrastructure, Germany holds a significant share in the European rail market. The majority of the market with a solid emphasis on predictive maintenance and investment allocation for autonomous train projects. Deployments accelerate via government initiatives and collaborations with tech firms. Smart rail transformation in Germany.
Get Customized Report as per Your Business Requirement - Enquiry Now
Key Players:
The major radar & lidar technology for railways application market companies are Radarxense BV, Bosch Mobility Solutions, Navtech Radar, Leica Geosystems AG, BlackBerry Limited, DEUTA-WERKE GmbH, Radar Vision, Trimble Inc., Siemens Mobility, Thales Group and others
Recent Developments:
In May 2025, Bosch Mobility Solutions announced mid‑2025 serial production of its next‑gen ADAS radar sensors, with applications in rail environments for real‑time localization and environmental sensing via the “Sensors4Rail” initiative with Deutsche Bahn.
In June 2025, Leica Geosystems AG launched its AI-powered Cyclone 3DR software, enhancing LiDAR processing workflows for high-precision railway and infrastructure mapping.
| Report Attributes | Details |
| Market Size in 2024 | US$ 1.7 Billion |
| Market Size by 2032 | US$ 3.6 Billion |
| CAGR | CAGR of 9.79% From 2025 to 2032 |
| Base Year | 2024 |
| Forecast Period | 2025-2032 |
| Historical Data | 2021-2023 |
| Report Scope & Coverage | Market Size, Segments Analysis, Competitive Landscape, Regional Analysis, DROC & SWOT Analysis, Forecast Outlook |
| Key Segments | • By Radar Technology (Radar Sensor Modules, Service) • By LiDAR Technology (Devices, LiDAR Processing & Mapping Software, Services) • By Application (Railway Track Faults Detection, Rail Collision, Pedestrian Detection, Train Tracking & Control, Others) |
| Regional Analysis/Coverage | North America (US, Canada, Mexico), Europe (Germany, France, UK, Italy, Spain, Poland, Turkey, Rest of Europe), Asia Pacific (China, India, Japan, South Korea, Singapore, Australia, Rest of Asia Pacific), Middle East & Africa (UAE, Saudi Arabia, Qatar, South Africa, Rest of Middle East & Africa), Latin America (Brazil, Argentina, Rest of Latin America) |
| Company Profiles | Radarxense BV, Bosch Mobility Solutions, Navtech Radar, Leica Geosystems AG, BlackBerry Limited, DEUTA-WERKE GmbH, Radar Vision, Trimble Inc., Siemens Mobility, Thales Group and others in the report |
Frequently Asked Questions
North America region dominated the Radar & LiDAR Technology for Railways Application Market with 40% of revenue share in 2024.
The Railway Track Faults Detection segment dominated the radar and lidar technology for railways application market in 2024 and accounted for a significant revenue share
Rising Safety Concerns and Automation Needs Are Driving the Adoption of Radar and LiDAR Systems in Modern Rail Infrastructure
The Radar & LiDAR Technology for Railways Application Market size was valued at USD 1.7 billion in 2024 and is expected to reach USD 3.6 billion by 2032
The expected CAGR of the Radar & LiDAR Technology for Railways Application Market over 2025-2032 is 9.79%.
Get in Touch
