Retail Analytics Market Report Scope & Overview:
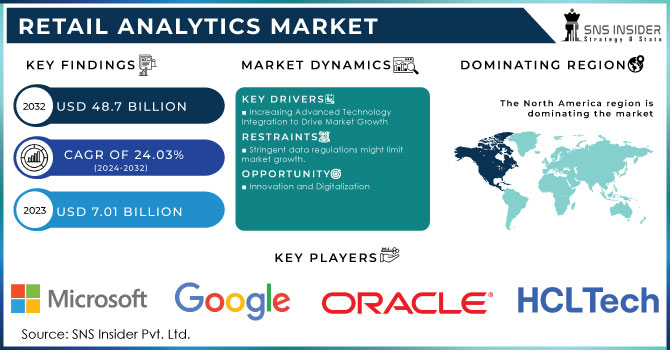
The Retail Analytics Market was valued at USD 8.0 Billion in 2023 and is expected to reach USD 45.4 Billion by 2032, growing at a CAGR of 21.31% from 2024-2032.
Get more information on Retail Analytics Market - Request Sample Report
The retail analytics market has experienced remarkable growth in recent years as the need for data-driven insights to optimize operations and improve customer experiences continues to provide the impetus for rapid growth. With data from multiple retail channels such as online transactions, store activity, and social media interaction increasing rapidly, retailers are investing in new analytics solutions to process and make sense of all this big information. The data provides retailers with deeper insight into consumer behavior, purchasing patterns, and emerging trends, allowing them to create targeted marketing campaigns, strategically design product assortments, and drive customer loyalty. Knowing what consumers want is increasingly becoming a decisive force in not only sales but also building customer loyalty.
Retail analytics is also an essential part of retail inventory management as retailers are using more and more analytics tools and solutions to track their inventory levels, and sales velocity in real-time, as well as forecast demand. Such features help maintain sufficient stock, eliminating the possibility of over/ under stock, thereby minimizing operational expenditure and enhancing efficacy. With the increasing competition in the retail industry, brands are using analytics to better understand market trends, competitor performance, and consumer sentiment, thereby gaining their competitive edge. With these insights, retailers can make better decisions, discover new opportunities, and proactively adjust to changes in consumer demand.
Several trends have facilitated market adoption over the years, with the rocket of advanced techniques such as artificial intelligence, machine learning, and the Internet of Things being some of them to drive the retail analytics market even higher. Such technologies facilitate predictive analytics, real-time data processing, and automation, which considerably improves the functionalities of retail analytical platforms. The boom of e-commerce has been another key driver of market growth, especially within online retail, which generates massive quantities of data, all of which necessitate sophisticated analytics to track sales performance, customer behavior, and the online shopper journey.
Together with this, retail analytics enables the optimization of the supply chain through insights into supplier performance, logistics efficiency, and demand forecasting. Such enables retailers to optimize operations, reduce expenditure, and improve delivery time with the end goal of getting better customer satisfaction. Given the increasing significance of data privacy and security concerns, retailers are adopting analytics to help them meet regulatory requirements. They are useful in tracking data consumption, applying security processes, creating compliance reports, minimizing legal risks, and ensuring compliance with industry standards.
Market Dynamics
Drivers
-
Advanced technologies like AI and ML enable predictive analytics, enhancing the capabilities of retail analytics platforms.
AI and ML are revolutionizing the Retail Analytics Market through better predictions with analytics platforms. This goes beyond traditional methods of data analysis, but with the help of these kinds of technologies, retailers are equipped with tools that can detect patterns, trends, and insights that were once challenging to discover. Retailers can analyze vast amounts of data in real-time, allowing them to anticipate customer behavior, analyze demand, and effectively manage inventory with the help of AI and ML. Through AI-powered predictive analytics, previous sales information, seasonal trends, and customer preferences can all be analyzed to obtain accurate demand predictions. This enables retailers to make better, informed planning decisions, stocking the right products in the right quantities at the right time to minimize over-stocking and stockout risks. Machine learning algorithms learn from new data, improving the predictions rapidly over time, which empowers retailers to quickly adapt to changes in consumer habits and market trends.
Furthermore, AI and ML enable personalization recommendations and targeted marketing campaigns, improving customer experience and increasing sales. These technologies can provide better shopping experiences to customers and create loyalty by understanding individual customer behaviors and then recommending products that best suit individual shoppers. The adoption of AI and ML capabilities within retail analytics platforms empowers retailers with actionable insights, enabling data-driven decisions, operational optimization, and personalized experiences. And these technologies are bound to grow in importance in the future of the market of retail analytics.
-
The growing amount of data from online transactions, in-store activities, and social media interactions drives the demand for analytics solutions.
-
Retailers are leveraging analytics to create targeted marketing campaigns based on consumer behavior and preferences.
Restraints
-
There is a shortage of skilled professionals who can effectively interpret and utilize retail analytics data.
One of the key challenges that retailers face while adopting the advanced analytics solution is the limited skilled professionals in the retail analytics market. Retail analytics platforms produce more data than retailers can fathom; but without the talent who know how to read and convert that data into actionable insights, it becomes completely useless. However, there is a gap between the demand for data scientists and analysts and AI, ML, and data management professionals and the talent supply. This was further driven by the fact that the analytics talent was hard to find, especially among small and medium enterprises retailers, which in turn prevented them from optimizing their analytics platforms.
With improper knowledge and the lack of specialists, retailers will find it difficult to get meaningful insights out of the data, thus losing out on making improvements to operations, experience, and profitability. Professionals who are well-versed in data quality management, predictive modeling, and optimization ensure the analytics platforms deliver exactly what the retailer requires. They also serve as mentors who interpret complex data and make strategic recommendations based on trends and patterns. This also adds to the cost of recruitment of these analytics professionals and also takes time before these analytics solutions are implemented. Retailers either need to train employees with no experience or fight the job market where it can be hard to find professionals with experience. As the retail analytics demand rises, bridging this talent gap is vital for enterprises to stay ahead of the competition with data-enabled decisions. Therefore, along with the increase of the retail analytics market, it becomes a dire need of the hour to build up focused training programs and collaborations with institutes.
-
The initial investment in retail analytics tools and technologies can be expensive for small and medium-sized retailers.
-
Increasing concerns over data security and privacy regulations may limit the adoption of retail analytics solutions.
Segment Analysis
By Deployment
The cloud segment dominated the market and represented a significant revenue share of 59% in 2023, Growing preference for cloud-based solutions, providing scalability and cost-efficiency for faster deployment, has led to a sudden increase in the cloud-based deployment segment in the retail analytics market. Cloud enables retailers to store and analyze vast amounts of data with less capital depreciation in hardware. Digital transformation and increasing e-commerce demand have led to a proliferation of cloud-based retail analytics solutions. Also, cloud platforms allow for easier integration of other digital tools, including CRM and ERP systems, increasing overall operational efficiency. Deployment of the cloud is expected to continue thriving in the future growing number of retailers are opting for cloud-based solutions to improve data-driven decision-making as well as innovation.
The on-premise deployment segment is expected to grow at the fastest CAGR. On-premise solutions are also preferred by large enterprises as they provide greater control over data security, compliance, and customization. On-premise segment is driven by the capability to store sensitive customer and transactional data, which comes in handy, particularly in the industries that are governed by temperature-sensitive data privacy, security, and cyber regulations. Pre-existing solutions can also help speed up data processing and local infrastructure integration. With a growing emphasis on data privacy and the emergence of stricter regulatory requirements, the need for on-premise solutions is likely to increase especially for industries such as healthcare, finance, and governmental entities that need to keep their data secure.
By Retail Store Type
The retail chains dominated the market and accounted for a revenue share of more than 59% in 2023, which needs to optimize inventory management, increase operational efficiency, and enhance consumer engagement through advanced data analytics across their extensive operations. These chains are adapting to use analytics to gain more depth around consumer habits, hyper-personalize marketing and optimize their operations. Furthermore, the rising e-commerce space along with the increasing requirement for omnichannel strategy have notably driven the retail analytics demand in this segment. Battling against rising competition and changing customer expectations, retail chains are leveraging data-driven insights to stay ahead in this race. Retail chains can expect to witness a great future ahead in terms of the decision-making process, and they continue to invest the analytics solutions to enable informed decision-making, build an optimized supply chain, and offer a more personalized customer experience.
The Hypermarkets and Supermarkets are expected to register the fastest CAGR during the forecast period. As these retail types handle a huge number of transactions and an even larger number of inventories, analytics is crucial to helping optimize aspects such as inventory management, demand forecasting, and providing the customer with tailored promotions and recommendations. The growth of e-grocery and demand for interlinking physical stores with digital stores is also one of the key factors expected to drive the adoption of retail analytics for grocery in this segment. With changing customer preferences and increasing demand for convenience, hypermarkets and supermarkets are likely to further invest in analytics solutions to streamline operations and enhance overall customer experience.
Regional Analysis
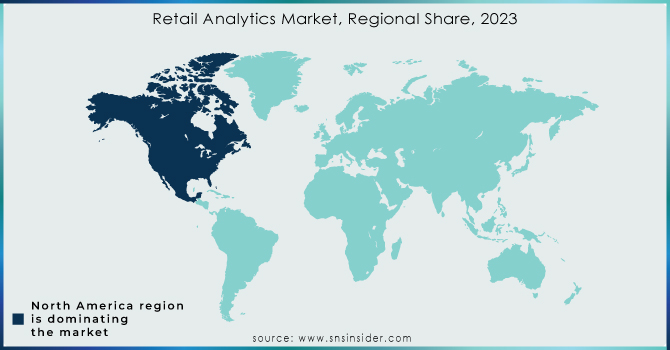
North America dominated the market and accounted for a revenue share of more than 39% due to its high infrastructure and plant capacity in terms of technology and equipment, and rapid adoption of a wide range of digital solutions by the leading players in the Retail market. With the increasing focus on data-based decision-making, customer-specific experiences, and operational effectiveness, retail analytics solutions are increasingly being embraced by the region. Moreover, the growth of e-commerce, omnichannel retailing, and the need for inventory optimization have increased the demand for analytics tools. The roadmap for North America still looks bright as the region is continuously investing in advanced analytics AI and machine learning-based technologies to strengthen operational strategy, enhance customer insights, and retain a competitive advantage in retail.
Asia Pacific is likely to be the fastest-growing region in the retail analytics market during the forecast period due to faster digitization, higher internet penetration, and a larger pool of consumer spending. Demand for data-driven solutions to improve inventory management, personalized marketing, and customer experiences is propelled by the growing retail sector in the region, especially in emerging markets such as China and India. This, coupled with the increasing shift towards e-commerce and mobile shopping, is also further driving the adoption of retail analytics in the region. With the evolution of retail and the predictive and analytical capabilities of technologies like AI, machine learning, and IoT, the adoption curve will further the size of the market. Asia Pacific continues to be an extremely positive, high-growth region from both traditional as well as online retail strategies.
Need any customization research on Retail Analytics Market - Enquiry Now
Key Players
The major key players along with their products are
-
SAP SE - SAP Customer Activity Repository
-
Oracle Corporation - Oracle Retail Analytics
-
IBM Corporation - IBM Watson Retail Analytics
-
SAS Institute Inc. - SAS Retail Analytics
-
Microsoft Corporation - Microsoft Power BI
-
Qlik Technologies Inc. - Qlik Sense
-
Teradata Corporation - Teradata Vantage
-
Nielsen Holdings PLC - NielsenIQ
-
Tableau Software - Tableau Analytics Platform
-
Google LLC - Google Cloud Retail Analytics
-
Infor - Infor CloudSuite Retail
-
Manthan Systems - Manthan Retail Analytics Suite
-
TIBCO Software Inc. - TIBCO Spotfire for Retail Analytics
Recent Developments
In January 2024, Walmart's CEO, John Furner, announced the use of 'digital twin' technology to optimize store layouts across over 1,700 locations, enhancing customer shopping experiences and store efficiency.
In November 2024, Walmart incorporated weather analysis into its AI software for inventory planning, adjusting product pricing strategies based on regional weather forecasts to enhance operational efficiency.
| Report Attributes | Details |
|---|---|
| Market Size in 2023 | USD 8.0 Billion |
| Market Size by 2032 | USD 45.4 Billion |
| CAGR | CAGR of 21.31% From 2024 to 2032 |
| Base Year | 2023 |
| Forecast Period | 2024-2032 |
| Historical Data | 2020-2022 |
| Report Scope & Coverage | Market Size, Segments Analysis, Competitive Landscape, Regional Analysis, DROC & SWOT Analysis, Forecast Outlook |
| Key Segments | • By Deployment (On-Premise, Cloud) • By Retail Store Type (Hypermarkets and Supermarkets, Retail Chains) • By Function (Customer Management, Supply Chain, Merchandising, Strategy and Planning, In-Store Operations) |
| Regional Analysis/Coverage | North America (US, Canada, Mexico), Europe (Eastern Europe [Poland, Romania, Hungary, Turkey, Rest of Eastern Europe] Western Europe] Germany, France, UK, Italy, Spain, Netherlands, Switzerland, Austria, Rest of Western Europe]), Asia Pacific (China, India, Japan, South Korea, Vietnam, Singapore, Australia, Rest of Asia Pacific), Middle East & Africa (Middle East [UAE, Egypt, Saudi Arabia, Qatar, Rest of Middle East], Africa [Nigeria, South Africa, Rest of Africa], Latin America (Brazil, Argentina, Colombia, Rest of Latin America) |
| Company Profiles | SAP SE, Oracle Corporation, IBM Corporation, SAS Institute Inc., Microsoft Corporation, Qlik Technologies Inc., Teradata Corporation, Nielsen Holdings PLC, Tableau Software, Google LLC, Infor, Manthan Systems, TIBCO Software Inc. |
| Key Drivers | • The growing amount of data from online transactions, in-store activities, and social media interactions drives the demand for analytics solutions. • Retailers are leveraging analytics to create targeted marketing campaigns based on consumer behavior and preferences. |
| RESTRAINTS | • The initial investment in retail analytics tools and technologies can be expensive for small and medium-sized retailers. • Increasing concerns over data security and privacy regulations may limit the adoption of retail analytics solutions. |
Get in Touch
