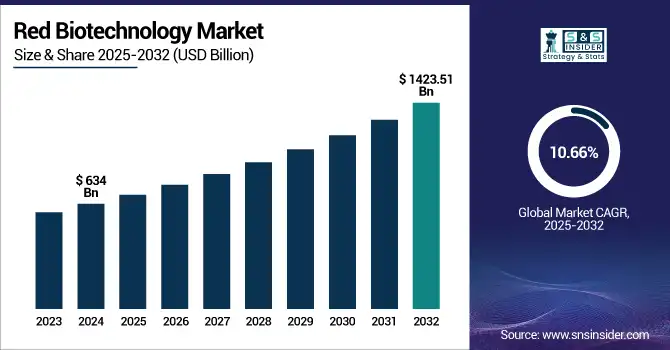
The red biotechnology market size was valued at USD 634 billion in 2024 and is expected to reach USD 1423.51 billion by 2032, growing at a CAGR of 10.66% over the forecast period of 2025-2032.
Increased demand for personalized medicine, biologics, and new drugs propels the red biotechnology sector. Fast-moving technologies to be applied in healthcare consist of quick advancements in recombinant DNA technology, along with fresh advancements in cell and gene therapy, and expansion in the monoclonal antibody. With approximately 60% of clinical trials targeting biologics and gene therapies (ASCO, 2024), government-funded projects and R&D investments are booming.
The U.S. red biotechnology market stood at USD 215.08 billion in 2024 and is anticipated to reach USD 443.51 billion by 2032, with a CAGR of 9.49% during the forecast period of 2025–2032. With ease in FDA policies and increasing funding levels, such as the USD 5 billion given by NIH in 2023 for biomedical discovery, the U.S. market particularly gets a boost.
In addition, strengthening the growth of red biotechnology market share in the field of medical biotechnology and the development of biotech vaccines demands greater regulatory support and public-private collaboration in such areas. For instance, over 60 biotechnology medicines were approved by the EMA in 2023, indicating an increased demand for global red biotechnology market products. In addition, even as overall biopharma venture capital decreased, more than 300 biotech start-ups were financed at an early stage during 2023, showing persistent investor confidence.
For instance, ASCO's 2024 report indicates that 75% of ongoing cancer research studies are employing immunotherapies and gene-editing technologies, reflecting the expansion of personalized medicine via biotechnology and targeted therapies in cancer treatment.
France's recent effort to suspend some EU regulatory red tape reflects a positive red-biotechnology market trend, seeking to spur biopharmaceutical market activity and lower barriers for red-biotechnology firms innovating in the EU.
Market Dynamics:
Drivers:
Rising Demand for Targeted Therapies and Growing Investment in Biotech R&D Drives Market Expansion
Biotechnology drug innovations, targeted therapies, and long-term R&D investments propel the biotechnology industry. Global R&D expenditure on biotechnology was more than USD 240 billion in 2023, with over 45% spent on medical biotechnology market innovations, such as gene editing, mRNA platforms, and monoclonal antibodies. Importantly, Gilead Sciences broadened its R&D pipeline in 2024 to include CRISPR-based HIV therapies, reflecting the depth of cell and gene therapy innovations.
In addition, more than 90 new biologics and biosimilars have been approved by the European Medicines Agency in 2023 alone, showing positive regulatory momentum. Personalized therapy through biotech is also being facilitated by improved public-private collaborations, including NIH's USD 2.5 billion precision medicine initiative.
With more than 120 potential vaccines for uncommon and infectious diseases in clinical testing, governments are also accelerating biotech vaccine development in expectation of post-continuation biothreats. Moreover, increased demand for successful cancer therapies has boosted the recombinant DNA technology innovation, providing scalable production platforms that enhance drug availability and shorten lead time. The intersection of innovation, demand, and regulation is hence powerfully driving the red biotechnology market trends expansion.
Restraints:
High Development Costs, IP Complexities, and Supply Chain Limitations Impede Red Biotechnology Market Growth
The cost of developing a biotech medicine currently averages more than USD 2.6 billion, with over 30% going to the clinical trial phases. Such costs, with lengthy approval processes, create entry barriers for smaller red biotech firms. Additionally, complicated IP regulations and patent cliffs discourage innovation, particularly in the case of biosimilars, thus restricting competition and affordability. Latest statistics from the U.S. GAO demonstrate that more than 50% of biotech companies slowed the advancement of clinical trials due to insufficient funding and extended regulatory approval.
On the demand side, global shortages of essential raw materials, such as enzymes and cell lines, in 2024 resulted in longer production cycles, especially in highly demanded biopharmaceutical market segments. Moreover, variations in regulations globally pose problems, whereas the U.S. has FDA fast-track procedures for gene therapies. However, most development regions lack analogous processes, an issue that compromises the red biotechnology market analysis and timing of goods in the market of red biotechnology. Limited biomanufacturing facilities and inconsistencies in the quality control environment are quelling the scale-up of advanced technologies in the biotechnology health market.
By Product
With a market share of 48.3%, monoclonal antibodies ranked as the top product segment in the red biotechnology market in 2024. The key factor behind market share arises from its extensive use in treating long-term disorders, including cancer, autoimmune diseases, and infectious diseases. Due to their high selectivity, minimal side effects, and increasing regulatory approval, monoclonal antibodies have garnered attention.
The fact that market giants, including Roche, Amgen, and AbbVie, continue to invest in next-generation antibody treatment attests to the market's predominance. Moreover, their commercialization and scaling capacity make them a pillar of industry for biopharmaceutical pipelines all around.
Gene therapy segment is the fastest-growing product class driven by developments in viral vector and CRISPR technology, along with authorized drugs including Zolgensma and Luxturna. Pharmaceutical companies and researchers are highly interested in such treatments since they show therapeutic possibilities for genetic diseases. With more than 2,000 gene therapy trials in progress globally, this market is expected to rise gradually due to its transforming medical importance.
By End-user
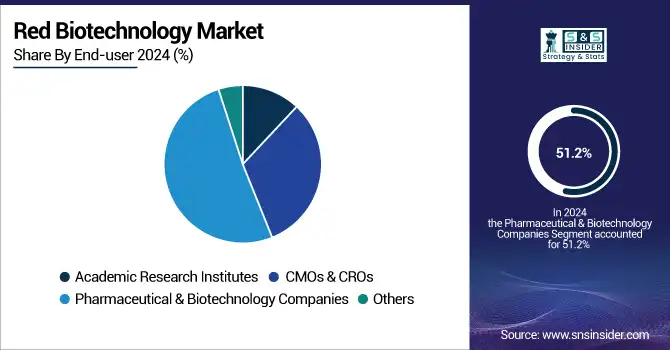
Pharma and biotech companies led with 51.2% market share in 2024, fueled by strong R&D pipelines, strategic partnerships, and increasing demand for biologics. Heavily investing in discovery and clinical-stage research, they are the leaders in cell and gene therapy innovation.
Contract Manufacturing Organizations (CMOs) and Contract Research Organizations (CROs) are the most rapidly expanding end-users that are leveraging increased pharma company outsourcing to cut costs and streamline development timelines. Increasing demand for compliant, scalable manufacturing solutions and growing volume of clinical trials are fueling the segment’s expansion in the market.
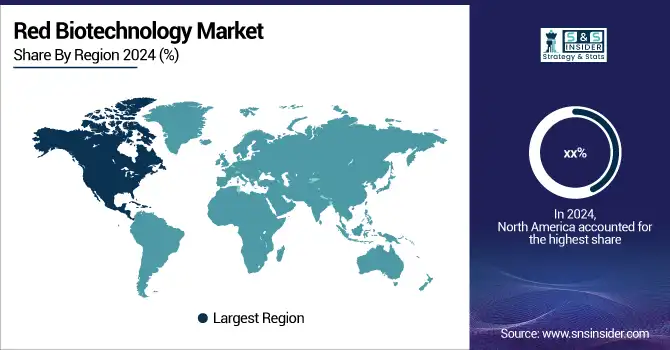
North America led the market in 2024, fueled by huge investment in R&D, strong biopharma infrastructure, and a supportive legal environment. With more than USD 3.5 billion in NIH funds for cell and gene therapy projects and the FDA's expedited approval programs for monoclonal antibodies and gene therapies, the U.S. held the largest share in the region. Large corporations, such as Amgen, Biogen, and Pfizer, reside in the country, and over 60% of the global gene therapy clinical trials are conducted here. With additional funds from its strategic innovation fund and increasing numbers of biotechnology clusters in Toronto and Vancouver, Canada is also quickly emerging. As a leader in contract manufacturing, Mexico is fueling regional red biotechnology market growth.
Europe holds the second-leading position in the red biotechnology market. Robust academic research, public-private collaborations, and well-established legal frameworks underpin the region. Germany dominates the region with its robust pharma industry, and companies such as Bayer and BioNTech dominate research in recombinant drugs and biotech vaccine production. France and the U.K. are other key contributors to the region’s growth. France has boosted funding for gene therapies, while the U.K.'s MHRA implemented quicker approval routes after Brexit. Growing investments in CMOs and CROs are assisting Eastern European nations, such as Poland and Turkey, to gain momentum. With advancing clinical trial activity and an accommodating environment for biotechnology-based personalized medicine, Europe is the second fastest-growing continent.
Asia Pacific is the fastest-growing region in the market throughout the forecast period, driven by government initiatives for innovative concepts, along with the growing need for novel treatments, and growing healthcare expenditure. China dominates the region under the "Made in China 2025" initiative with substantial government funding. It also comprises 1,000 biotech companies focused on gene therapy, biologics, and stem cell science. Nearing around 45 biotech drugs in 2023 alone, the country has enhanced its regulatory effectiveness. India is growing at a fast pace with its expanding biotechnology parks and increased government support under the Biotechnology Industry Research Assistance Council (BIRAC). Adding to the growth chances of the region are investments in cutting-edge regenerative medicine platforms and cell-based immunotherapies by Japan and South Korea.
The LAMEA market is increasingly gaining momentum in the red biotechnology industry, driven by increasing healthcare modernization and biotechnology infrastructure investment. Brazil is the leader in Latin America with government initiatives supporting biologic production and public-private partnerships for oncology and infectious disease. Specifically in stem cell and gene therapy, the visibility of clinical research for Argentina is growing. Saudi Arabia is investing proactively under its Vision 2030 plan to localize the production of biotech in the Middle East region. The UAE is becoming a regional center for medical research. With EU biotech companies in partnership, South Africa is advancing in molecular diagnostics and animal model studies.
Red biotechnology companies operating in the market comprise Merck KGaA, Roche, Pfizer, Regeneron, AstraZeneca, Takeda, Gilead Sciences, Biogen, Amgen, and Celgene.
In March 2025, Debut Biotechnology launched a platform using precision fermentation to produce animal-free collagen and hyaluronic acid for biotech and cosmetic applications.
In February 2025, Bambusa Biotech raised USD 90 million in funding to develop next-gen bispecific antibodies for cancer treatment.
In August 2024, Red Queen Therapeutics, a biotech startup launched with support from Apple Tree Partners, focuses on small-molecule drugs for infectious diseases.
Report Attributes | Details |
---|---|
Market Size in 2024 | USD 634 Billion |
Market Size by 2032 | USD 1423.51 Billion |
CAGR | CAGR of 10.66% From 2025 to 2032 |
Base Year | 2024 |
Forecast Period | 2025-2032 |
Historical Data | 2021-2023 |
Report Scope & Coverage | Market Size, Segments Analysis, Competitive Landscape, Regional Analysis, DROC & SWOT Analysis, Forecast Outlook |
Key Segments | • By Product (Monoclonal Antibodies, Polyclonal Antibodies, Recombinant Proteins, Vaccines, Cell-Based Immunotherapy Products, Gene Therapy Products, Cell Therapy Products, Tissue-Engineered Products, Stem Cells, Cell Culture, Viral Vector, Enzymes, Kits And Reagents, Animal Models, Molecular Diagnostics, and Others) • By End-user (Academic Research Institutes, CMOs & CROs, Pharmaceutical & Biotechnology Companies, and Others) |
Regional Analysis/Coverage | North America (US, Canada, Mexico), Europe (Germany, France, UK, Italy, Spain, Poland, Turkey, Rest of Europe), Asia Pacific (China, India, Japan, South Korea, Singapore, Australia, Rest of Asia Pacific), Middle East & Africa (UAE, Saudi Arabia, Qatar, South Africa, Rest of Middle East & Africa), Latin America (Brazil, Argentina, Rest of Latin America) |
Company Profiles | Merck KGaA, Roche, Pfizer, Regeneron, AstraZeneca, Takeda, Gilead Sciences, Biogen, Amgen, and Celgene. |
Ans: The Red Biotechnology market is anticipated to grow at a CAGR of 10.66% from 2025 to 2032.
Ans: The market is expected to reach USD 1423.51 billion by 2032, increasing from USD 634 billion in 2024.
Ans: Biotechnology drug innovations, targeted therapies, and long-term R&D investments propel the red biotechnology industry.
Ans: High development costs, IP complexities, and supply chain limitations impede the red biotechnology market.
Ans: North America dominated the red biotechnology market.
Table of Contents
1. Introduction
1.1 Market Definition
1.2 Scope (Inclusion and Exclusions)
1.3 Research Assumptions
2. Executive Summary
2.1 Market Overview
2.2 Regional Synopsis
2.3 Competitive Summary
3. Research Methodology
3.1 Top-Down Approach
3.2 Bottom-up Approach
3.3. Data Validation
3.4 Primary Interviews
4. Market Dynamics Impact Analysis
4.1 Market Driving Factors Analysis
4.1.2 Drivers
4.1.2 Restraints
4.1.3 Opportunities
4.1.4 Challenges
4.2 PESTLE Analysis
4.3 Porter’s Five Forces Model
5. Statistical Insights and Trends Reporting
5.1 R&D Investment Trends, by Region (2024)
5.2 Clinical Trials Activity, by Therapeutic Area and Region (2024)
5.3 Regulatory Approvals and Pipeline Snapshot (2024)
5.4 Healthcare Spending on Biologics, by Payer Type and Region (2024)
5.5 Manufacturing Capacity and Facility Expansion (2021–2032)
6. Competitive Landscape
6.1 List of Major Companies By Region
6.2 Market Share Analysis By Region
6.3 Product Benchmarking
6.3.1 Product specifications and features
6.3.2 Pricing
6.4 Strategic Initiatives
6.4.1 Marketing and promotional activities
6.4.2 Distribution and Supply Chain Strategies
6.4.3 Expansion Plans and New Product Launches
6.4.4 Strategic partnerships and collaborations
6.5 Technological Advancements
6.6 Market Positioning and Branding
7. Red Biotechnology Market Segmentation By Product
7.1 Chapter Overview
7.2 Monoclonal Antibodies
7.2.1 Monoclonal Antibodies Trend Analysis (2021-2032)
7.2.2 Monoclonal Antibodies Market Size Estimates and Forecasts to 2032 (USD Billion)
7.3 Polyclonal Antibodies
7.3.1 Polyclonal Antibodies Market Trends Analysis (2021-2032)
7.3.2 Polyclonal Antibodies Market Size Estimates and Forecasts to 2032 (USD Billion)
7.4 Recombinant Proteins
7.4.1 Recombinant Proteins Market Trends Analysis (2021-2032)
7.4.2 Recombinant Proteins Market Size Estimates and Forecasts to 2032 (USD Billion)
7.5 Vaccines
7.5.1 Vaccines Market Trends Analysis (2021-2032)
7.5.2 Vaccines Market Size Estimates and Forecasts to 2032 (USD Billion)
7.6 Cell-Based Immunotherapy Products
7.6.1 Cell-Based Immunotherapy Products Market Trends Analysis (2021-2032)
7.6.2 Cell-Based Immunotherapy Products Market Size Estimates and Forecasts to 2032 (USD Billion)
7.7 Gene Therapy Products
7.7.1 Gene Therapy Products Market Trends Analysis (2021-2032)
7.7.2 Gene Therapy Products Market Size Estimates and Forecasts to 2032 (USD Billion)
7.8 Cell Therapy Products
7.8.1 Cell Therapy Products Market Trends Analysis (2021-2032)
7.8.2 Cell Therapy Products Market Size Estimates and Forecasts to 2032 (USD Billion)
7.9 Tissue-Engineered Products
7.9.1 Tissue-Engineered Products Market Trends Analysis (2021-2032)
7.9.2 Tissue-Engineered Products Market Size Estimates and Forecasts to 2032 (USD Billion)
7.10 Stem Cells
7.10.1 Stem Cells Market Trends Analysis (2021-2032)
7.10.2 Stem Cells Market Size Estimates and Forecasts to 2032 (USD Billion)
7.11 Cell Culture
7.11.1 Cell Culture Market Trends Analysis (2021-2032)
7.11.2 Cell Culture Market Size Estimates and Forecasts to 2032 (USD Billion)
7.12 Viral Vector
7.12.1 Viral Vector Market Trends Analysis (2021-2032)
7.12.2 Viral Vector Market Size Estimates and Forecasts to 2032 (USD Billion)
7.13 Enzymes
7.13.1 Enzymes Market Trends Analysis (2021-2032)
7.13.2 Enzymes Market Size Estimates and Forecasts to 2032 (USD Billion)
7.14 Kits And Reagents
7.14.1 Kits And Reagents Market Trends Analysis (2021-2032)
7.14.2 Kits And Reagents Market Size Estimates and Forecasts to 2032 (USD Billion)
7.15 Animal Models
7.15.1 Animal Models Market Trends Analysis (2021-2032)
7.15.2 Animal Models Market Size Estimates and Forecasts to 2032 (USD Billion)
7.16 Molecular Diagnostics
7.16.1 Molecular Diagnostics Market Trends Analysis (2021-2032)
7.16.2 Molecular Diagnostics Market Size Estimates and Forecasts to 2032 (USD Billion)
7.17 Others
7.17.1 Others Market Trends Analysis (2021-2032)
7.17.2 Others Market Size Estimates and Forecasts to 2032 (USD Billion)
8. Red Biotechnology Market Segmentation By End-user
8.1 Chapter Overview
8.2 Academic Research Institutes
8.2.1 Academic Research Institutes Market Trends Analysis (2021-2032)
8.2.2 Academic Research Institutes Market Size Estimates and Forecasts to 2032 (USD Billion)
8.3 CMOs & CROs
8.3.1 CMOs & CROs Market Trends Analysis (2021-2032)
8.3.2 CMOs & CROs Market Size Estimates and Forecasts to 2032 (USD Billion)
8.4 Pharmaceutical & Biotechnology Companies
8.4.1 Pharmaceutical & Biotechnology Companies Market Trends Analysis (2021-2032)
8.4.2 Pharmaceutical & Biotechnology Companies Market Size Estimates and Forecasts to 2032 (USD Billion)
8.5 Others
8.5.1 Others Market Trends Analysis (2021-2032)
8.5.2 Others Market Size Estimates and Forecasts to 2032 (USD Billion)
9. Regional Analysis
9.1 Chapter Overview
9.2 North America
9.2.1 Trends Analysis
9.2.2 North America Red Biotechnology Market Estimates and Forecasts, by Country (2021-2032) (USD Billion)
9.2.3 North America Red Biotechnology Market Estimates and Forecasts, By Product (2021-2032) (USD Billion)
9.2.4 North America Red Biotechnology Market Estimates and Forecasts, By End-user (2021-2032) (USD Billion)
9.2.5 USA
9.2.5.1 USA Red Biotechnology Market Estimates and Forecasts, By Product (2021-2032) (USD Billion)
9.2.5.2 USA Red Biotechnology Market Estimates and Forecasts, By End-user (2021-2032) (USD Billion)
9.2.6 Canada
9.2.6.1 Canada Red Biotechnology Market Estimates and Forecasts, By Product (2021-2032) (USD Billion)
9.2.6.2 Canada Red Biotechnology Market Estimates and Forecasts, By End-user (2021-2032) (USD Billion)
9.2.7 Mexico
9.2.7.1 Mexico Red Biotechnology Market Estimates and Forecasts, By Product (2021-2032) (USD Billion)
9.2.7.2 Mexico Red Biotechnology Market Estimates and Forecasts, By End-user (2021-2032) (USD Billion)
9.3 Europe
9.3.1 Trends Analysis
9.3.2 Europe Red Biotechnology Market Estimates and Forecasts, by Country (2021-2032) (USD Billion)
9.3.3 Europe Red Biotechnology Market Estimates and Forecasts, By Product (2021-2032) (USD Billion)
9.3.4 Europe Red Biotechnology Market Estimates and Forecasts, By End-user (2021-2032) (USD Billion)
9.3.5 Germany
9.3.5.1 Germany Red Biotechnology Market Estimates and Forecasts, By Product (2021-2032) (USD Billion)
9.3.5.2 Germany Red Biotechnology Market Estimates and Forecasts, By End-user (2021-2032) (USD Billion)
9.3.6 France
9.3.6.1 France Red Biotechnology Market Estimates and Forecasts, By Product (2021-2032) (USD Billion)
9.3.6.2 France Red Biotechnology Market Estimates and Forecasts, By End-user (2021-2032) (USD Billion)
9.3.7 UK
9.3.7.1 UK Red Biotechnology Market Estimates and Forecasts, By Product (2021-2032) (USD Billion)
9.3.7.2 UK Red Biotechnology Market Estimates and Forecasts, By End-user (2021-2032) (USD Billion)
9.3.8 Italy
9.3.8.1 Italy Red Biotechnology Market Estimates and Forecasts, By Product (2021-2032) (USD Billion)
9.3.8.2 Italy Red Biotechnology Market Estimates and Forecasts, By End-user (2021-2032) (USD Billion)
9.3.9 Spain
9.3.9.1 Spain Red Biotechnology Market Estimates and Forecasts, By Product (2021-2032) (USD Billion)
9.3.9.2 Spain Red Biotechnology Market Estimates and Forecasts, By End-user (2021-2032) (USD Billion)
9.3.10 Poland
9.3.10.1 Poland Red Biotechnology Market Estimates and Forecasts, By Product (2021-2032) (USD Billion)
9.3.10.2 Poland Red Biotechnology Market Estimates and Forecasts, By End-user (2021-2032) (USD Billion)
9.3.11 Turkey
9.3.11.1 Turkey Red Biotechnology Market Estimates and Forecasts, By Product (2021-2032) (USD Billion)
9.3.11.2 Turkey Red Biotechnology Market Estimates and Forecasts, By End-user (2021-2032) (USD Billion)
9.3.12 Rest of Europe
9.3.12.1 Rest of Europe Red Biotechnology Market Estimates and Forecasts, By Product (2021-2032) (USD Billion)
9.3.12.2 Rest of Europe Red Biotechnology Market Estimates and Forecasts, By End-user (2021-2032) (USD Billion)
9.4 Asia Pacific
9.4.1 Trends Analysis
9.4.2 Asia Pacific Red Biotechnology Market Estimates and Forecasts, by Country (2021-2032) (USD Billion)
9.4.3 Asia Pacific Red Biotechnology Market Estimates and Forecasts, By Product (2021-2032) (USD Billion)
9.4.4 Asia Pacific Red Biotechnology Market Estimates and Forecasts, By End-user (2021-2032) (USD Billion)
9.4.5 China
9.4.5.1 China Red Biotechnology Market Estimates and Forecasts, By Product (2021-2032) (USD Billion)
9.4.5.2 China Red Biotechnology Market Estimates and Forecasts, By End-user (2021-2032) (USD Billion)
9.4.6 India
9.4.5.1 India Red Biotechnology Market Estimates and Forecasts, By Product (2021-2032) (USD Billion)
9.4.5.2 India Red Biotechnology Market Estimates and Forecasts, By End-user (2021-2032) (USD Billion)
9.4.5 Japan
9.4.5.1 Japan Red Biotechnology Market Estimates and Forecasts, By Product (2021-2032) (USD Billion)
9.4.5.2 Japan Red Biotechnology Market Estimates and Forecasts, By End-user (2021-2032) (USD Billion)
9.4.6 South Korea
9.4.6.1 South Korea Red Biotechnology Market Estimates and Forecasts, By Product (2021-2032) (USD Billion)
9.4.6.2 South Korea Red Biotechnology Market Estimates and Forecasts, By End-user (2021-2032) (USD Billion)
9.4.7 Singapore
9.4.7.1 Singapore Red Biotechnology Market Estimates and Forecasts, By Product (2021-2032) (USD Billion)
9.4.7.2 Singapore Red Biotechnology Market Estimates and Forecasts, By End-user (2021-2032) (USD Billion)
8.4.8 Australia
8.4.8.1 Australia Red Biotechnology Market Estimates and Forecasts, By Product (2021-2032) (USD Billion)
8.4.8.2 Australia Red Biotechnology Market Estimates and Forecasts, By End-user (2021-2032) (USD Billion)
9.4.9 Rest of Asia Pacific
9.4.9.1 Rest of Asia Pacific Red Biotechnology Market Estimates and Forecasts, By Product (2021-2032) (USD Billion)
9.4.9.2 Rest of Asia Pacific Red Biotechnology Market Estimates and Forecasts, By End-user (2021-2032) (USD Billion)
9.5 Middle East & Africa
9.5.1 Trends Analysis
9.5.2 Middle East & Africa Red Biotechnology Market Estimates and Forecasts, by Country (2021-2032) (USD Billion)
9.5.3 Middle East & Africa Red Biotechnology Market Estimates and Forecasts, By Product (2021-2032) (USD Billion)
9.5.4 Middle East & Africa Red Biotechnology Market Estimates and Forecasts, By End-user (2021-2032) (USD Billion)
9.5.5 UAE
9.5.5.1 UAE Red Biotechnology Market Estimates and Forecasts, By Product (2021-2032) (USD Billion)
9.5.5.2 UAE Red Biotechnology Market Estimates and Forecasts, By End-user (2021-2032) (USD Billion)
9.5.6 Saudi Arabia
9.5.6.1 Saudi Arabia Red Biotechnology Market Estimates and Forecasts, By Product (2021-2032) (USD Billion)
9.5.6.2 Saudi Arabia Red Biotechnology Market Estimates and Forecasts, By End-user (2021-2032) (USD Billion)
9.5.7 Qatar
9.5.7.1 Qatar Red Biotechnology Market Estimates and Forecasts, By Product (2021-2032) (USD Billion)
9.5.7.2 Qatar Red Biotechnology Market Estimates and Forecasts, By End-user (2021-2032) (USD Billion)
9.5.8 South Africa
9.5.8.1 South Africa Red Biotechnology Market Estimates and Forecasts, By Product (2021-2032) (USD Billion)
9.5.8.2 South Africa Red Biotechnology Market Estimates and Forecasts, By End-user (2021-2032) (USD Billion)
9.5.9 Middle East & Africa
9.5.9.1 Middle East & Africa Red Biotechnology Market Estimates and Forecasts, By Product (2021-2032) (USD Billion)
9.5.9.2 Middle East & Africa Red Biotechnology Market Estimates and Forecasts, By End-user (2021-2032) (USD Billion)
9.6 Latin America
9.6.1 Trends Analysis
9.6.2 Latin America Red Biotechnology Market Estimates and Forecasts, by Country (2021-2032) (USD Billion)
9.6.3 Latin America Red Biotechnology Market Estimates and Forecasts, By Product (2021-2032) (USD Billion)
9.6.4 Latin America Red Biotechnology Market Estimates and Forecasts, By End-user (2021-2032) (USD Billion)
9.6.5 Brazil
9.6.5.1 Brazil Red Biotechnology Market Estimates and Forecasts, By Product (2021-2032) (USD Billion)
9.6.5.2 Brazil Red Biotechnology Market Estimates and Forecasts, By End-user (2021-2032) (USD Billion)
9.6.6 Argentina
9.6.6.1 Argentina Red Biotechnology Market Estimates and Forecasts, By Product (2021-2032) (USD Billion)
9.6.6.2 Argentina Red Biotechnology Market Estimates and Forecasts, By End-user (2021-2032) (USD Billion)
9.6.7 Rest of Latin America
9.6.7.1 Rest of Latin America Red Biotechnology Market Estimates and Forecasts, By Product (2021-2032) (USD Billion)
9.6.7.2 Rest of Latin America Red Biotechnology Market Estimates and Forecasts, By End-user (2021-2032) (USD Billion)
10. Company Profiles
10.1 Merck KGaA
10.1.1 Company Overview
10.1.2 Financial
10.1.3 Product / Services Offered
10.1.4 SWOT Analysis
10.2 Roche
10.2.1 Company Overview
10.2.2 Financial
10.2.3 Product/ Services Offered
10.2.4 SWOT Analysis
10.3 Pfizer
10.3.1 Company Overview
10.3.2 Financial
10.3.3 Product/ Services Offered
10.3.4 SWOT Analysis
10.4 Regeneron
10.4.1 Company Overview
10.4.2 Financial
10.4.3 Product/ Services Offered
10.4.4 SWOT Analysis
10.5 AstraZeneca
10.5.1 Company Overview
10.5.2 Financial
10.5.3 Product/ Services Offered
10.5.4 SWOT Analysis
10.6 Takeda
10.6.1 Company Overview
10.6.2 Financial
10.6.3 Product/ Services Offered
10.6.4 SWOT Analysis
10.7 Gilead Sciences
10.7.1 Company Overview
10.7.2 Financial
10.7.3 Product/ Services Offered
10.7.4 SWOT Analysis
10.8 Biogen
10.8.1 Company Overview
10.8.2 Financial
10.8.3 Product/ Services Offered
10.8.4 SWOT Analysis
10.9 Amgen
10.9.1 Company Overview
10.9.2 Financial
10.9.3 Product/ Services Offered
10.9.4 SWOT Analysis
10.10 Celgene
10.10.1 Company Overview
10.10.2 Financial
10.10.3 Product/ Services Offered
10.10.4 SWOT Analysis
11. Use Cases and Best Practices
12. Conclusion
An accurate research report requires proper strategizing as well as implementation. There are multiple factors involved in the completion of good and accurate research report and selecting the best methodology to compete the research is the toughest part. Since the research reports we provide play a crucial role in any company’s decision-making process, therefore we at SNS Insider always believe that we should choose the best method which gives us results closer to reality. This allows us to reach at a stage wherein we can provide our clients best and accurate investment to output ratio.
Each report that we prepare takes a timeframe of 350-400 business hours for production. Starting from the selection of titles through a couple of in-depth brain storming session to the final QC process before uploading our titles on our website we dedicate around 350 working hours. The titles are selected based on their current market cap and the foreseen CAGR and growth.
The 5 steps process:
Step 1: Secondary Research:
Secondary Research or Desk Research is as the name suggests is a research process wherein, we collect data through the readily available information. In this process we use various paid and unpaid databases which our team has access to and gather data through the same. This includes examining of listed companies’ annual reports, Journals, SEC filling etc. Apart from this our team has access to various associations across the globe across different industries. Lastly, we have exchange relationships with various university as well as individual libraries.
Step 2: Primary Research
When we talk about primary research, it is a type of study in which the researchers collect relevant data samples directly, rather than relying on previously collected data. This type of research is focused on gaining content specific facts that can be sued to solve specific problems. Since the collected data is fresh and first hand therefore it makes the study more accurate and genuine.
We at SNS Insider have divided Primary Research into 2 parts.
Part 1 wherein we interview the KOLs of major players as well as the upcoming ones across various geographic regions. This allows us to have their view over the market scenario and acts as an important tool to come closer to the accurate market numbers. As many as 45 paid and unpaid primary interviews are taken from both the demand and supply side of the industry to make sure we land at an accurate judgement and analysis of the market.
This step involves the triangulation of data wherein our team analyses the interview transcripts, online survey responses and observation of on filed participants. The below mentioned chart should give a better understanding of the part 1 of the primary interview.
Part 2: In this part of primary research the data collected via secondary research and the part 1 of the primary research is validated with the interviews from individual consultants and subject matter experts.
Consultants are those set of people who have at least 12 years of experience and expertise within the industry whereas Subject Matter Experts are those with at least 15 years of experience behind their back within the same space. The data with the help of two main processes i.e., FGDs (Focused Group Discussions) and IDs (Individual Discussions). This gives us a 3rd party nonbiased primary view of the market scenario making it a more dependable one while collation of the data pointers.
Step 3: Data Bank Validation
Once all the information is collected via primary and secondary sources, we run that information for data validation. At our intelligence centre our research heads track a lot of information related to the market which includes the quarterly reports, the daily stock prices, and other relevant information. Our data bank server gets updated every fortnight and that is how the information which we collected using our primary and secondary information is revalidated in real time.
Step 4: QA/QC Process
After all the data collection and validation our team does a final level of quality check and quality assurance to get rid of any unwanted or undesired mistakes. This might include but not limited to getting rid of the any typos, duplication of numbers or missing of any important information. The people involved in this process include technical content writers, research heads and graphics people. Once this process is completed the title gets uploader on our platform for our clients to read it.
Step 5: Final QC/QA Process:
This is the last process and comes when the client has ordered the study. In this process a final QA/QC is done before the study is emailed to the client. Since we believe in giving our clients a good experience of our research studies, therefore, to make sure that we do not lack at our end in any way humanly possible we do a final round of quality check and then dispatch the study to the client.
Key Segments
By Product
Monoclonal Antibodies
Polyclonal Antibodies
Recombinant Proteins
Vaccines
Cell-Based Immunotherapy Products
Gene Therapy Products
Cell Therapy Products
Tissue-Engineered Products
Stem Cells
Cell Culture
Viral Vector
Enzymes
Kits And Reagents
Animal Models
Molecular Diagnostics
Others
By End-user
Academic Research Institutes
CMOs & CROs
Pharmaceutical & Biotechnology Companies
Others
Request for Segment Customization as per your Business Requirement: Segment Customization Request
Regional Coverage:
North America
US
Canada
Mexico
Europe
Germany
France
UK
Italy
Spain
Poland
Turkey
Rest of Europe
Asia Pacific
China
India
Japan
South Korea
Singapore
Australia
Rest of Asia Pacific
Middle East & Africa
UAE
Saudi Arabia
Qatar
South Africa
Rest of Middle East & Africa
Latin America
Brazil
Argentina
Rest of Latin America
Request for Country Level Research Report: Country Level Customization Request
Available Customization
With the given market data, SNS Insider offers customization as per the company’s specific needs. The following customization options are available for the report:
Detailed Volume Analysis
Criss-Cross segment analysis (e.g., Product X Application)
Competitive Product Benchmarking
Geographic Analysis
Additional countries in any of the regions
Customized Data Representation
Detailed analysis and profiling of additional market players
Dental Sterilization Market was valued at USD 1.54 billion in 2023, projected to reach USD 3.30 billion by 2032, growing at a CAGR of 8.86% from 2024-2032.
The Robotic Surgical Procedures Market to grow from USD 10.66 billion in 2023 to USD 51.91 billion by 2032, at a 19.27% CAGR.
The Psoriasis Treatment Market size was valued at USD 22.38 billion in 2023 and is projected to reach USD 54.40 billion by 2032, growing at a CAGR of 10.4%.
The Multiple Myeloma Market size was estimated at USD 24.01 Billion In 2023 & is estimated to reach USD 59.45 Billion by 2032 and increase at a compound annual growth rate of 10.6% between 2024 and 2032.
Pet Funeral Services Market Size was valued at USD 2.32 billion in 2023 and is expected to reach USD 3.43 billion by 2032, growing at a CAGR of 4.44% over the forecast period 2024-2032.
The Medical Device Cleaning Market size was valued at USD 21.74 billion in 2023 and is expected to reach USD 51.96 billion by 2032, growing at a CAGR of 10.22% from 2024-2032.
Hi! Click one of our member below to chat on Phone