
Renewable Curtailment Management Market Report Scope and Overview:
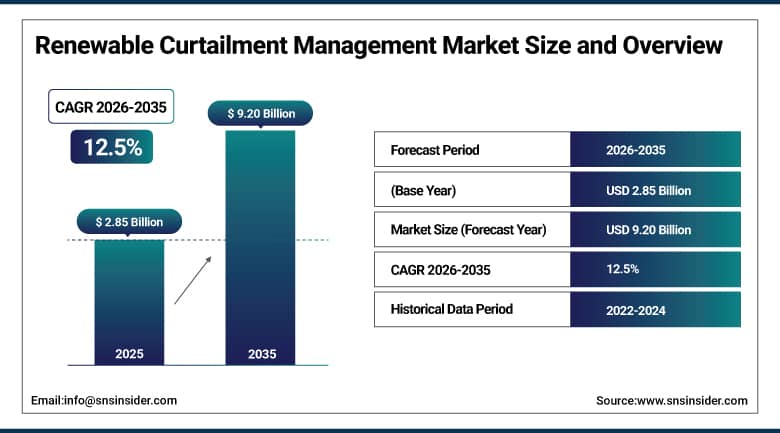
The Renewable Curtailment Management Market was valued at USD 2.85 Billion in 2025 and is projected to reach USD 9.20 Billion by 2035, registering a CAGR of 12.5% from 2026 to 2035.
Renewable Curtailment Management Market for Renewable has been changing the game for utilities and independent power producers through dispatch optimization based on AI technology, grid analytics, and automated curtailment management software that ensures minimum loss of generation income due to transmission limitations and oversupply. These features characterize the market due to the high expenditures of the owners of the renewable energy assets on forecasting curtailment software, integration of more solar and wind capacity than the transmission capacity allows for, necessity of fair compensation for curtailed generation, and broad use cases of curtailment solutions across utility-scale, C&I and residential renewables.
In January 2026, Power Factors opted to employ portfolio optimization as their strategy for investing in renewable energy firms, arguing that given the increased significance of factors such as weather, transmission congestion, and markets, coupled with the emergence of solar/wind/battery hybrid systems, it is imperative that coordination occurs.
To Get More Information On Renewable Curtailment Management Market - Request Free Sample Report
Renewable Curtailment Management Market Trends
-
Expanding shift from reactive curtailment logging toward AI-driven predictive dispatch forecasting across utility-scale renewable portfolios.
-
Growing independent power producer investment in curtailment analytics continues accelerating software platform procurement.
-
Rising transmission constraint frequency continues expanding the addressable base for hardware-enabled automated curtailment response systems.
-
Increasing integration of curtailment management platforms with battery storage dispatch continues improving overall asset revenue capture.
-
Growing adoption of cloud-based deployment continues reducing implementation timelines for multi-site renewable portfolio operators.
U.S. Renewable Curtailment Management Market Outlook
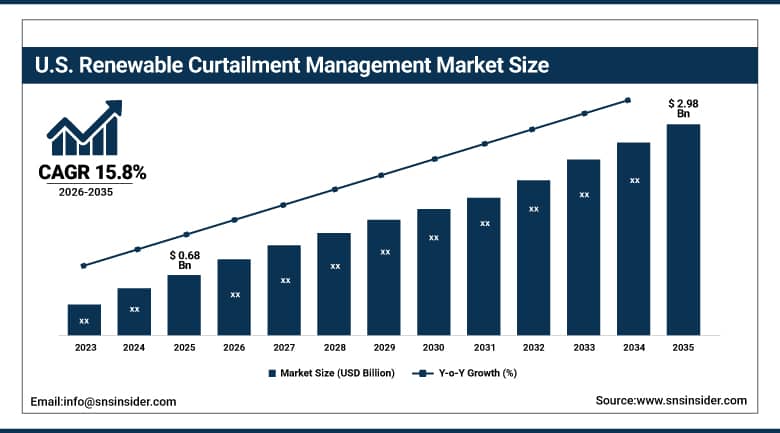
The U.S. Renewable Curtailment Management Market was valued at approximately USD 0.68 Billion in 2025 and is projected to reach approximately USD 2.98 Billion by 2035, registering a CAGR of approximately 15.8% from 2026 to 2035.
The demand for the product in the United States was further driven by increased curtailment rates in California and Texas, due to increased installation of solar and wind energy capacities compared to transmission capacities, increased importance given by the government to the improvement in interconnection queues, and high demand from independent power producers to reduce lost revenues through power purchase agreements. The adoption of AI-enabled dispatch and curtailment forecast technologies in CAISO and ERCOT markets was important for demonstrating the rapidly growing nature of the U.S. renewable curtailment management market. Besides this, the use of curtailment analytics in hybrid solar plus storage and wind repowering was driving the demand for this technology in the domestic market.
In 2026, the Grid-Firming portfolio by GE Vernova is becoming more relevant for US utilities, as electricity demand is hitting record highs and the share of renewable energy production is growing. EIA predicts that electricity consumption in the United States will increase to 4,270 billion kWh in 2026.
Renewable Curtailment Management Market Segment Analysis
-
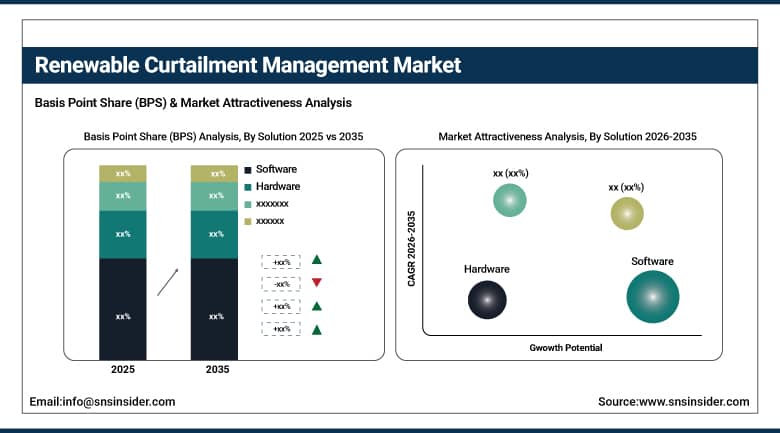
By Solution, Software segment dominated the Renewable Curtailment Management Market in 2025 with 42% share; Software segment is also the fastest growing segment, registering a CAGR of 14.2% from 2026 to 2035.
-
By Renewable Source, Solar segment dominated the market in 2025 with 48% share; Wind segment is the fastest growing segment, registering a CAGR of 13.8% from 2026 to 2035.
-
By Application, Utility-Scale segment dominated the market in 2025 with 66% share; Commercial & Industrial segment is the fastest growing segment, registering a CAGR of 14.5% from 2026 to 2035.
-
By Deployment Mode, On-Premises segment dominated the market in 2025 with 57% share; Cloud-based segment is the fastest growing segment, registering a CAGR of 14.0% from 2026 to 2035.
-
By End User, Utilities segment dominated the market in 2025 with 44% share; Independent Power Producers segment is the fastest growing segment, registering a CAGR of 14.3% from 2026 to 2035.
By Solution, Software Leads and Grows Fastest
Software has gained the maximum revenue share in the Renewable Curtailment Management Market during the forecast year 2025 due to its crucial function in the aggregation of weather and grid constraint and market signals to derive a dispatch action on distributed renewable energy sources. An example is the development by Siemens Energy AG of Sicam GridEdge curtailment analytics module, which has incorporated AI-enabled forecast of dispatch actions for utility scale wind and solar operators.
Software is anticipated to continue as the fastest growing solutions category since there is a transition from investments in the installation of hardware assets to a subscription of forecast systems. Further, the incorporation of curtailment software with battery dispatch and demand response will continue the average growth rate of this category.
By Renewable Source, Solar Dominates, Wind Grows Fastest
The Solar segment captured the highest market share in the Renewable Curtailment Management Market in 2025 owing to the fast addition of utility-scale and distributed solar installations that often exceeded the capacity to upgrade transmission and distribution networks in California, Texas and some parts of China. The faster development period of Solar over Wind has made it the major source of curtailments that need management through software.
The Wind segment is expected to register the fastest growth owing to increasing capacity addition of both offshore and onshore Wind in Europe and Asia Pacific that experiences transmission challenges during high generation periods. Increasing use of forecast and dispatch for wind variability has propelled its growth at a higher rate than others.
By Application, Utility-Scale Leads, Commercial & Industrial Grows Fastest
Utility Scale Applications held the maximum market share in the Renewable Curtailment Management Market in 2025 owing to the high financial exposure of solar/wind farms to curtailment and thus making the use of specialized software for forecasting and dispatch cost effective. Independent Power Producers with utility-scale portfolios continue to be the key consumers of renewable curtailment management software.
Commercial and Industrial Applications are forecasted to show highest growth on account of growing corporate renewable procurement and generation by companies, thus increasing the exposure of commercial and industrial companies to curtailment risks, which were earlier limited to utility scale companies only. Increasing use of renewable curtailment aware energy management software by industrial renewable energy companies is driving this growth.
By Deployment Mode, On-Premises Leads, Cloud-based Grows Fastest
The On-Premises Deployment segment accounted for the maximum market share in 2025, with large-scale utility and grid operators who operate multi-gigawatt renewables portfolios continuing to prefer On-premises deployment for security and compliance purposes, along with integration with existing SCADA systems. Such a preference has been further driven by stringent data sovereignty norms in a few key renewable energy generation countries.
The Cloud-Based Deployment segment is expected to witness the highest growth, owing to an increasing number of small and medium-scale IPPs and commercial & industrial customers switching towards cloud-based subscription-based solutions that do not demand any initial setup costs. Increasing comfort among vendors regarding cloud-based deployment certification has helped propel this trend.
By End User, Utilities Dominate, Independent Power Producers Gain Fastest Traction
Utilities emerged as the dominant end-user segment in the Renewable Curtailment Management Market in 2025 due to the liability of utilities to maintain the balance between grid stability and renewable power variability. Large curtailment management projects by utilities in North America, Europe and Asia Pacific, related to delays in the interconnection queue, clearly indicate that utilities have invested directly in curtailment management software.
Independent Power Producers will emerge as the fastest-growing end-user segment due to the adoption of curtailment management solutions by renewable asset owners to safeguard their investments made under existing power purchase agreements. Increased spending on curtailment management software by IPPs having a multi-gigawatt portfolio is an example of the growing significance of curtailment management solutions in the non-traditional utilities domain.
Regional Analysis:
|
Region |
Major Country |
Share within Region, 2025 (%) |
|---|---|---|
|
North America |
United States |
79.60% |
|
Europe |
Germany |
24.90% |
|
Asia Pacific |
China |
39.80% |
|
Middle East and Africa |
Saudi Arabia |
26.70% |
|
Latin America |
Brazil |
35.10% |
Asia Pacific Renewable Curtailment Management Market Insights
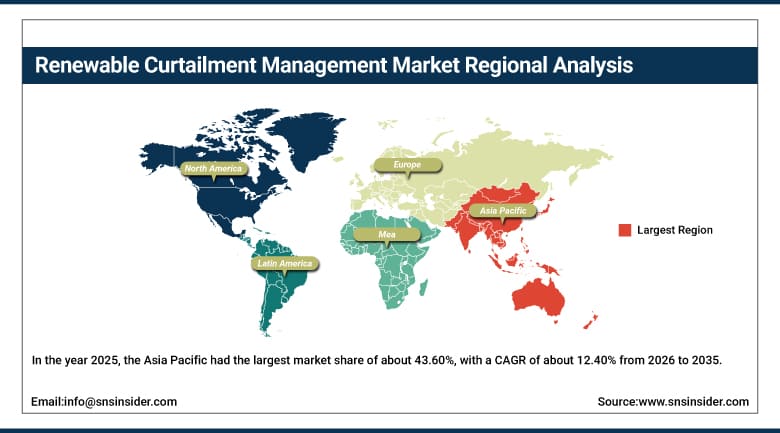
The Asia Pacific had the largest market share of about 43.60% in 2025. This was mainly due to huge investments in renewable energy infrastructure in countries such as China and India, where governments have set aggressive targets and supportive policies. In addition, cooperation between utilities and regional curtailment analytics service providers played a significant role in maintaining the lead of Asia Pacific region in the market.
The large market share of China was mainly due to investment by State Grid Corporation in curtailment mitigation software. Increasing capabilities in homegrown AI-based dispatch forecast also played an important role in capturing the market share for China.
Get Customized Report as Per Your Business Requirement - Enquiry Now
North America Renewable Curtailment Management Market Insights
In the market, North America is showing the highest growth rate among all the regions studied with a CAGR of 15.8% in 2025 because of rapidly increasing curtailment rates in California and Texas due to installations of solar/wind generation that is adding more capacity than can be accommodated by transmission development, high pressure from regulators about interconnection queue reform, and the existence of leading curtailment analytics companies based in the region. The other reason behind the fast-growing nature of North America in the market includes close collaboration between independent power producers and local software companies.
Majority of the total revenue of North America was attributed to the United States because of rising demand for AI-based forecast technology in CAISO/ERCOT operations, increased demand from independent power producers in protecting their generation revenues with power purchase agreements, and installation of battery storage dispatch aware of curtailment.
Europe Renewable Curtailment Management Market Insights
Europe received a sustainable share of the global renewable curtailment management market on account of the aggressive expansion of offshore wind generation in the continent, huge investments into cross-border electricity transactions infrastructure, and growing adoption of renewable curtailment forecasting in the highly wind-dominated grids in Europe. The increased deployment of dispatch optimization software has encouraged renewables producers in the region to adopt vendor neutral curtailment management systems.
Germany emerged as the leader in the European renewable curtailment management market owing to huge curtailment management initiatives taken by transmission grid operators as part of the offshore wind interconnection expansion plan of Germany. The United Kingdom is another country that has made a notable contribution to the demand for curtailment management services in the region on account of its offshore wind development projects.
MEA and Latin America Renewable Curtailment Management Market Insights
The Middle East & Africa and Latin America witnessed consistent growth due to more investments in infrastructure related to renewables, government diversification strategies, and cooperation between domestic utilities and global providers of curtailment management software solutions. Transmission lines, that currently face problems with their capacity, are becoming more popular places for implementing curtailment management software solutions because the number of renewables is growing faster than transmission lines themselves.
Saudi Arabia was the biggest country market in Middle East & Africa due to substantial investments into renewable infrastructure associated with the country's solar diversification program. In addition, grid modernization efforts in the UAE were adding to ME&A's growth as well. In Latin America, Brazil became the country market with the highest level of revenue generation due to high volumes of renewable power and curtailment mitigation needs in the country.
Market Dynamics:
Growth Drivers: Rising Renewable Penetration and Transmission Constraint Frequency
The market is driven forward on account of increased renewable capacity additions that frequently outpace transmission and distribution network upgrades, rising utilization of AI-based dispatch forecasting and automated curtailment response tools, growing regulatory pressure to fairly compensate curtailed generation, and an expanded range of applications from utility-scale solar and wind farms to commercial and industrial installations. With the growing number of asset owner announcements regarding curtailment mitigation investment and corresponding capital deployment in this process, demand for curtailment management solutions is forecast to remain robust throughout the entire value chain.
Increased collaboration between renewable asset operators and grid analytics vendors, as well as government financing of interconnection queue reform initiatives, can also be taken as supporting evidence for this trend. In addition, the persistent global emphasis on protecting renewable asset revenue under existing power purchase agreements is yet another reason behind rising demand and corresponding growth throughout the forecast period.
Restraints: High Software Integration Costs and Forecasting Model Accuracy Limits
The relatively high cost associated with integrating curtailment forecasting software across geographically dispersed, multi-technology renewable portfolios, compared to continuing manual curtailment logging, remains a reality that limits faster market adoption since smaller asset owners with constrained budgets often defer comprehensive platform deployment. This has led to phased implementation of curtailment management software concentrated among large utility-scale portfolio operators.
Another factor complicating deployment has been the challenge of achieving consistently accurate dispatch forecasts across variable weather conditions and evolving grid topology, which sometimes requires extended model calibration periods and specialized data science expertise that makes projects more complex than straightforward software installation. This issue can only be addressed through qualified forecasting engineers and verified model validation standards.
Opportunities: Storage Integration and Cross-Portfolio Analytics Expansion
The trend toward the use of curtailment management solutions in conjunction with battery energy storage dispatching presents a substantial chance for vendors as asset owners look at ways to transform curtailed generation into dispatchable revenue from storage, instead of losing generation capacity. Platform partnerships, such as Clir Renewables working with a major North American wind asset owner to implement AI-enabled curtailment prediction in their gigawatts-scale portfolio show how vendors are attempting to benefit from the trend towards combined storage and curtailment workflows.
Moreover, the trend among independent power producers to seek cross-portfolio analytics and compare curtailment results for geographically distributed assets creates chances for vendors that can offer concrete examples of reduction in lost generation revenues. Vendors offering data packages proving savings on curtailments and increased efficiency of dispatching will be able to capture more of the investments.
Recent Developments:
-
2025: Siemens Energy AG launched an enhanced version of its Sicam GridEdge curtailment analytics module, adding AI-based dispatch forecasting to help utility-scale solar and wind operators minimize lost generation during grid congestion events.
-
2026: Clir Renewables partnered with a major North American wind asset operator to deploy its AI-driven curtailment forecasting platform across a multi-gigawatt portfolio, aiming to reduce unplanned curtailment losses tied to transmission constraints.
-
2026: Hitachi Energy expanded renewable-integration solutions combining grid-scale battery storage and grid technologies. Its 300 MW/650 MWh Australian BESS project with AusNet is designed to support grid stability and enable deeper renewable integration.
Renewable Curtailment Management Market key players are:
-
Siemens Energy AG
-
ABB Ltd.
-
Schneider Electric SE
-
Hitachi Energy Ltd.
-
GE Vernova Inc.
-
Oracle Corporation
-
AutoGrid Systems, Inc.
-
Clir Renewables Inc.
-
Power Factors, LLC
-
Enbala Power Networks Inc.
-
DNV AS
-
Uptake Technologies, Inc.
-
Greenbyte AB
-
Emerson Electric Co.
-
Honeywell International Inc.
-
Wärtsilä Corporation
-
Envision Digital International Pte. Ltd.
-
Vestas Wind Systems A/S
-
S&C Electric Company
-
Utilidata, Inc.
Renewable Curtailment Management Market Report Scope:
| Report Attributes | Details |
|---|---|
| Market Size in 2025 | USD 2.85 Billion |
| Market Size by 2035 | USD 9.20 Billion |
| CAGR | 12.5% from 2026 to 2035 |
| Base Year | 2025 |
| Forecast Period | 2026-2035 |
| Historical Data | 2022-2024 |
| Report Scope & Coverage | Market Size, Segments Analysis, Competitive Landscape, Regional Analysis, DROC & SWOT Analysis, Forecast Outlook |
| Key Segments | •By Solution (Software, Hardware, Services) •By Renewable Source (Solar, Wind, Hydropower, Others) •By Application (Utility-Scale, Commercial & Industrial, Residential) •By Deployment Mode (On-Premises, Cloud-based) •By End User (Utilities, Independent Power Producers, Grid Operators, Others) |
| Regional Analysis/Coverage | North America (US, Canada), Europe (Germany, UK, France, Italy, Spain, Russia, Poland, Rest of Europe), Asia Pacific (China, India, Japan, South Korea, Australia, ASEAN Countries, Rest of Asia Pacific), Middle East & Africa (UAE, Saudi Arabia, Qatar, South Africa, Rest of Middle East & Africa), Latin America (Brazil, Argentina, Mexico, Colombia, Rest of Latin America). |
| Company Profiles | Siemens Energy AG, ABB Ltd., Schneider Electric SE, Hitachi Energy Ltd., GE Vernova Inc., Oracle Corporation, AutoGrid Systems, Inc., Clir, Renewables Inc., Power Factors, LLC, Enbala, Power Networks Inc., DNV AS, Uptake, Technologies, Inc., Greenbyte AB, Emerson Electric Co., Honeywell International Inc., Wärtsilä Corporation, Envision Digital International Pte. Ltd., Vestas Wind Systems A/S, S&C Electric Company, and Utilidata, Inc. |

Frequently Asked Questions
Key players include Siemens Energy AG, ABB Ltd., Schneider Electric SE, Hitachi Energy Ltd., and GE Vernova Inc., among others.
Key opportunities include rising renewable energy penetration, increasing grid congestion, energy storage integration, advanced forecasting, flexible power management, and growing demand to maximize renewable power utilization.
The major growth factor is rapidly rising renewable capacity additions that outpace transmission and distribution network upgrades, expanding deployment of AI-based dispatch forecasting technologies, and growing regulatory pressure to fairly compensate curtailed generation worldwide.
The Software segment dominated the Renewable Curtailment Management Market by solution, representing the largest share of revenue in 2025.
Asia Pacific dominated the Renewable Curtailment Management Market in 2025.
