Renewable Chemicals Market Report Scope & Overview:
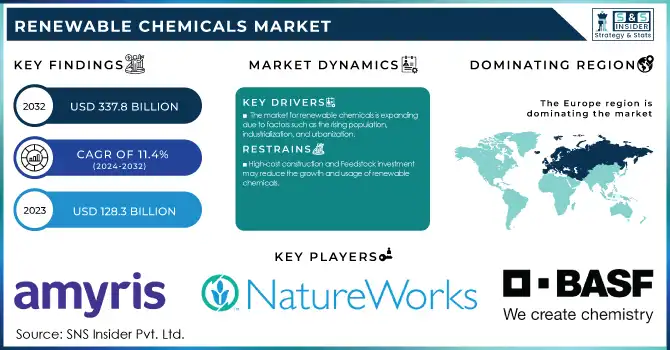
The Renewable Chemicals Market size was valued at USD 128.3 billion in 2023 and is expected to reach USD 337.8 billion by 2032, growing at a CAGR of 11.4% over the forecast period 2024-2032.
The renewable chemicals market is experiencing rapid growth, driven by increasing environmental concerns, a shift towards sustainability, and technological advancements. Leading players in the industry focus on innovation and collaboration to develop sustainable solutions, leveraging renewable feedstocks and advanced technologies. For instance, in October 2024, BASF signed a memorandum of understanding with AM Green for the offtake of 100,000 tons of green ammonia annually, reinforcing its commitment to low-carbon chemical production. Similarly, in December 2024, BASF announced new formulations to enhance the durability and sustainability of renewable chemical applications, showcasing their efforts to address industry demand for eco-friendly solutions. Another significant collaboration emerged in June 2024, when Trillium Renewable Chemicals partnered with INEOS at its Green Lake facility to establish a demonstration plant for sustainable acrylonitrile production, a crucial milestone for reducing dependency on fossil fuels.
Renewable Chemicals Market Size and Forecast
-
Market Size in 2023: USD 128.3 Billion
-
Market Size by 2032: USD 337.8 Billion
-
CAGR: 11.4% from 2024 to 2032
-
Base Year: 2023
-
Forecast Period: 2024–2032
-
Historical Data: 2020–2023
Get E-PDF Sample Report on Renewable Chemicals Market - Request Sample Report
Renewable Chemicals Market Trends:
-
Rising demand for bio-based alternatives to petrochemicals is accelerating market growth, with renewable chemicals expected to grow at a CAGR of over 10% through 2030.
-
Increasing regulatory pressure to reduce carbon emissions is driving adoption, as bio-based chemicals can lower GHG emissions by 30–70% compared to conventional chemicals.
-
Expanding use in bioplastics and packaging is boosting demand, with global bioplastics production capacity projected to exceed 7 million tons annually by 2028.
-
Strong investments in bio-refineries and green chemistry technologies are enhancing production efficiency, improving process yields by 15–25%.
-
Growing adoption across automotive, textiles, and consumer goods is supporting market expansion, with sustainable material usage rising by over 20% annually in key end-use industries.
Collaborations between key industry players and governments are propelling innovation and commercialization. In January 2025, the U.S. Department of Energy allocated up to $23 million to accelerate research and development in renewable chemicals and fuels. Neste has also played a pivotal role in fostering partnerships and innovations; in April 2024, Neste and Lotte Chemical teamed up to advance renewable chemicals and plastics. Further, Neste collaborated with Braskem in October 2024 to supply renewable and recycled feedstocks for polymers and chemicals production, emphasizing the integration of circularity into manufacturing processes. In November 2024, Neste partnered with PCS to promote renewable chemicals in Southeast Asia, demonstrating a commitment to expanding the global footprint of sustainable practices. In July 2024, Mitsubishi Corporation announced plans to scale up its renewable chemical solutions, leveraging international partnerships for technological advancements. These developments underline how market players utilize partnerships, technology, and regulatory support to shape a more sustainable chemical industry future.
Renewable Chemicals Market Drivers:
-
Increasing Focus on Sustainability and Reducing Carbon Footprints Drives Growth in the Renewable Chemicals Market
The growing emphasis on sustainability among industries, governments, and consumers is fueling the adoption of renewable chemicals globally. As concerns over environmental degradation and greenhouse gas emissions rise, industries are shifting from fossil-based resources to renewable feedstocks like biomass, algae, and agricultural waste. Governments across the globe are implementing stringent regulations to minimize carbon footprints, compelling manufacturers to adopt renewable alternatives. Renewable chemicals, including bio-based polymers, bioethanol, and organic acids, are gaining traction in packaging, agriculture, automotive, and consumer goods industries due to their reduced environmental impact. Major companies like Neste and Braskem are collaborating to produce polymers from renewable feedstocks, driving innovation and market penetration. The convergence of public and private efforts underscores the accelerating momentum towards a sustainable chemicals industry.
-
Rising Adoption of Circular Economy Initiatives Fuels Expansion in the Renewable Chemicals Market
-
Government Support and Incentives for Renewable Chemical Production Encourage Market Growth
Governments worldwide are playing a crucial role in promoting renewable chemicals through subsidies, tax incentives, and funding for research and development. Policies aimed at reducing greenhouse gas emissions and promoting bio-economies have created favorable conditions for market growth. For instance, the U.S. Department of Energy allocated $23 million in January 2025 to support renewable chemical and fuel projects. Similarly, European Union policies like the Green Deal emphasize the use of bio-based materials to achieve sustainability goals. Such initiatives not only provide financial support but also encourage innovation by creating a competitive ecosystem. The combined impact of regulatory support and financial incentives is catalyzing the adoption of renewable chemicals across multiple industries.
Renewable Chemicals Market Restraint:
-
High Production Costs and Limited Infrastructure Hinder the Large-Scale Adoption of Renewable Chemicals
Despite the growing demand for renewable chemicals, high production costs and the lack of robust infrastructure remain significant barriers to their widespread adoption. Producing renewable chemicals often involves complex technologies and expensive feedstocks, making them less cost-competitive than conventional petrochemicals. Additionally, the infrastructure required for large-scale production, such as biorefineries and advanced processing units, is limited in many regions. This creates challenges for manufacturers aiming to scale operations and meet rising demand. Companies are investing heavily in R&D to develop cost-efficient processes; however, achieving economies of scale is still a work in progress. Addressing these cost and infrastructure challenges is essential for unlocking the full potential of renewable chemicals in the global market.
Renewable Chemicals Market Opportunity:
-
Expansion of Bio-Based Plastics for Packaging Creates Significant Opportunities in the Renewable Chemicals Market
-
Growing Interest in Algae-Based Chemicals as a Sustainable Feedstock Presents Opportunities for Market Growth
Algae-based chemicals are emerging as a promising sustainable feedstock, opening new avenues in the renewable chemicals market. Algae offer several advantages, including high productivity, carbon sequestration capabilities, and the ability to grow in non-arable land, reducing competition with food crops. Research and development efforts funded by governments, such as the U.S. Department of Energy's focus on algae-based projects in December 2024, are accelerating innovation in this space. Algae-derived biofuels, bio-lubricants, and bio-polymers are gaining attention from industries seeking to diversify feedstock options. The scalability and sustainability of algae-based chemicals position them as a key growth area in the renewable chemicals sector.
Renewable Chemicals Market Challenge:
-
Competition from Petrochemical Alternatives and Market Fragmentation Pose Challenges to the Growth of Renewable Chemicals
The renewable chemicals market faces stiff competition from well-established petrochemical products, which are often cheaper and readily available. Additionally, the market is highly fragmented, with numerous small and medium-sized players struggling to compete with larger companies that benefit from economies of scale. This fragmentation can result in inconsistent product quality and limited market penetration for smaller players. Efforts to bridge the price gap and enhance market consolidation are critical to overcoming these challenges. Moreover, increasing consumer awareness and supportive policies are gradually leveling the playing field, but the market still faces hurdles in gaining widespread acceptance compared to traditional chemicals.
Consumer Trends and Preferences in Renewable Chemicals Market
|
Consumer Trend |
Description |
|
Increased Demand for Eco-Friendly Products |
Consumers are increasingly seeking products that are sustainable, made from renewable resources. |
|
Preference for Biodegradable Products |
Growing consumer preference for biodegradable packaging, reducing plastic waste. |
|
Shift Towards Ethical and Transparent Brands |
Consumers are choosing brands that demonstrate transparency in sourcing and production. |
|
Higher Willingness to Pay for Sustainability |
Willingness to pay a premium for products that are certified eco-friendly or renewable. |
|
Interest in Circular Economy |
Consumers are embracing products made from recycled or upcycled renewable materials. |
Consumer demand for renewable chemicals is rapidly shifting towards sustainability-driven choices, with eco-conscious preferences becoming a key factor in purchasing decisions. This includes a rising preference for biodegradable products, such as bio-based plastics, which contribute to reducing plastic pollution. The trend also shows a higher willingness to pay for sustainable products, as consumers prioritize environmental impact over cost, especially when products are certified by eco-labels. Another critical shift is towards transparency and ethical practices, where consumers are favoring companies that ensure responsible sourcing and production. Moreover, there is a growing interest in the circular economy, with consumers actively seeking products made from recycled or upcycled materials, reflecting a broader commitment to sustainability across industries.
Renewable Chemicals Market Segments
By Product Type
In 2023, the Polymers segment dominated the Renewable Chemicals Market with a market share of 45%. Within this segment, Polylactic Acid (PLA) was the leading subsegment, accounting for approximately 35% of the polymers market. The increasing global emphasis on sustainability and the reduction of plastic waste has significantly driven the demand for renewable polymers. PLA, derived from renewable resources such as corn starch or sugarcane, is recognized for its biodegradability and compostability, making it a preferred choice for various applications, particularly in the food and beverage industry. The shift towards eco-friendly packaging solutions has further propelled PLA’s popularity, as it can effectively replace traditional petroleum-based plastics without compromising on performance. Notably, companies like NatureWorks LLC have been at the forefront of PLA production, expanding their facilities to meet the rising demand. Furthermore, as governments impose stricter regulations on plastic use and waste management, the adoption of PLA and other renewable polymers is expected to accelerate, reinforcing their dominance in the market. This trend illustrates a broader commitment to sustainability, positioning polymers as a cornerstone in the transition towards a circular economy.
By Feedstock
The Biomass feedstock dominated the Renewable Chemicals Market in 2023, holding a market share of 50%. Biomass encompasses a diverse range of organic materials, including agricultural residues, wood chips, and dedicated energy crops. Its dominance is largely attributed to the abundance and cost-effectiveness of biomass as a raw material for producing bio-based chemicals. The versatility of biomass allows for the generation of various renewable chemicals, such as bioethanol, bio-butanol, and bio-based plastics. Companies like Gevo Inc. leverage biomass to produce sustainable aviation fuels and chemicals, aligning their production processes with renewable feedstocks. The increasing focus on reducing carbon emissions and reliance on fossil fuels has led to greater investments in biomass conversion technologies, making it an attractive choice for manufacturers. Additionally, biomass contributes to waste reduction by utilizing materials that would otherwise be discarded, further enhancing its environmental appeal. As the renewable chemicals sector evolves, biomass will continue to play a crucial role in meeting the growing demand for sustainable products while supporting agricultural economies and reducing greenhouse gas emissions.
By End-Use
The Food and Beverages segment dominated the Renewable Chemicals Market in 2023 with a market share of 30%. This segment's prominence can be attributed to the increasing demand for sustainable packaging solutions that minimize environmental impact. Renewable chemicals, particularly bio-based plastics and biodegradable materials are becoming essential in food packaging applications. Companies such as BASF and NatureWorks LLC are investing in developing innovative materials that offer both performance and sustainability. The shift in consumer preferences towards eco-friendly products is driving food and beverage manufacturers to adopt renewable chemicals in their packaging processes. Additionally, stringent regulations aimed at reducing single-use plastics are prompting companies to seek alternative materials that comply with environmental standards. Renewable chemicals also enhance product shelf life and safety, making them ideal for food preservation. As consumers become more environmentally conscious, the demand for sustainable packaging solutions in the food and beverage sector is expected to grow, reinforcing the segment’s dominance in the renewable chemicals market and leading to continued innovation in bio-based materials.
Renewable Chemicals Market Regional Analysis
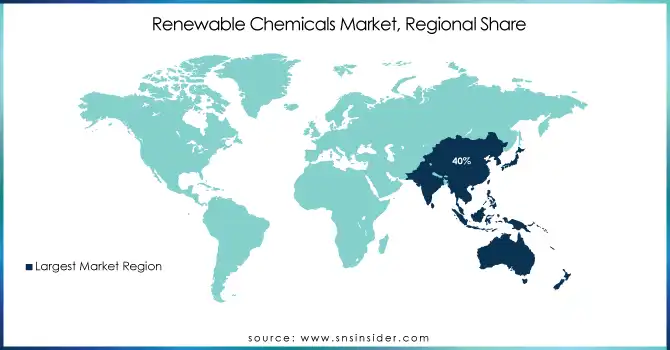
Asia Pacific Leads the Renewable Chemicals Market in 2023 with 40% Market Share Driven by Industrialization and Sustainability Trends
Asia Pacific dominated the Renewable Chemicals Market in 2023 with a market share of 40%. The region’s dominance is driven by rapid industrialization, increasing demand for eco-friendly products, and a strong shift towards sustainability, supported by both government regulations and consumer trends. Countries like China and India play a pivotal role in this growth, as they continue to invest in renewable chemical production technologies and increase the production of bio-based chemicals. China, in particular, is a global leader in the production of bio-based plastics, such as PLA, due to its large-scale manufacturing capabilities and government incentives promoting the use of renewable resources. Additionally, India's growing emphasis on renewable energy and chemicals, combined with its extensive agricultural base, has bolstered the biomass sector. Japan and South Korea have also emerged as key contributors, with companies like Mitsubishi Chemical Corporation and Toray Industries leading efforts in developing advanced renewable chemicals and bio-based materials. In Japan, increasing consumer demand for biodegradable products and sustainable packaging solutions has spurred the adoption of renewable chemicals, positioning the country as a leader in the region. With a large, diverse population and escalating environmental concerns, Asia Pacific is expected to continue leading the market, with increasing government support and industrial activity in renewable chemical production.
Get Customized Report as Per Your Business Requirement - Request For Customized Report
Key Players
-
Amyris, Inc. (Biofene, Farnesene-based derivatives)
-
Archer Daniels Midland Company (Bio-based propylene glycol, Ethanol)
-
BASF SE (Bio-based succinic acid, Polylactic acid)
-
Bioamber Inc. (Bio-succinic acid, 1,4-Butanediol)
-
Biomethanol Chemie Nederland B.V. (Bio-methanol, Bio-dimethyl ether)
-
Braskem S.A. (Green Polyethylene, Bio-based polypropylene)
-
Cargill, Incorporated (Bio-based polyols, Erythritol)
-
Corbion N.V. (Lactic acid, Polylactic acid (PLA))
-
DuPont de Nemours, Inc. (Cellulosic ethanol, Sorona polymer)
-
Elevance Renewable Sciences Inc. (Infinia chemicals, Renewable esters)
-
Evonik Industries AG (Bio-based polyamide 12, Amino acids)
-
Genomatica Inc. (Bio-BDO (1,4-Butanediol), Bio-based Nylon intermediates)
-
Gevo Inc. (Isobutanol, Renewable hydrocarbons)
-
Koninklijke DSM N.V. (Bio-based resins, Omega-3 fatty acids)
-
Mitsubishi Chemical Corporation (Bio-PBS (Polybutylene succinate), Bio-methacrylates)
-
Myriant Corporation (Bio-succinic acid, Bio-acrylic acid)
-
NatureWorks LLC (Polylactic acid (PLA), Bio-based lactides)
-
Novozymes A/S (Enzymes for bioethanol, Microbial solutions for biochemicals)
-
Solvay (Epicerol (bio-based epichlorohydrin), Renewable vanillin)
-
The Dow Chemical Company (Bio-based polyethylene, Polyurethane systems)
Recent Developments
-
January 2025: The U.S. Department of Energy allocated up to $23 million to support renewable chemicals and fuels development, aiming to boost sustainable alternatives and green technologies in the chemical industry.
-
April 2024: Neste and Lotte Chemical partnered to advance renewable chemicals and plastics, focusing on using renewable feedstocks to reduce plastic waste and fossil fuel reliance in the plastics sector.
-
June 2024: Trillium Renewable Chemicals selected Ineos Green Lake for the world’s first demonstration plant for sustainable acrylonitrile production, reducing the textile industry's environmental footprint.
-
October 2024: BASF and AM Green signed an agreement for 100,000 tons of green ammonia, supporting the production and use of low-carbon chemicals in industrial applications.
| Report Attributes | Details |
|---|---|
| Market Size in 2023 | US$ 128.3 Billion |
| Market Size by 2032 | US$ 337.8 Billion |
| CAGR | CAGR of 11.4% From 2024 to 2032 |
| Base Year | 2023 |
| Forecast Period | 2024-2032 |
| Historical Data | 2020-2022 |
| Report Scope & Coverage | Market Size, Segments Analysis, Competitive Landscape, Regional Analysis, DROC & SWOT Analysis, Forecast Outlook |
| Key Segments | •By Product Type (Alcohols [Ethanol, Methanol, Others], Organic Acids [Lactic Acid, Acetic Acid, Others], Polymers [Polylactic Acid, Bio-polyethylene, Others], Ketones, Others) •By Feedstock (Sugarcane, Biomass, Corn, Algae, Others) •By End-Use (Automotive, Medical, Food and Beverages, Petrochemicals, Textiles, Agriculture, Others) |
| Regional Analysis/Coverage | North America (US, Canada, Mexico), Europe (Eastern Europe [Poland, Romania, Hungary, Turkey, Rest of Eastern Europe] Western Europe] Germany, France, UK, Italy, Spain, Netherlands, Switzerland, Austria, Rest of Western Europe]), Asia Pacific (China, India, Japan, South Korea, Vietnam, Singapore, Australia, Rest of Asia Pacific), Middle East & Africa (Middle East [UAE, Egypt, Saudi Arabia, Qatar, Rest of Middle East], Africa [Nigeria, South Africa, Rest of Africa], Latin America (Brazil, Argentina, Colombia, Rest of Latin America) |
| Company Profiles | BASF SE, Dow Inc., Cargill, Incorporated,Archer Daniels Midland Company, DuPont de Nemours, Inc., Evonik Industries AG, Koninklijke DSM N.V., Braskem S.A., Corbion N.V., Amyris, Inc. and other key players |
| Key Drivers | •Rising Adoption of Circular Economy Initiatives Fuels Expansion in the Renewable Chemicals Market •Government Support and Incentives for Renewable Chemical Production Encourage Market Growth |
| Restraints | •High Production Costs and Limited Infrastructure Hinder the Large-Scale Adoption of Renewable Chemicals |
Frequently Asked Questions
Ans: Asia Pacific dominated the Renewable Chemicals Market in 2023 with a 40% share, driven by rapid industrialization, strong government support, and increasing demand for eco-friendly products, with key contributions from China, India, Japan, and South Korea.
Ans: The renewable chemicals market is challenged by competition from cheaper petrochemical alternatives and fragmentation among numerous small players, which affects product quality and market penetration.
Ans: The renewable chemicals market is expanding due to bio-based plastics in packaging, algae-based feedstocks, and rising demand in emerging markets, with key players like NatureWorks, BASF, and Neste driving growth.
Ans: The Renewable Chemicals Market size was valued at USD 128.3 billion in 2023 and is expected to reach USD 337.8 billion by 2032.
Ans: The Renewable Chemicals Market is expected to grow at a CAGR of 11.4% from 2024 to 2032.
Get in Touch
