Green Data Center Market Size & Overview:

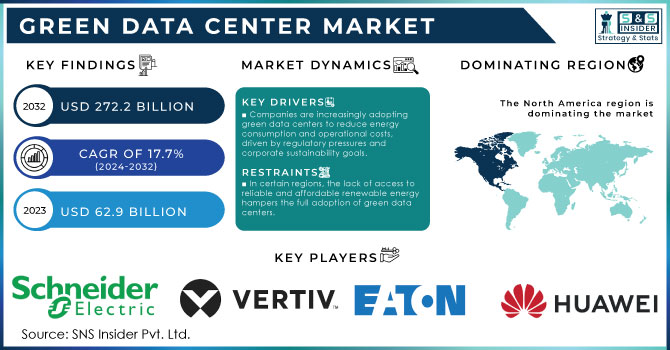
Green Data Center Market size was valued at USD 74.03 billion in 2024 and is expected to reach USD 272.67 billion by 2032 and grow at a CAGR of 17.7% over the forecast period of 2025-2032. 

The growth of the green data center market is driven by the increasing government focus on sustainability and energy efficiency. Governments across the globe are implementing strict regulations and providing incentives to encourage the adoption of energy-efficient technologies. As an example, the U.S. Environmental Protection Agency (EPA) revealed that 2% of total U.S. electricity use is attributed to data centers. In response, federal and state governments have implemented energy efficiency programs like the Data Center Optimization Initiative (DCOI) and Energy Star certification for data centers. Further, the European Union has launched initiatives such as the EU Code of Conduct for Data Centres which focuses on minimizing reported power consumption in data centers through adopting energy-saving practices.

Green-Data-Center-Market Revenue Analysis

To Get More Information on Green Data Center Market - Request Sample Report

According to a report by the International Energy Agency (IEA), global data center energy demand is expected to increase by 4% annually from 2023 to 2030. The IEA has also noted that renewable energy sources are increasingly part of data center operations, with numerous governments requiring new data centers to comply with strict environmental codes. As an example, in 2023, the U.K. government made a target to have all data centers net-zero carbon by 2030 which pushed this market shift towards green infrastructure. Such government policies and the shutdown of carbon emissions will further amplify the demand for green data centers.

Market Size and Forecast:

  • Market Size in 2024 – USD 74.03 billion

  • Market Size by 2032 – USD 272.67 billion

  • CAGR (2025–2032) – 17.7%

  • Base Year – 2024

  • Forecast Period – 2025–2032

  • Historical Data – 2021–2023

Green Data Center Market Key Trends:

  • AI-powered data centers may consume as much electricity by 2030 as 2 million households, doubling current global data center energy use.

  • Surging power costs, especially in northern Virginia, are driving adoption of solar and wind energy for new data centers.

  • Projects like Data City, Texas plan 5 GW of energy and 15 million sq. ft. of leasable space, aiming for green-powered operations.

  • Companies like Google saw 22% increase in Scope 3 emissions in 2024 due to rising electricity consumption.

  • High electricity demand in regions like PJM network has hit price caps, highlighting the need for enhanced power infrastructure.

  • Deployment of advanced cooling systems and energy management solutions is increasing to reduce operational costs.

  • Growing regulatory and consumer pressure is pushing companies to meet green and low-carbon standards.

Green Data Center Market Drivers:

  • Companies are increasingly adopting green data centers to reduce energy consumption and operational costs, driven by regulatory pressures and corporate sustainability goals.

  • Governments worldwide are implementing stringent regulations to reduce carbon emissions, alongside offering incentives and subsidies for adopting eco-friendly practices, spurring demand for green data centers.

  • The massive expansion of cloud computing, big data, and IoT requires scalable and sustainable data management solutions, leading companies to prioritize energy-efficient data centers.

Increased demand for energy-efficient infrastructure is one of the main reasons fuelling growth in the green data center market. According to the International Energy Agency (IEA), data centers are responsible for an estimated 1% of total electricity use worldwide–putting organizations between a rock and a hard place when it comes to reducing their carbon footprint. As data centers develop into a most worrying stage they reduce the operations costs whilst supporting sustainability goals. For example, the Uptime Institute says that around 40% of power consumed by data centers is from cooling systems. This has led to investments in energy-efficient cooling technologies such as Google, which utilizes AI-powered cooling in its data centers to mitigate the issue. The company was able to reduce energy use for cooling by 30% with this system which illustrates the balance of costs and environmental benefits.

Additionally, companies are shifting to renewable energy sources to power their data centers. Corporate Demand for Clean Energy reached 36.7 Gigawatts in 2022, with tech giants such as Amazon, Microsoft, and Facebook leading the charge in green energy investments. For example, Amazon Web Services (AWS) is on track to achieve 100% renewable energy usage by 2025, significantly contributing to adopting energy-efficient, green data centers. Environmental responsibility certainly plays an important role in it; however, the consistency of operational savings makes this trend stronger for the adoption of green data center technologies.

Green Data Center Market Restraints:

  • Despite long-term savings, the significant upfront costs associated with building green data centers, including renewable energy infrastructure and advanced cooling systems, remain a barrier for smaller companies.

  • Upgrading conventional data centers to green standards can be complex and costly, discouraging organizations from making the transition.

  • In certain regions, the lack of access to reliable and affordable renewable energy hampers the full adoption of green data centers.

The high capital expenses involved in constructing and migrating to energy-efficient facilities remain a major constraint in the green data center market. Green data centers may save on expenses in the longer term due to more energy-efficient practices and operational efficiencies, but there are huge upfront costs associated with the installation of eco-friendly infrastructure. This comprises investment in renewable energy like solar panels, energy-efficient cooling solutions, and power management technology such as advanced tools. Smaller organizations, or those with tighter budgets, may find these initial expenses prohibitive, making it challenging to justify the investment despite potential future savings. Then again, it’s not limited to new construction can also be costly and complicated to retrofit existing data centers for green standards. The need for specialized technologies and equipment creates financial barriers, especially for companies that lack the resources to make such significant upfront commitments, slowing down the widespread adoption of sustainable data center solutions.

Green Data Center Market Segmentat Analysis:
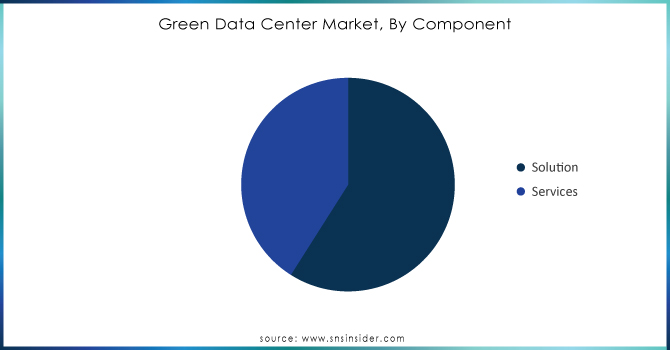
By Component

Based on components, the solution segment led the market and accounted 65% of revenue share in 2024. The growing demand for advanced solutions including cooling systems, power management solutions, and energy-efficient hardware. Cooling systems represent almost 40% of a data center's energy usage, according to the U.S. Department of Energy (DOE). Thus, organizations are shifting their focus towards adopting solutions such as liquid cooling and AI-driven energy management systems to maximize the use of energy.

Moreover, governments are introducing regulations that promote energy-efficient solutions. For Example, the European Commission, launched the European Green Deal to promote the implementation of greenhouse gas emission mitigation measures that affect sectors like data centers. By enforcing these regulations, it requires industries to make expenditures on solutions to comply with energy efficiency standards, thus driving the revenue growth of the solution segment.

Green Data Center Market, By Component

Do You Need any Customization Research on Green Data Center Market - Enquire Now

By Enterprise Size

In 2024 the large enterprise accounted highest revenue with a market share of 71%. Corporates, especially in IT, telecoms & finance, have a lot of data to store and process. According to a report by the U.S. Federal Energy Regulatory Commission (FERC), large enterprises tend to invest heavily in infrastructure to ensure sustainability and conformity with environmental regulations.

Large corporations are also more likely to invest in sustainable infrastructure, as the pressures for environmental effects are better. Mandatory ESG disclosures for large corporations surrounding the European Union's Corporate Sustainability Reporting Directive (CSRD) beginning 2023 have heightened focus on green technologies.

By End-Use

The BFSI segment accounted for 23% of the revenue in the green data center market in 2024. This growth is driven by the BFSI sector's need to store huge volumes of sensitive data in secure and energy-efficient solutions. A report by the U.S. Federal Reserve states that the rising use of green data centers by financial institutions that are actively engaging in cost-effective measures to minimize operational costs while adhering strictly to the certain regulatory standards for energy usage.

On the other hand, the IT and telecom segment is expected to grow at a significant compound annual growth rate during the forecast period. In a 2023 report of U.S. Federal Communications Commission, the need for data from the telecom sector is estimated to rise at around 10% annually. Rapid digitalization, heightened use of 5G technology, and increasing dependency on cloud service are essentially pushing the need for more green data centers around the world that offer energy-efficient and scalable infrastructure.

Green Data Center Market Regional Analysis:

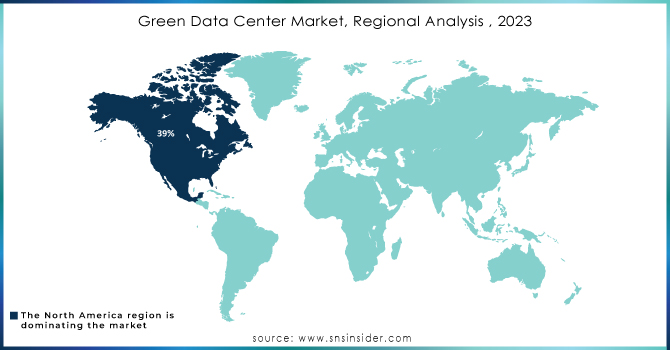
North America Green Data Center Market Insights

In 2024, North America dominated the green data center market, holding a 39% market share. The U.S. leads the region due to its advanced technology infrastructure, strong government regulations, and initiatives promoting energy efficiency. Programs like the Data Center Optimization Initiative (DCOI) aim to reduce energy consumption by improving operations of existing data centers and implementing energy-efficient technologies. The presence of major data center operators such as Google, Amazon, and Microsoft further boosts market growth. The region is expected to maintain steady growth, driven by continued adoption of renewable energy and sustainable data center practices during 2025–2032.

Asia-Pacific Green Data Center Market Insights

The Asia-Pacific region is projected to grow at a significant CAGR during 2025–2032. Growth is fueled by government policies and large-scale projects. China plans to build over 100 green data centers by 2025 to meet its carbon neutrality targets. Similarly, India introduced the National Green Data Center Policy in 2023, offering incentives for operators to adopt renewable energy and energy-efficient technologies. Rising digitalization, cloud adoption, and government-backed initiatives are driving rapid market expansion, making Asia-Pacific one of the fastest-growing regions in the green data center segment.

Europe Green Data Center Market Insights

Europe holds a moderate market share of approximately 25% in 2024. Growth is driven by stringent EU regulations on energy efficiency and carbon reduction, including the EU Code of Conduct for Data Centers. Countries like Germany, France, and the UK are investing heavily in green infrastructure and renewable energy-powered data centers. Rising demand for cloud computing and AI services further accelerates market adoption, with Europe expected to grow at a CAGR of around 14–15% during 2025–2032.

Rest of the World (RoW) Green Data Center Market Insights

The Rest of the World, including the Middle East, Africa, and Latin America, accounts for roughly 10–12% of the global market in 2024. Market growth is supported by urbanization, expanding IT infrastructure, and increasing adoption of cloud services. Countries such as UAE, Saudi Arabia, South Africa, and Brazil are investing in energy-efficient data centers to meet sustainability goals. The region is projected to expand at a CAGR of 13–14% through 2032, driven by government incentives and rising digital infrastructure demand.

Green-Data-Center-Market-Regional-Analysis--2023

Green Data Center Market Key Players:

Key Service Providers/Manufacturers:

  • Schneider Electric (EcoStruxure IT, Galaxy VM)

  • Vertiv Group Corp.  (Liebert EXL S1, Trellis)

  • Eaton Corporation (Power Xpert, 93PM UPS)

  • Huawei Technologies Co., Ltd. (FusionModule2000, SmartLi UPS)

  • IBM Corporation (IBM Cloud Paks, Energy Efficiency Solutions)

  • Rittal GmbH & Co. KG (LCP DX Cooling, RiMatrix S)

  • Siemens AG (BlueVault Energy Storage, Desigo CC)

  • Delta Electronics, Inc. (InfraSuite Datacenter Solution, Modulon DPH UPS)

  • Cisco Systems, Inc. (Cisco Nexus Switches, UCS Power Manager)

  • Hewlett Packard Enterprise (HPE Synergy, HPE Aruba GreenLake)

  • ABB Ltd. (ABB Ability Data Center Automation, UPS Solutions)

  • Fujitsu Ltd. (PRIMERGY Servers, ETERNUS Storage)

  • Lenovo Group Ltd. (ThinkSystem Servers, ThinkAgile)

  • NTT Ltd. (Global Data Center Solutions, Managed Services)

  • STULZ GmbH (CyberAir Cooling, Compact Cooling Systems)

  • Mitsubishi Electric Corporation (Data Center UPS, Energy Management Systems)

  • APC by Schneider Electric (Smart-UPS, NetBotz)

  • Inspur Group Co., Ltd. (Inspur Servers, Data Center Solutions)

  • NetApp, Inc. (AFF Storage, ONTAP AI)

  • Oracle Corporation (Oracle Cloud Infrastructure, Exadata Cloud Service)

Key Users of Green Data Center Services and Products:

  • Amazon Web Services (AWS)

  • Google LLC

  • Microsoft Corporation

  • Facebook, Inc.

  • Apple Inc.

  • Alibaba Group

  • Tencent Holdings Ltd.

  • IBM Corporation

  • Salesforce, Inc.

  • Bank of America Corporation

Green Data Center Market Competitive Landscape:

Microsoft Corporation is a U.S.-based multinational technology company headquartered in Redmond, Washington. Founded in 1975 by Bill Gates and Paul Allen, Microsoft is a global leader in software, cloud computing, hardware, and AI solutions. Its flagship products include the Windows operating system, Office productivity suite, Azure cloud platform, and Surface devices. Microsoft is also a key player in data center operations, with a strong focus on sustainability and energy-efficient infrastructure. Operating in over 190 countries, the company employs more than 220,000 people worldwide. Microsoft continues to drive innovation in cloud computing, AI, and green technology.

  • In Apr 2024: Microsoft announced expansion of its green data center infrastructure in the U.S. and goal to reach 100% renewable energy by 2025 This is well aligned with its overall company vision of turning carbon negative by 2030.

Google LLC is a U.S.-based multinational technology company headquartered in Mountain View, California. Founded in 1998 by Larry Page and Sergey Brin, Google is globally recognized for its search engine, cloud computing services, AI solutions, and advertising technologies. The company operates one of the world’s largest data center networks, emphasizing energy efficiency and sustainability in its operations. Google also develops products such as Google Cloud, Gmail, Google Workspace, and Android OS. With operations in over 100 countries and a workforce exceeding 190,000 employees, Google continues to innovate in digital services, AI technologies, and green data center infrastructure.

  • In August 2024: Google announced its partnership with the Government of India to develop new green data centers in prime metropolitan sectors. It is a significant initiative under India's National Green Data Center Policy, focusing on maximizing energy efficiency and fortifying the country in its quest towards achieving digital transformation objectives.

Sonic Edge Ltd. is a UK-based provider of modular and micro data centers, specializing in high-performance computing (HPC) and edge applications. Founded in 2021, the company offers scalable solutions ranging from 50kW to over 100kW, designed for rapid deployment and energy efficiency. Sonic Edge emphasizes sustainability through partnerships with cooling specialists like Iceotope and Deep Green Technologies, integrating immersion cooling and renewable energy sources to reduce power consumption and carbon emissions. Their modular designs ensure swift deployment, with an average lead time of approximately 16 weeks, catering to industries requiring low-latency and high-density computing resources.

  • In May 2023, U.K.-based modular data center company Sonic Edge partnered with Deep Green to reduce electricity costs using immersion cooling solutions, and announced plans for the rollout of a total of 50 new Sonic Edge HPC/EdgePods across the United Kingdom by 2024.

Micro Hub is a Dubai-based provider of green data center solutions, specializing in sustainable, solar-powered infrastructure for edge computing and high-performance applications. In collaboration with technology leaders such as Dell Technologies, Microsoft, Huawei, and VMware, Micro Hub launched a fully renewable energy-powered data center in Dubai. This facility integrates cutting-edge technologies, including Internet of Things (IoT) capabilities, digital twin modeling, cybersecurity measures, and Artificial Intelligence (AI) to optimize operations and enhance energy efficiency. By leveraging these innovations, Micro Hub aims to deliver scalable, low-latency computing resources while minimizing environmental impact, aligning with global sustainability goals.

  • On 22nd February 2023, Micro Hub opened a solar-powered data center in Dubai, utilizing 100% renewable energy in collaboration with Dell Technologies, Microsoft, Huawei, and VMWare. The facility integrates cutting-edge technologies like IoT, digital twins, cybersecurity, and AI.

Green Data Center Market Report Scope:

Report Attributes Details
Market Size in 2024  USD 74.03 billion
Market Size by 2032  USD 272.67 billion
CAGR   CAGR of 17.7% From 2025 to 2032
Base Year  2024
Forecast Period  2025-2032
Historical Data  2021-2023
Report Scope & Coverage Market Size, Segments Analysis, Competitive  Landscape, Regional Analysis, DROC & SWOT Analysis, Forecast Outlook
Key Segments • by Component (Solution, Services)
• by Enterprise Size (Large Enterprises, Small and Medium-sized Enterprises)
• by Industry Vertical (BFSI, IT, Telecom, Media, Entertainment, Healthcare, Government & Defene, Retail, Manufacturing, Others)
Regional Analysis/Coverage North America (US, Canada), Europe (Germany, UK, France, Italy, Spain, Russia, Poland, Rest of Europe), Asia Pacific (China, India, Japan, South Korea, Australia, ASEAN Countries, Rest of Asia Pacific), Middle East & Africa (UAE, Saudi Arabia, Qatar, South Africa, Rest of Middle East & Africa), Latin America (Brazil, Argentina, Mexico, Colombia, Rest of Latin America).
Company Profiles Schneider Electric, Vertiv Group Corp., Eaton Corporation, Huawei Technologies Co., Ltd., IBM Corporation, Rittal GmbH & Co. KG, Siemens AG, Delta Electronics, Inc., Cisco Systems, Inc., Hewlett Packard Enterprise, ABB Ltd., Fujitsu Ltd., Lenovo Group Ltd., NTT Ltd., STULZ GmbH, Mitsubishi Electric Corporation, APC by Schneider Electric, Inspur Group Co., Ltd., NetApp, Inc., Oracle Corporation


Table Of Contents

1. Introduction

1.1 Market Definition & Scope

 1.2 Research Assumptions & Abbreviations

 1.3 Research Methodology

2. Executive Summary

2.1 Market Snapshot

 2.2 Market Absolute $ Opportunity Assessment & Y-o-Y Analysis, 2021–2032

 2.3 Market Size & Forecast, By Segmentation, 2021–2032

  2.3.1 Market Size By Component

  2.3.2 Market Size By Enterprise Size

  2.3.3 Market Size By End-Use

 2.4 Market Share & Bps Analysis By Region, 2024

 2.5 Industry Growth Scenarios – Conservative, Likely & Optimistic

 2.6 Industry CxO’s Perspective

3. Market Overview

3.1 Market Dynamics

  3.1.1 Drivers

  3.1.2 Restraints

  3.1.3 Opportunities

  3.1.4 Key Market Trends

 3.2 Industry PESTLE Analysis

 3.3 Key Industry Forces (Porter’s) Impacting Market Growth

 3.4 Industry Supply Chain Analysis

  3.4.1 Raw Material Suppliers

  3.4.2 Manufacturers

  3.4.3 Distributors/Suppliers

  3.4.4 Customers/End-Users

 3.5 Industry Life Cycle Assessment

 3.6 Parent Market Overview

 3.7 Market Risk Assessment

4. Statistical Insights & Trends Reporting

4.1 Energy Efficiency & Performance Metrics

 4.1.1 Power Usage Effectiveness (PUE) Comparison Across Regions

 4.1.2 Energy Consumption Reduction (%) vs. Traditional Data Centers

 4.1.3 Adoption Rate of Renewable Energy Sources (Solar, Wind, Hydro)

 4.1.4 Energy Cost Savings per Data Center

4.2 Cooling & Thermal Management Metrics

 4.2.1 Adoption Rate of Efficient Cooling Technologies (Liquid Cooling, Free Cooling, Immersion Cooling)

 4.2.2 Cooling Energy Consumption (%) Relative to Total Energy Use

 4.2.3 Regional Trends in Cooling Technology Adoption

 4.2.4 Impact on Overall Data Center Efficiency

4.5 IT Infrastructure & Hardware Metrics

 4.5.1 Adoption Rate of Energy-efficient Servers and Storage Solutions

 4.5.2 Market Share by Virtualization & Cloud Optimization Technologies

 4.5.3 Hardware Refresh Cycle and Energy Savings Metrics

 4.5.4 Server Utilization Rate and Load Optimization Statistics

5. Green Data Center Market Segmental Analysis & Forecast, By Component, 2021 – 2032, Value (USD Billion)

5.1 Introduction

 5.2 Solution

  5.2.1 Key Trends

  5.2.2 Market Size & Forecast, 2021 – 2032

5.2.3 Monitoring & Management System

5.2.4 Cooling System

5.2.5 Networking System

5.2.6Power Systems

5.2.7Others

5.3 Services

      5.3.1 Installation & Deployment

      5.3.2 Consulting

     5.3.3 Support & Maintenance    

6. Green Data Center Market Segmental Analysis & Forecast, By Enterprise Size, 2021 – 2032, Value (USD Billion)

    6.1 Introduction

 6.2 Large Enterprises

  6.2.1 Key Trends

  6.2.2 Market Size & Forecast, 2021 – 2032

 6.3 Small & Medium Enterprises (SMEs)

7. Green Data Center Market Segmental Analysis & Forecast, By End-Use, 2021 – 2032, Value (USD Billion)

    7.1 Introduction

 7.2 BFSI

  7.2.1 Key Trends

  7.2.2 Market Size & Forecast, 2021 – 2032

 7.3 Retail

     7.4 IT & Telecom

     7.5 Healthcare

     7.6 Manufacturing

     7.7 Government & Defence

   7.8 Others

8. Green Data Center Market Segmental Analysis & Forecast By Region, 2021 – 2032, Value (USD Billion)

8.1 Introduction

8.2 North America

 8.2.1 Key Trends

 8.2.2 Green Data Center Market Size & Forecast, By Component, 2021 – 2032

 8.2.3 Green Data Center Market Size & Forecast, By Enterprise Size, 2021 – 2032

 8.2.4 Green Data Center Market Size & Forecast, By End-Use, 2021 – 2032

 8.2.5 Green Data Center Market Size & Forecast, By Country, 2021 – 2032

  8.2.5.1 USA

   8.2.5.1.1 Green Data Center Market Size & Forecast, By Component, 2021 – 2032

   8.2.5.1.2 Green Data Center Market Size & Forecast, By Enterprise Size, 2021 – 2032

   8.2.5.1.3 Green Data Center Market Size & Forecast, By End-Use, 2021 – 2032

  8.2.5.2 Canada

   8.2.5.2.1 Green Data Center Market Size & Forecast, By Component, 2021 – 2032

   8.2.5.2.2 Green Data Center Market Size & Forecast, By Enterprise Size, 2021 – 2032

   8.2.5.2.3 Green Data Center Market Size & Forecast, By End-Use, 2021 – 2032

8.3 Europe

 8.3.1 Key Trends

 8.3.2 Green Data Center Market Size & Forecast, By Component, 2021 – 2032

 8.3.3 Green Data Center Market Size & Forecast, By Enterprise Size, 2021 – 2032

 8.3.4 Green Data Center Market Size & Forecast, By End-Use, 2021 – 2032

 8.3.5 Green Data Center Market Size & Forecast, By Country, 2021 – 2032

  8.3.5.1 Germany

   8.3.5.1.1 Green Data Center Market Size & Forecast, By Component, 2021 – 2032

   8.3.5.1.2 Green Data Center Market Size & Forecast, By Enterprise Size, 2021 – 2032

   8.3.5.1.3 Green Data Center Market Size & Forecast, By End-Use, 2021 – 2032

  8.3.5.2 UK

   8.3.5.2.1 Green Data Center Market Size & Forecast, By Component, 2021 – 2032

   8.3.5.2.2 Green Data Center Market Size & Forecast, By Enterprise Size, 2021 – 2032

   8.3.5.2.3 Green Data Center Market Size & Forecast, By End-Use, 2021 – 2032

  8.3.5.3 France

   8.3.5.3.1 Green Data Center Market Size & Forecast, By Component, 2021 – 2032

   8.3.5.3.2 Green Data Center Market Size & Forecast, By Enterprise Size, 2021 – 2032

   8.3.5.3.3 Green Data Center Market Size & Forecast, By End-Use, 2021 – 2032

  8.3.5.4 Italy

   8.3.5.4.1 Green Data Center Market Size & Forecast, By Component, 2021 – 2032

   8.3.5.4.2 Green Data Center Market Size & Forecast, By Enterprise Size, 2021 – 2032

   8.3.5.4.3 Green Data Center Market Size & Forecast, By End-Use, 2021 – 2032

  8.3.5.5 Spain

   8.3.5.5.1 Green Data Center Market Size & Forecast, By Component, 2021 – 2032

   8.3.5.5.2 Green Data Center Market Size & Forecast, By Enterprise Size, 2021 – 2032

   8.3.5.5.3 Green Data Center Market Size & Forecast, By End-Use, 2021 – 2032

  8.3.5.6 Russia

   8.3.5.6.1 Green Data Center Market Size & Forecast, By Component, 2021 – 2032

   8.3.5.6.2 Green Data Center Market Size & Forecast, By Enterprise Size, 2021 – 2032

   8.3.5.6.3 Green Data Center Market Size & Forecast, By End-Use, 2021 – 2032

  8.3.5.7 Poland

   8.3.5.7.1 Green Data Center Market Size & Forecast, By Component, 2021 – 2032

   8.3.5.7.2 Green Data Center Market Size & Forecast, By Enterprise Size, 2021 – 2032

   8.3.5.7.3 Green Data Center Market Size & Forecast, By End-Use, 2021 – 2032

  8.3.5.8 Rest of Europe

   8.3.5.8.1 Green Data Center Market Size & Forecast, By Component, 2021 – 2032

   8.3.5.8.2 Green Data Center Market Size & Forecast, By Enterprise Size, 2021 – 2032

   8.3.5.8.3 Green Data Center Market Size & Forecast, By End-Use, 2021 – 2032

8.4 Asia-Pacific

 8.4.1 Key Trends

 8.4.2 Green Data Center Market Size & Forecast, By Component, 2021 – 2032

 8.4.3 Green Data Center Market Size & Forecast, By Enterprise Size, 2021 – 2032

 8.4.4 Green Data Center Market Size & Forecast, By End-Use, 2021 – 2032

 8.4.5 Green Data Center Market Size & Forecast, By Country, 2021 – 2032

  8.4.5.1 China

   8.4.5.1.1 Green Data Center Market Size & Forecast, By Component, 2021 – 2032

   8.4.5.1.2 Green Data Center Market Size & Forecast, By Enterprise Size, 2021 – 2032

   8.4.5.1.3 Green Data Center Market Size & Forecast, By End-Use, 2021 – 2032

  8.4.5.2 India

   8.4.5.2.1 Green Data Center Market Size & Forecast, By Component, 2021 – 2032

   8.4.5.2.2 Green Data Center Market Size & Forecast, By Enterprise Size, 2021 – 2032

   8.4.5.2.3 Green Data Center Market Size & Forecast, By End-Use, 2021 – 2032

  8.4.5.3 Japan

   8.4.5.3.1 Green Data Center Market Size & Forecast, By Component, 2021 – 2032

   8.4.5.3.2 Green Data Center Market Size & Forecast, By Enterprise Size, 2021 – 2032

   8.4.5.3.3 Green Data Center Market Size & Forecast, By End-Use, 2021 – 2032

  8.4.5.4 South Korea

   8.4.5.4.1 Green Data Center Market Size & Forecast, By Component, 2021 – 2032

   8.4.5.4.2 Green Data Center Market Size & Forecast, By Enterprise Size, 2021 – 2032

   8.4.5.4.3 Green Data Center Market Size & Forecast, By End-Use, 2021 – 2032

  8.4.5.5 Australia

   8.4.5.5.1 Green Data Center Market Size & Forecast, By Component, 2021 – 2032

   8.4.5.5.2 Green Data Center Market Size & Forecast, By Enterprise Size, 2021 – 2032

   8.4.5.5.3 Green Data Center Market Size & Forecast, By End-Use, 2021 – 2032

  8.4.5.6 ASEAN Countries

   8.4.5.6.1 Green Data Center Market Size & Forecast, By Component, 2021 – 2032

   8.4.5.6.2 Green Data Center Market Size & Forecast, By Enterprise Size, 2021 – 2032

   8.4.5.6.3 Green Data Center Market Size & Forecast, By End-Use, 2021 – 2032

  8.4.5.7 Rest of Asia-Pacific

   8.4.5.7.1 Green Data Center Market Size & Forecast, By Component, 2021 – 2032

   8.4.5.7.2 Green Data Center Market Size & Forecast, By Enterprise Size, 2021 – 2032

   8.4.5.7.3 Green Data Center Market Size & Forecast, By End-Use, 2021 – 2032

8.5 Latin America

 8.5.1 Key Trends

 8.5.2 Green Data Center Market Size & Forecast, By Component, 2021 – 2032

 8.5.3 Green Data Center Market Size & Forecast, By Enterprise Size, 2021 – 2032

 8.5.4 Green Data Center Market Size & Forecast, By End-Use, 2021 – 2032

 8.5.5 Green Data Center Market Size & Forecast, By Country, 2021 – 2032

  8.5.5.1 Brazil

   8.5.5.1.1 Green Data Center Market Size & Forecast, By Component, 2021 – 2032

   8.5.5.1.2 Green Data Center Market Size & Forecast, By Enterprise Size, 2021 – 2032

   8.5.5.1.3 Green Data Center Market Size & Forecast, By End-Use, 2021 – 2032

  8.5.5.2 Argentina

   8.5.5.2.1 Green Data Center Market Size & Forecast, By Component, 2021 – 2032

   8.5.5.2.2 Green Data Center Market Size & Forecast, By Enterprise Size, 2021 – 2032

   8.5.5.2.3 Green Data Center Market Size & Forecast, By End-Use, 2021 – 2032

  8.5.5.3 Mexico

   8.5.5.3.1 Green Data Center Market Size & Forecast, By Component, 2021 – 2032

   8.5.5.3.2 Green Data Center Market Size & Forecast, By Enterprise Size, 2021 – 2032

   8.5.5.3.3 Green Data Center Market Size & Forecast, By End-Use, 2021 – 2032

  8.5.5.4 Colombia

   8.5.5.4.1 Green Data Center Market Size & Forecast, By Component, 2021 – 2032

   8.5.5.4.2 Green Data Center Market Size & Forecast, By Enterprise Size, 2021 – 2032

   8.5.5.4.3 Green Data Center Market Size & Forecast, By End-Use, 2021 – 2032

  8.5.5.5 Rest of Latin America

   8.5.5.5.1 Green Data Center Market Size & Forecast, By Component, 2021 – 2032

   8.5.5.5.2 Green Data Center Market Size & Forecast, By Enterprise Size, 2021 – 2032

   8.5.5.5.3 Green Data Center Market Size & Forecast, By End-Use, 2021 – 2032

8.6 Middle East & Africa

 8.6.1 Key Trends

 8.6.2 Green Data Center Market Size & Forecast, By Component, 2021 – 2032

 8.6.3 Green Data Center Market Size & Forecast, By Enterprise Size, 2021 – 2032

 8.6.4 Green Data Center Market Size & Forecast, By End-Use, 2021 – 2032

 8.6.5 Green Data Center Market Size & Forecast, By Country, 2021 – 2032

  8.6.5.1 UAE

   8.6.5.1.1 Green Data Center Market Size & Forecast, By Component, 2021 – 2032

   8.6.5.1.2 Green Data Center Market Size & Forecast, By Enterprise Size, 2021 – 2032

   8.6.5.1.3 Green Data Center Market Size & Forecast, By End-Use, 2021 – 2032

  8.6.5.2 Saudi Arabia

   8.6.5.2.1 Green Data Center Market Size & Forecast, By Component, 2021 – 2032

   8.6.5.2.2 Green Data Center Market Size & Forecast, By Enterprise Size, 2021 – 2032

   8.6.5.2.3 Green Data Center Market Size & Forecast, By End-Use, 2021 – 2032

  8.6.5.3 Qatar

   8.6.5.3.1 Green Data Center Market Size & Forecast, By Component, 2021 – 2032

   8.6.5.3.2 Green Data Center Market Size & Forecast, By Enterprise Size, 2021 – 2032

   8.6.5.3.3 Green Data Center Market Size & Forecast, By End-Use, 2021 – 2032

  8.6.5.4 Egypt

   8.6.5.4.1 Green Data Center Market Size & Forecast, By Component, 2021 – 2032

   8.6.5.4.2 Green Data Center Market Size & Forecast, By Enterprise Size, 2021 – 2032

   8.6.5.4.3 Green Data Center Market Size & Forecast, By End-Use, 2021 – 2032

  8.6.5.5 South Africa

   8.6.5.5.1 Green Data Center Market Size & Forecast, By Component, 2021 – 2032

   8.6.5.5.2 Green Data Center Market Size & Forecast, By Enterprise Size, 2021 – 2032

   8.6.5.5.3 Green Data Center Market Size & Forecast, By End-Use, 2021 – 2032

  8.6.5.6 Rest of Middle East & Africa

   8.6.5.6.1 Green Data Center Market Size & Forecast, By Component, 2021 – 2032

   8.6.5.6.2 Green Data Center Market Size & Forecast, By Enterprise Size, 2021 – 2032

   8.6.5.6.3 Green Data Center Market Size & Forecast, By End-Use, 2021 – 2032

9. Competitive Landscape

 9.1 Key Players' Positioning

 9.2 Competitive Developments

  9.2.1 Key Strategies Adopted (%), By Key Players, 2024

  9.2.2 Year-Wise Strategies & Development, 2021 – 2032

  9.2.3 Number Of Strategies Adopted By Key Players, 2024

 9.3 Market Share Analysis, 2024

 9.4 Product/Service & Application Benchmarking

  9.4.1 Product/Service Specifications & Features By Key Players

  9.4.2 Product/Service Heatmap By Key Players

  9.4.3 Application Heatmap By Key Players

 9.5 Industry Start-Up & Innovation Landscape

9.6 Key Company Profiles

 9.6.1 Schneider Electric

  9.6.1.1 Company Overview & Snapshot

  9.6.1.2 Product/Service Portfolio

  9.6.1.3 Key Company Financials

  9.6.1.4 SWOT Analysis

9.6.2 Vertiv Group Corp.

9.6.3 Eaton Corporation

9.6.4 Huawei Technologies Co., Ltd.

9.6.5 IBM Corporation

9.6.6 Rittal GmbH & Co. KG

9.6.7 Siemens AG

9.6.8 Delta Electronics, Inc.

9.6.9 Cisco Systems, Inc.

9.6.10 Hewlett Packard Enterprise

9.6.11 ABB Ltd.

9.6.12 Fujitsu Ltd.

9.6.13 Lenovo Group Ltd.

9.6.14 NTT Ltd.

9.6.15 STULZ GmbH

9.6.16 Mitsubishi Electric Corporation

9.6.17 APC by Schneider Electric

9.6.18 Inspur Group Co., Ltd.

9.6.19 NetApp, Inc.

9.6.20 Oracle Corporation

10. Analyst Recommendations

 10.1 SNS Insider Opportunity Map

 10.2 Industry Low-Hanging Fruit Assessment

 10.3 Market Entry & Growth Strategy

 10.4 Analyst Viewpoint & Suggestions On Market Growth

11. Assumptions

12. Disclaimer

13. Appendix

 13.1 List Of Tables

 13.2 List Of Figures

Key Segments:

By Component

  • Solution

    • Monitoring & Management System

    • Cooling System

    • Networking System

    • Power Systems

    • Others

  • Services

    • Installation & Deployment

    • Consulting

    • Support & Maintenance

By Enterprise Size

  • Large Enterprises

  • Small & Medium Enterprises (SMEs)

By End-use

  • BFSI

  • Retail

  • IT & Telecom

  • Healthcare

  • Manufacturing

  • Government & Defence

  • Others

Request for Segment Customization as per your Business Requirement: Segment Customization Request

REGIONAL COVERAGE:

North America

  • US

  • Canada

  • Mexico

Europe

  • Eastern Europe

    • Poland

    • Romania

    • Hungary

    • Turkey

    • Rest of Eastern Europe

  • Western Europe

    • Germany

    • France

    • UK

    • Italy

    • Spain

    • Netherlands

    • Switzerland

    • Austria

    • Rest of Western Europe

Asia Pacific

  • China

  • India

  • Japan

  • South Korea

  • Vietnam

  • Singapore

  • Australia

  • Rest of Asia Pacific

Middle East & Africa

  • Middle East

    • UAE

    • Egypt

    • Saudi Arabia

    • Qatar

    • Rest of the Middle East

  • Africa

    • Nigeria

    • South Africa

    • Rest of Africa

Latin America

  • Brazil

  • Argentina

  • Colombia

  • Rest of Latin America

Request for Country Level Research Report: Country Level Customization Request

Available Customization

With the given market data, SNS Insider offers customization as per the company’s specific needs. The following customization options are available for the report:

  • Product Analysis

  • Criss-Cross segment analysis (e.g. Product X Application)

  • Product Matrix which gives a detailed comparison of product portfolio of each company

  • Geographic Analysis

  • Additional countries in any of the regions

  • Company Information

  • Detailed analysis and profiling of additional market players (Up to five)

An accurate research report requires proper strategizing as well as implementation. There are multiple factors involved in the completion of good and accurate research report and selecting the best methodology to compete the research is the toughest part. Since the research reports we provide play a crucial role in any company’s decision-making process, therefore we at SNS Insider always believe that we should choose the best method which gives us results closer to reality. This allows us to reach at a stage wherein we can provide our clients best and accurate investment to output ratio.

Each report that we prepare takes a timeframe of 350-400 business hours for production. Starting from the selection of titles through a couple of in-depth brain storming session to the final QC process before uploading our titles on our website we dedicate around 350 working hours. The titles are selected based on their current market cap and the foreseen CAGR and growth.


The 5 steps process:

Step 1: Secondary Research:

Secondary Research or Desk Research is as the name suggests is a research process wherein, we collect data through the readily available information. In this process we use various paid and unpaid databases which our team has access to and gather data through the same. This includes examining of listed companies’ annual reports, Journals, SEC filling etc. Apart from this our team has access to various associations across the globe across different industries. Lastly, we have exchange relationships with various university as well as individual libraries.

Secondary Research

Step 2: Primary Research

When we talk about primary research, it is a type of study in which the researchers collect relevant data samples directly, rather than relying on previously collected data.  This type of research is focused on gaining content specific facts that can be sued to solve specific problems. Since the collected data is fresh and first hand therefore it makes the study more accurate and genuine.

We at SNS Insider have divided Primary Research into 2 parts.

Part 1 wherein we interview the KOLs of major players as well as the upcoming ones across various geographic regions. This allows us to have their view over the market scenario and acts as an important tool to come closer to the accurate market numbers. As many as 45 paid and unpaid primary interviews are taken from both the demand and supply side of the industry to make sure we land at an accurate judgement and analysis of the market.

This step involves the triangulation of data wherein our team analyses the interview transcripts, online survey responses and observation of on filed participants. The below mentioned chart should give a better understanding of the part 1 of the primary interview.

Primary Research

Part 2: In this part of primary research the data collected via secondary research and the part 1 of the primary research is validated with the interviews from individual consultants and subject matter experts.

Consultants are those set of people who have at least 12 years of experience and expertise within the industry whereas Subject Matter Experts are those with at least 15 years of experience behind their back within the same space. The data with the help of two main processes i.e., FGDs (Focused Group Discussions) and IDs (Individual Discussions). This gives us a 3rd party nonbiased primary view of the market scenario making it a more dependable one while collation of the data pointers.

Step 3: Data Bank Validation

Once all the information is collected via primary and secondary sources, we run that information for data validation. At our intelligence centre our research heads track a lot of information related to the market which includes the quarterly reports, the daily stock prices, and other relevant information. Our data bank server gets updated every fortnight and that is how the information which we collected using our primary and secondary information is revalidated in real time.

Data Bank Validation

Step 4: QA/QC Process

After all the data collection and validation our team does a final level of quality check and quality assurance to get rid of any unwanted or undesired mistakes. This might include but not limited to getting rid of the any typos, duplication of numbers or missing of any important information. The people involved in this process include technical content writers, research heads and graphics people. Once this process is completed the title gets uploader on our platform for our clients to read it.

Step 5: Final QC/QA Process:

This is the last process and comes when the client has ordered the study. In this process a final QA/QC is done before the study is emailed to the client. Since we believe in giving our clients a good experience of our research studies, therefore, to make sure that we do not lack at our end in any way humanly possible we do a final round of quality check and then dispatch the study to the client.