image

Reverse Logistics Market Report Scope & Oveview:
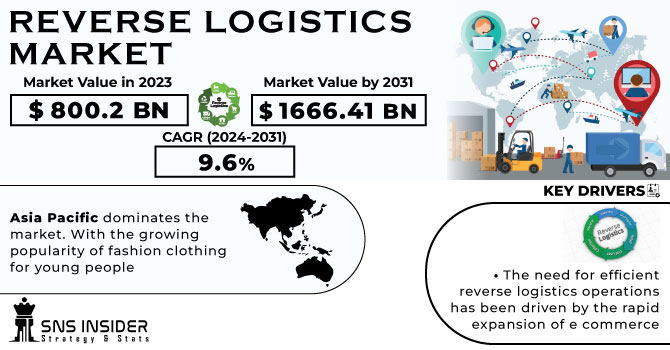
In 2022, the Reverse Logistics Market reached USD 730.29 billion, which is expected to reach USD 1498.42 billion by 2030 and grow at a CAGR of 9.4 % over the forecast period.

The demand for reverse logistics services has been driven by the worldwide growth of e commerce firms, as well as an increasing volume of product returns and replacements. The growth in the market should be driven by increased product recall, due to strict government regulations and quality standards. With the expansion of e-commerce businesses around the world, there is a need for a competent backward logistics solution. As the e commerce industry is rapidly growing, demand for return of goods has increased in a simpler way.

Reverse Logistics Market Revenue Analysis

Get More Information on Reverse Logistics Market - Request Sample Report

With some customers requiring a physical examination of the ordered product before deciding whether it should be retained, E-commerce logistics Service Providers emphasise reverse logistics. With the help of reverse logistics, customers can return products if they are not worth buying. Due to the global growth in e commerce businesses, there is an increased frequency of returns and replacement items requiring a reverse logistics service. With customers purchasing on the Internet, they are more likely to return products because it is easy to add them to a virtual shopping cart and only by physical verification can you check their appearance or fit.

E commerce companies have been able to achieve efficiency and reachability through the growing use of modern technologies, e.g. automation, robotics or Augmented Reality A.R. Because of advantages like convenience, waiting time, cost, and variety of options, a growing number of consumers are becoming accustomed to buying on the Internet rather than in stores. In order to move products from retailers or production units to end users in a shortened period of time, e-commerce undertakings are much dependent on shipping and warehousing capabilities.

The automated system could route customer requests for refunds, produce packaging and labelling material, shorten the waiting times for returns in retail stores or enable customers to pick up their orders by mail amongst other things. Once a return request has been filed or when the returns process is completed and all operations are audited in an effective manner, companies may use automated processes to contact consumers. In order to make sure that customers continue to be kept up to date as soon as they request a refund, exchange or claim for warranty, automation may give them transparency in the return process. It shall also help to fight fraud in the return process.

MARKET DYNAMICS

KEY DRIVERS:  

  • The need for efficient reverse logistics operations has been driven by the rapid expansion of e commerce

Online shoppers expect hassle-free return processes, which has prompted retailers to invest in effective reverse logistics systems to manage returns, exchanges, and refunds efficiently.

  • Reversible logistics, when properly managed, are likely to reduce costs.

RESTRAIN:

  • Managing reverse logistics operations can be expensive

Costs include transportation, handling, inspection, sorting, repair, and disposition of returned goods. Optimizing these processes to reduce costs while maintaining quality can be a challenge.

OPPORTUNITY:

  • Growing need for efficient and customer-friendly reverse logistics solutions

Companies that develop user-friendly returns, offer flexible options, and use technology to streamline return processing can gain a competitive edge. 

  • Creating secondary markets for refurbished or repurposed products can lead to additional revenue streams

CHALLENGES:

  • High Operational Costs

Reverse logistics operations can incur substantial costs due to transportation, inspection, testing, refurbishment, and disposal activities. Balancing these costs while delivering value can be demanding.

IMPACT OF RUSSIAN UKRAINE WAR

The cost of reverse logistics has increased by 20-30% since the beginning of the war. This is due to a number of factors including higher transportation costs, higher insurance premiums and the need to use more expensive routes. The availability of reverse logistics services has decreased. Indeed, many companies have ceased operations in Russia and Ukraine, and those that are still operating are facing problems such as staff shortages and supply chain disruptions. The demand for reverse logistics services has increased. Indeed, companies are returning more goods due to war-related disruptions, and they are also finding ways to recycle and reuse materials to reduce their impact on the environment. In addition, the cost of shipping returns from Europe to China has increased by 50%. This is due to the closure of the airspace to Russia and Ukraine, which has forced shippers to take longer and more expensive routes. The cost of plastic recycling in Ukraine has increased by 25%. This is due to a lack of raw materials, as well as increased transportation and labor costs. Demand for reverse logistics services in the automotive industry increased by 15%. This is due to a shortage of new cars, as well as the need to recycle parts from damaged vehicles.

The impact of the Russian-Ukrainian war on the reverse logistics market is expected to continue for the foreseeable future. Businesses that depend on reverse logistics should be prepared for higher costs, reduced availability, and increased demand. 

IMPACT OF ONGOING RECESSION

Reverse logistics costs are expected to increase by 10-15% by 2023. This is due to a number of factors including higher transportation costs, higher labor costs and the need to comply with new regulations. about environment. The availability of reverse logistics services is expected to decrease. This is because businesses are cutting costs and reducing their workforce, which is leading to a decrease in the number of reverse logistics providers. Demand for reverse logistics services is expected to increase. Indeed, companies are returning more goods as consumers become more frugal, and they are also finding ways to recycle and reuse materials to reduce their environmental impact. Return shipping costs from the United States to China have increased by 10%. This is due to an increase in fuel prices, as well as a decrease in the availability of shipping containers. The cost of recycling electronics in the United States has increased by 5%. This is due to decreased demand for electronics, as well as increased labor and transportation costs. Retail demand for reverse logistics services increased by 15%. This is due to an increase in online shopping, as well as the return of more goods due to the economic downturn.

Businesses are increasingly focusing on efficiency and cost savings. This has led to a need for reverse logistics providers that can provide value-added services, such as repair and refurbishment. There is a growing need for sustainable reverse logistics solutions. Companies are looking to reduce their environmental impact and are turning to reverse logistics providers that offer recycling and reuse services.

KEY MARKET SEGMENTS

By Return Type

  • Repairable Returns

  • Recall Returns

  • B2B & Commercial Returns

  • End of Life Returns

  • End of Use Returns

By Services

  • Transportation

  • Reselling

  • Refund Management

  • Warehousing

  • Replacement Management

  • Others

By End User

  • E-commerce

  • Pharmaceutical

  • Retail

  • Automotive

  • Luxury Goods

  • Consumer Electronics

  • Reusable Packaging

Reverse Logistics Market Segmentation Analysis

Get Customized Report as per Your Business Requirement - Request For Customized Report

REGIONAL ANALYSIS

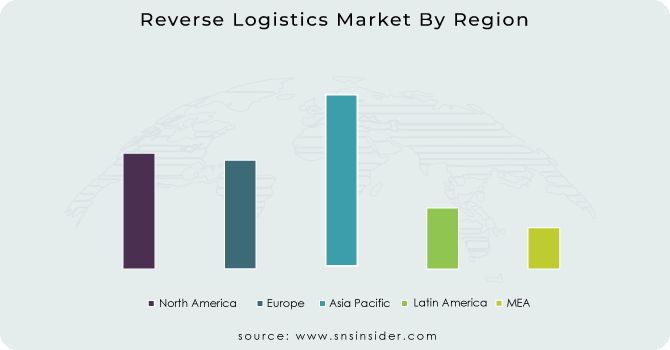
With the highest market share, Asia Pacific dominates the market. With the growing popularity of fashion clothing for young people, it is expected that this region will retain its dominant position over the forecast period. The increased proliferation of the e commerce industry, as well as rapid growth in online shopping activity in countries such as India and China, are also contributing to this growth. The growing trend towards online shopping will lead to higher returns which are likely to support market growth in the region. In addition, the expansion of the market is expected to be driven by the increasing growth of the manufacturing sector in developing countries and the growing demand for reverse logistics for electric vehicles.

During the forecast period, the Middle East and Africa are expected to experience significant growth. In the Middle East & Africa, reversing logistics is projected to grow at a second-fastest annual growth rate during the forecast period. A number of strategic initiatives are being taken by leading players in order to improve their competitiveness. Moreover, the Middle East is seeing increasing investments in order to become a logistics hub. These factors and a rise in disposable incomes provide favourable prospects for the region's reverse logistics sector.

REGIONAL COVERAGE:

North America

  • US

  • Canada

  • Mexico

Europe

  • Eastern Europe

    • Poland

    • Romania

    • Hungary

    • Turkey

    • Rest of Eastern Europe

  • Western Europe

    • Germany

    • France

    • UK

    • Italy

    • Spain

    • Netherlands

    • Switzerland

    • Austria

    • Rest of Western Europe

Asia Pacific

  • China

  • India

  • Japan

  • South Korea

  • Vietnam

  • Singapore

  • Australia

  • Rest of Asia Pacific

Middle East & Africa

  • Middle East

    • UAE

    • Egypt

    • Saudi Arabia

    • Qatar

    • Rest of Middle East

  • Africa

    • Nigeria

    • South Africa

    • Rest of Africa

Latin America

  • Brazil

  • Argentina

  • Colombia

  • Rest of Latin America   

Key Players

Some major key players in the Reverse Logistics market are Safexpress Pvt Ltd, DB SCHENKER, FedEx Corporation, Yusen Logistics Co. Ltd, Deutsche Post AG, RLG Systems AG, Kintetsu World Express, Inc, Core Logistic Private Limited, United Parcel Service, Inc, CCR Logistics Systems AG and other players.

FedEx Corporation-Company Financial Analysis

Company Landscape Analysis

RECENT DEVELOPMENT

  • In order to consolidate its market leading experience in reverse operations and invest in future returns, repairs and refurbishments of electronic equipment, DB Schenker is launching a new line of Circular Economy Logistics products.

  • Two new Express services are announced by AJEX Logistics Services, a specialist of express shipping and distribution solutions to the Middle East based in Saudi Arabia: AJEX Same Day Domestic and AJEX pick up services in Dammam, Riyadh and Jeddah.

Reverse Logistics Market Report Scope:
Report Attributes Details
Market Size in 2022  US$ 730.29 Bn
Market Size by 2030  US$ 1498.42 Bn
CAGR   CAGR of 9.4 % From 2023 to 2030
Base Year 2022
Forecast Period  2023-2030
Historical Data  2020-2021
Report Scope & Coverage Market Size, Segments Analysis, Competitive  Landscape, Regional Analysis, DROC & SWOT Analysis, Forecast Outlook
Key Segments • by Return Type (Repairable Returns, Recall Returns, B2B & Commercial Returns, End of Life Returns, End of Use Returns)
• by Services (Transportation, Reselling, Refund Management, Warehousing, Replacement Management, Others)
• by End User (E-commerce, Pharmaceutical, Retail, Automotive, Luxury Goods, Consumer Electronics, Reusable Packaging)
Regional Analysis/Coverage North America (US, Canada, Mexico), Europe (Eastern Europe [Poland, Romania, Hungary, Turkey, Rest of Eastern Europe] Western Europe] Germany, France, UK, Italy, Spain, Netherlands, Switzerland, Austria, Rest of Western Europe]). Asia Pacific (China, India, Japan, South Korea, Vietnam, Singapore, Australia, Rest of Asia Pacific), Middle East & Africa (Middle East [UAE, Egypt, Saudi Arabia, Qatar, Rest of Middle East], Africa [Nigeria, South Africa, Rest of Africa], Latin America (Brazil, Argentina, Colombia Rest of Latin America)
Company Profiles Safexpress Pvt Ltd, DB SCHENKER, FedEx Corporation, Yusen Logistics Co. Ltd, Deutsche Post AG, RLG Systems AG, Kintetsu World Express, Inc, Core Logistic Private Limited, United Parcel Service, Inc, CCR Logistics Systems AG
Key Drivers • The need for efficient reverse logistics operations has been driven by the rapid expansion of e commerce
• Reversible logistics, when properly managed, are likely to reduce costs.
Market Restraints • Managing reverse logistics operations can be expensive


Frequently Asked Questions

Ans:  The Reverse Logistics Market is expected to grow at a CAGR of 9.4 %.

Ans: The Reverse Logistics Market size was USD 730.29 billion in 2022 and is expected to Reach USD 1498.42 billion by 2030.

Ans: Rapid Expansion of e-commerce has given growth to the market.

Ans: High operational cost acts as a restraint.

Ans: Asia Pacific region is dominating the market with highest market share.

Table of Contents

1. Introduction
1.1 Market Definition
1.2 Scope
1.3 Research Assumptions

2. Research Methodology

3. Market Dynamics
3.1 Drivers
3.2 Restraints
3.3 Opportunities
3.4 Challenges

4. Impact Analysis
4.1 Impact of Russia-Ukraine war
4.2 Impact of Ongoing Recession
4.2.1 Introduction
4.2.2 Impact on major economies
4.2.2.1 US
4.2.2.2 Canada
4.2.2.3 Germany
4.2.2.4 France
4.2.2.5 United Kingdom
4.2.2.6 China
4.2.2.7 Japan
4.2.2.8 South Korea
4.2.2.9 Rest of the World
4.3 Supply Demand Gap Analysis

5. Value Chain Analysis

6. Porter’s 5 forces model

7. PEST Analysis

8. Reverse Logistics Market, By Return Type
8.1 Repairable Returns
8.2 Recall Returns
8.3 B2B & Commercial Returns
8.4 End of Life Returns
8.5 End of Use Returns

9. Reverse Logistics Market By Services
9.1 Transportation
9.2 Reselling
9.3 Refund Management
9.4 Warehousing
9.5 Replacement Management
9.6 Others

10. Reverse Logistics Market, By End User
10.1 E-commerce
10.2 Pharmaceutical
10.3 Retail
10.4 Automotive
10.5 Luxury Goods
10.6 Consumer Electronics
10.7 Reusable Packaging

11. Regional Analysis
11.1 Introduction
11.2 North America
11.2.1 North America Reverse Logistics Market by Country
11.2.2North America Reverse Logistics Market by Return Type
11.2.3 North America Reverse Logistics Market by Services
11.2.4 North America Reverse Logistics Market by End User
11.2.5 USA
11.2.5.1 USA Reverse Logistics Market by Return Type
11.2.5.2 USA Reverse Logistics Market by Services
11.2.5.3 USA Reverse Logistics Market by End User
11.2.6 Canada
11.2.6.1 Canada Reverse Logistics Market by Return Type
11.2.6.2 Canada Reverse Logistics Market by Services
11.2.6.3 Canada Reverse Logistics Market by End User
11.2.7 Mexico
11.2.7.1 Mexico Reverse Logistics Market by Return Type
11.2.7.2 Mexico Reverse Logistics Market by Services
11.2.7.3 Mexico Reverse Logistics Market by End User
11.3 Europe
11.3.1 Eastern Europe
11.3.1.1 Eastern Europe Reverse Logistics Market by Country
11.3.1.2 Eastern Europe Reverse Logistics Market by Return Type
11.3.1.3 Eastern Europe Reverse Logistics Market by Services
11.3.1.4 Eastern Europe Reverse Logistics Market by End User
11.3.1.5 Poland
11.3.1.5.1 Poland Reverse Logistics Market by Return Type
11.3.1.5.2 Poland Reverse Logistics Market by Services
11.3.1.5.3 Poland Reverse Logistics Market by End User
11.3.1.6 Romania
11.3.1.6.1 Romania Reverse Logistics Market by Return Type
11.3.1.6.2 Romania Reverse Logistics Market by Services
11.3.1.6.4 Romania Reverse Logistics Market by End User
11.3.1.7 Turkey
11.3.1.7.1 Turkey Reverse Logistics Market by Return Type
11.3.1.7.2 Turkey Reverse Logistics Market by Services
11.3.1.7.3 Turkey Reverse Logistics Market by End User
11.3.1.8 Rest of Eastern Europe
11.3.1.8.1 Rest of Eastern Europe Reverse Logistics Market by Return Type
11.3.1.8.2 Rest of Eastern Europe Reverse Logistics Market by Services
11.3.1.8.3 Rest of Eastern Europe Reverse Logistics Market by End User
11.3.2 Western Europe
11.3.2.1 Western Europe Reverse Logistics Market by Country
11.3.2.2 Western Europe Reverse Logistics Market by Return Type
11.3.2.3 Western Europe Reverse Logistics Market by Services
11.3.2.4 Western Europe Reverse Logistics Market by End User
11.3.2.5 Germany
11.3.2.5.1 Germany Reverse Logistics Market by Return Type
11.3.2.5.2 Germany Reverse Logistics Market by Services
11.3.2.5.3 Germany Reverse Logistics Market by End User
11.3.2.6 France
11.3.2.6.1 France Reverse Logistics Market by Return Type
11.3.2.6.2 France Reverse Logistics Market by Services
11.3.2.6.3 France Reverse Logistics Market by End User
11.3.2.7 UK
11.3.2.7.1 UK Reverse Logistics Market by Return Type
11.3.2.7.2 UK Reverse Logistics Market by Services
11.3.2.7.3 UK Reverse Logistics Market by End User
11.3.2.8 Italy
11.3.2.8.1 Italy Reverse Logistics Market by Return Type
11.3.2.8.2 Italy Reverse Logistics Market by Services
11.3.2.8.3 Italy Reverse Logistics Market by End User
11.3.2.9 Spain
11.3.2.9.1 Spain Reverse Logistics Market by Return Type
11.3.2.9.2 Spain Reverse Logistics Market by Services
11.3.2.9.3 Spain Reverse Logistics Market by End User
11.3.2.10 Netherlands
11.3.2.10.1 Netherlands Reverse Logistics Market by Return Type
11.3.2.10.2 Netherlands Reverse Logistics Market by Services
11.3.2.10.3 Netherlands Reverse Logistics Market by End User
11.3.2.11 Switzerland
11.3.2.11.1 Switzerland Reverse Logistics Market by Return Type
11.3.2.11.2 Switzerland Reverse Logistics Market by Services
11.3.2.11.3 Switzerland Reverse Logistics Market by End User
11.3.2.1.12 Austria
11.3.2.12.1 Austria Reverse Logistics Market by Return Type
11.3.2.12.2 Austria Reverse Logistics Market by Services
11.3.2.12.3 Austria Reverse Logistics Market by End User
11.3.2.13 Rest of Western Europe
11.3.2.13.1 Rest of Western Europe Reverse Logistics Market by Return Type
11.3.2.13.2 Rest of Western Europe Reverse Logistics Market by Services
11.3.2.13.3 Rest of Western Europe Reverse Logistics Market by End User
11.4 Asia-Pacific
11.4.1 Asia-Pacific Reverse Logistics Market by country
11.4.2 Asia-Pacific Reverse Logistics Market by Return Type
11.4.3 Asia-Pacific Reverse Logistics Market by Services
11.4.4 Asia-Pacific Reverse Logistics Market by End User
11.4.5 China
11.4.5.1 China Reverse Logistics Market by Return Type
11.4.5.2 China Reverse Logistics Market by Services
11.4.5.3 China Reverse Logistics Market by End User
11.4.6 India
11.4.6.1 India Reverse Logistics Market by Return Type
11.4.6.2 India Reverse Logistics Market by Services
11.4.6.3 India Reverse Logistics Market by End User
11.4.7 Japan
11.4.7.1 Japan Reverse Logistics Market by Return Type
11.4.7.2 Japan Reverse Logistics Market by Services
11.4.7.3 Japan Reverse Logistics Market by End User
11.4.8 South Korea
11.4.8.1 South Korea Reverse Logistics Market by Return Type
11.4.8.2 South Korea Reverse Logistics Market by Services
11.4.8.3 South Korea Reverse Logistics Market by End User
11.4.9 Vietnam
11.4.9.1 Vietnam Reverse Logistics Market by Return Type
11.4.9.2 Vietnam Reverse Logistics Market by Services
11.4.9.3 Vietnam Reverse Logistics Market by End User
11.4.10 Singapore
11.4.10.1 Singapore Reverse Logistics Market by Return Type
11.4.10.2 Singapore Reverse Logistics Market by Services
11.4.10.3 Singapore Reverse Logistics Market by End User
11.4.11 Australia
11.4.11.1 Australia Reverse Logistics Market by Return Type
11.4.11.2 Australia Reverse Logistics Market by Services
11.4.11.3 Australia Reverse Logistics Market by End User
11.4.12 Rest of Asia-Pacific
11.4.12.1 Rest of Asia-Pacific Reverse Logistics Market by Return Type
11.4.12.2 Rest of Asia-Pacific Reverse Logistics Market by Services
11.4.12.3 Rest of Asia-Pacific Reverse Logistics Market by End User
11.5 Middle East & Africa
11.5.1 Middle East
11.5.1.1 Middle East Reverse Logistics Market by Country
11.5.1.2 Middle East Reverse Logistics Market by Return Type
11.5.1.3 Middle East Reverse Logistics Market by Services
11.5.1.4 Middle East Reverse Logistics Market by End User
11.5.1.5 UAE
11.5.1.5.1 UAE Reverse Logistics Market by Return Type
11.5.1.5.2 UAE Reverse Logistics Market by Services
11.5.1.5.3 UAE Reverse Logistics Market by End User
11.5.1.6 Egypt
11.5.1.6.1 Egypt Reverse Logistics Market by Return Type
11.5.1.6.2 Egypt Reverse Logistics Market by Services
11.5.1.6.3 Egypt Reverse Logistics Market by End User
11.5.1.7 Saudi Arabia
11.5.1.7.1 Saudi Arabia Reverse Logistics Market by Return Type
11.5.1.7.2 Saudi Arabia Reverse Logistics Market by Services
11.5.1.7.3 Saudi Arabia Reverse Logistics Market by End User
11.5.1.8 Qatar
11.5.1.8.1 Qatar Reverse Logistics Market by Return Type
11.5.1.8.2 Qatar Reverse Logistics Market by Services
11.5.1.8.3 Qatar Reverse Logistics Market by End User
11.5.1.9 Rest of Middle East
11.5.1.9.1 Rest of Middle East Reverse Logistics Market by Return Type
11.5.1.9.2 Rest of Middle East Reverse Logistics Market by Services
11.5.1.9.3 Rest of Middle East Reverse Logistics Market by End User
11.5.2 Africa
11.5.2.1 Africa Reverse Logistics Market by Country
11.5.2.2 Africa Reverse Logistics Market by Return Type
11.5.2.3 Africa Reverse Logistics Market by Services
11.5.2.4 Africa Reverse Logistics Market by End User
11.5.2.5 Nigeria
11.5.2.5.1 Nigeria Reverse Logistics Market by Return Type
11.5.2.5.2 Nigeria Reverse Logistics Market by Services
11.5.2.5.3 Nigeria Reverse Logistics Market by End User
11.5.2.6 South Africa
11.5.2.6.1 South Africa Reverse Logistics Market by Return Type
11.5.2.6.2 South Africa Reverse Logistics Market by Services
11.5.2.6.3 South Africa Reverse Logistics Market by End User
11.5.2.7 Rest of Africa
11.5.2.7.1 Rest of Africa Reverse Logistics Market by Return Type
11.5.2.7.2 Rest of Africa Reverse Logistics Market by Services
11.5.2.7.3 Rest of Africa Reverse Logistics Market by End User
11.6 Latin America
11.6.1 Latin America Reverse Logistics Market by country
11.6.2 Latin America Reverse Logistics Market by Return Type
11.6.3 Latin America Reverse Logistics Market by Services
11.6.4 Latin America Reverse Logistics Market by End User
11.6.5 Brazil
11.6.5.1 Brazil America Reverse Logistics by Return Type
11.6.5.2 Brazil America Reverse Logistics by Services
11.6.5.3 Brazil America Reverse Logistics by End User
11.6.6 Argentina
11.6.6.1 Argentina America Reverse Logistics by Return Type
11.6.6.2 Argentina America Reverse Logistics by Services
11.6.6.3 Argentina America Reverse Logistics by End User
11.6.7 Colombia
11.6.7.1 Colombia America Reverse Logistics by Return Type
11.6.7.2 Colombia America Reverse Logistics by Services
11.6.7.3 Colombia America Reverse Logistics by End User
11.6.8 Rest of Latin America
11.6.8.1 Rest of Latin America Reverse Logistics by Return Type
11.6.8.2 Rest of Latin America Reverse Logistics by Services
11.6.8.3 Rest of Latin America Reverse Logistics by End User

12 Company profile
12.1 Safexpress Pvt Ltd
12.1.1 Company Overview
12.1.2 Financial
12.1.3 Products/ Services Offered
12.1.4 SWOT Analysis
12.1.5 The SNS View
12.2 DB SCHENKER
12.2.1 Company Overview
12.2.2 Financials
12.2.3 Product/Services Offered
12.2.4 SWOT Analysis
12.2.5 The SNS View
12.3 FedEx Corporation
12.3.1 Company Overview
12.3.2 Financials
12.3.3 Product/Services Offered
12.3.4 SWOT Analysis
12.3.5 The SNS View
12.4 Yusen Logistics Co. Ltd
12.4.1 Company Overview
12.4.2 Financials
12.4.3 Product/Services Offered
12.4.4 SWOT Analysis
12.4.5 The SNS View
12.5 Deutsche Post AG
12.5.1 Company Overview
12.5.2 Financials
12.5.3 Product/Services Offered
12.5.4 SWOT Analysis
12.5.5 The SNS View
12.6 RLG Systems AG
12.6.1 Company Overview
12.6.2 Financials
12.6.3 Product/Services Offered
12.6.4 SWOT Analysis
12.6.5 The SNS View
12.7 Kintetsu World Express, Inc
12.7.1 Company Overview
12.7.2 Financials
12.7.3 Product/Services Offered
12.7.4 SWOT Analysis
12.7.5 The SNS View
12.8 Core Logistic Private Limited
12.8.1 Company Overview
12.8.2 Financials
12.8.3 Product/Services Offered
12.8.4 SWOT Analysis
12.8.5 The SNS View
12.9  United Parcel Service, Inc
12.9.1 Company Overview
12.9.2 Financials
12.9.3 Product/Services Offered
12.9.4 SWOT Analysis
12.9.5 The SNS View
12.10 CCR Logistics Systems AG
12.10.1 Company Overview
12.10.2 Financials
12.10.3 Product/Services Offered
12.10.4 SWOT Analysis
12.10.5 The SNS View

13. Competitive Landscape
13.1 Competitive Bench marking
13.2 Market Share Analysis
13.3 Recent Developments
13.3.1 Industry News
13.3.2 Company News
13.3.3 Mergers & Acquisitions

14. Use Case and Best Practices

15. Conclusion

An accurate research report requires proper strategizing as well as implementation. There are multiple factors involved in the completion of good and accurate research report and selecting the best methodology to compete the research is the toughest part. Since the research reports we provide play a crucial role in any company’s decision-making process, therefore we at SNS Insider always believe that we should choose the best method which gives us results closer to reality. This allows us to reach at a stage wherein we can provide our clients best and accurate investment to output ratio.

Each report that we prepare takes a timeframe of 350-400 business hours for production. Starting from the selection of titles through a couple of in-depth brain storming session to the final QC process before uploading our titles on our website we dedicate around 350 working hours. The titles are selected based on their current market cap and the foreseen CAGR and growth.


The 5 steps process:

Step 1: Secondary Research:

Secondary Research or Desk Research is as the name suggests is a research process wherein, we collect data through the readily available information. In this process we use various paid and unpaid databases which our team has access to and gather data through the same. This includes examining of listed companies’ annual reports, Journals, SEC filling etc. Apart from this our team has access to various associations across the globe across different industries. Lastly, we have exchange relationships with various university as well as individual libraries.

Secondary Research

Step 2: Primary Research

When we talk about primary research, it is a type of study in which the researchers collect relevant data samples directly, rather than relying on previously collected data.  This type of research is focused on gaining content specific facts that can be sued to solve specific problems. Since the collected data is fresh and first hand therefore it makes the study more accurate and genuine.

We at SNS Insider have divided Primary Research into 2 parts.

Part 1 wherein we interview the KOLs of major players as well as the upcoming ones across various geographic regions. This allows us to have their view over the market scenario and acts as an important tool to come closer to the accurate market numbers. As many as 45 paid and unpaid primary interviews are taken from both the demand and supply side of the industry to make sure we land at an accurate judgement and analysis of the market.

This step involves the triangulation of data wherein our team analyses the interview transcripts, online survey responses and observation of on filed participants. The below mentioned chart should give a better understanding of the part 1 of the primary interview.

Primary Research

Part 2: In this part of primary research the data collected via secondary research and the part 1 of the primary research is validated with the interviews from individual consultants and subject matter experts.

Consultants are those set of people who have at least 12 years of experience and expertise within the industry whereas Subject Matter Experts are those with at least 15 years of experience behind their back within the same space. The data with the help of two main processes i.e., FGDs (Focused Group Discussions) and IDs (Individual Discussions). This gives us a 3rd party nonbiased primary view of the market scenario making it a more dependable one while collation of the data pointers.

Step 3: Data Bank Validation

Once all the information is collected via primary and secondary sources, we run that information for data validation. At our intelligence centre our research heads track a lot of information related to the market which includes the quarterly reports, the daily stock prices, and other relevant information. Our data bank server gets updated every fortnight and that is how the information which we collected using our primary and secondary information is revalidated in real time.

Data Bank Validation

Step 4: QA/QC Process

After all the data collection and validation our team does a final level of quality check and quality assurance to get rid of any unwanted or undesired mistakes. This might include but not limited to getting rid of the any typos, duplication of numbers or missing of any important information. The people involved in this process include technical content writers, research heads and graphics people. Once this process is completed the title gets uploader on our platform for our clients to read it.

Step 5: Final QC/QA Process:

This is the last process and comes when the client has ordered the study. In this process a final QA/QC is done before the study is emailed to the client. Since we believe in giving our clients a good experience of our research studies, therefore, to make sure that we do not lack at our end in any way humanly possible we do a final round of quality check and then dispatch the study to the client.

Start a Conversation

Hi! Click one of our member below to chat on Phone