Road Safety System Market Size:
Get more information on the Road Safety System Market - Request a Free Sample Report.
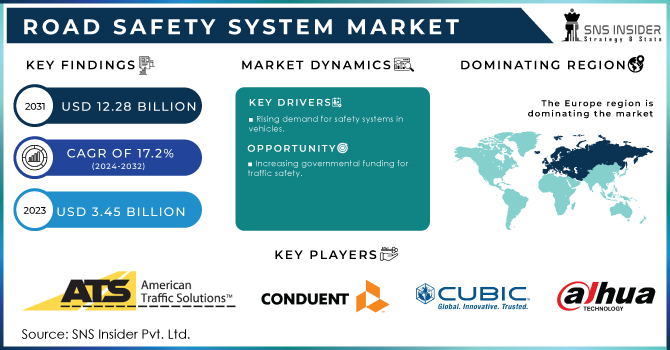
The Road Safety System Market size was recorded at USD 3.45 Billion in 2023 and is expected to reach USD 12.28 Billion by 2031 and grow at a CAGR of 17.2% over the forecast period of 2024-2031.
There has been an increase in the number of road accidents and fatalities which are driving the Road safety system market. The rising demand for public safety and investments in road infrastructure is likely to support market expansion prospects. Furthermore, many governments of the land owned overseas are busy to making a tensile traffic accident as well by various programs & initiatives. To reduce the number of road accidents and deaths, authorities worldwide are concentrating on maintaining traffic civility for safe driving.
Globally, the rise in road deaths has been a major factor driving sales for improved technology on roads. According to the World Health Organization (WHO), every year 1.3 million people die, and a range of between 20 - 50 million more are injured due to road accidents, WHO estimates on reading for health in traffic dataset from- kilometers, committed by drivers around the world who spend all day together at work or socializing with each other. As a result, road safety has become an increasing focus with many government initiatives from around the world dedicated to reducing these numbers. In addition, the expanding focus on public safety has directed authorities to contribute towards road infrastructure. For instance, the Smart Mobility 2030 strategic proposal released by the Intelligent Transportation Society Singapore (ITSS) in partnership with the Land Transport Authority, Singapore Government Initiative is focused on implementing intelligent transport services to provide sustainable smart mobility solutions for the benefit of commuters.
Positive steps taken to enforce road safety systems including policies and traffic monitoring devices will further propel the market growth through 2021. The Road to Zero initiative, by the U.S. federal government is an epic example of this where there will be no traffic fatalities by 2050. Zero fatalities in traffic should be the goal, says the National Safety Council initiative In India, the Ministry of Road Transport and Highways has been making efforts for better road safety standards to bring down accidents on National Highways.
| Report Attributes | Details |
|---|---|
| Market Segmentation | • by Solution Type (Red Light & Speed Enforcement, Incident Detection & Response, Automatic Number, Others), • by Service Type (Professional Services, Managed Services) |
| Regional Analysis | North America (US, Canada, Mexico), Europe (Eastern Europe [Poland, Romania, Hungary, Turkey, Rest of Eastern Europe] Western Europe] Germany, France, UK, Italy, Spain, Netherlands, Switzerland, Austria, Rest of Western Europe]), Asia Pacific (China, India, Japan, South Korea, Vietnam, Singapore, Australia, Rest of Asia Pacific), Middle East & Africa (Middle East [UAE, Egypt, Saudi Arabia, Qatar, Rest of Middle East], Africa [Nigeria, South Africa, Rest of Africa], Latin America (Brazil, Argentina, Colombia, Rest of Latin America) |
| Company Profiles | American Traffic Solutions, Conduent, Cubic Corporation, Dahua Technology, FLIR Services, IDEMIA, Siemens, Swarco, Vitronic |
Road Safety System Market Dynamics
Driver:
-
Rising demand for safety systems in vehicles.
The importance of vehicle safety has become more known by the public as a whole. Safety systems are a big marketing angle for automakers, as more and more consumers know what they want in terms of safety specifications. This is precisely why car insurance providers often offer discounts to policyholders who drive models equipped with state-of-the-art safety features. This has led more customers to opt for cars with safety functions. The rapid advancement of technology has helped to bring highly sophisticated safety systems into the reach of all. Features such as lane-keeping assistance, adaptive cruise control systems, and collision avoidance are more common now.
Restrain:
-
The requirement of high investments.
Opportunity
-
Increasing governmental funding for traffic safety
Safety on the road is becoming more and more important to governments globally. This is hardly surprising since traffic accidents are not only costly in money but also take many human lives. Governments have been investing in road safety systems among many other road safety initiatives. Road safety systems technology evolution: Innovation in road safety systems has grown rapidly over the years. ITS (Intelligent Transportation System) is one of the technologies that are being developed to improve traffic control and reduce accident rates. These are the technological advancements necessitating road safety systems.
Challenges
-
The high cost and the adaptability issues are also the requirements of highly skilled professionals.
Road Safety System Market Segmentation
By Solution Type
-
Red Light & Speed Enforcement
-
Incident Detection & Response
-
Automatic Number
-
Others
In this segmentation, The red light & speed enforcement segment accounted for a market share of more than 55% in 2023. Additionally, these services were installed at road intersections or along roads to maintain traffic discipline. However, with advances in technology, companies began to focus on providing services that offer speed and red-light monitoring capability in a signal device. These advances in product design boost the market growth. For instance, TraffiStar and Jenoptik provide combined speed monitoring and red lights that use high-resolution cameras to record traffic offenses up to four lanes.
By Service Type
-
Professional Services
-
Managed Services
The professional service segment accounted for the largest market share of more than 80% in 2023. Service integration, installation, training, consulting, and support and maintenance are all included in the professional services section. A certain amount of calibration is needed for the equipment to be implemented, in addition to routine maintenance and observation. Consequently, industry growth over the past few years has been driven mostly by the demand for professional services, and this trend is expected to continue.
Road Safety System Market Regional Analysis:
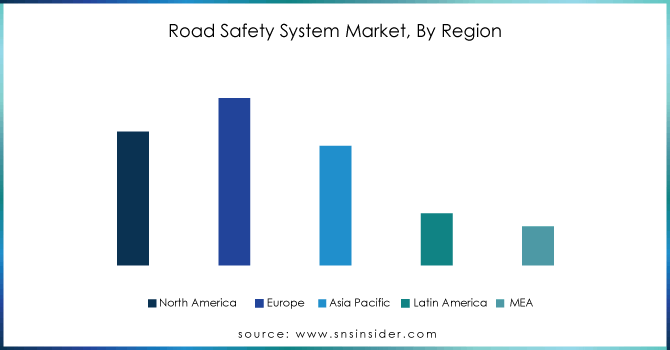
Europe accounted for a significant portion of the market more than 26% in 2023. Modern road infrastructure and a high level of technological adoption have increased sales in Europe. Due to the presence of multiple businesses that have a significant end-user base and a strong regional presence, the region will continue to contribute to the total market demand. Europe has developed an advanced approach to road safety that emphasizes preventative measures. While Europe has a lower road accident death rate than the world average, the rates differ primarily between nations. As a result, several nations are working to reduce the likelihood of these deaths by developing national road safety policies.
Over the projected period, Asia Pacific is expected to emerge as the regional market with the fastest pace of growth. Regional expansion is being encouraged by rising investments in the development of road infrastructure and the growing requirement of maintaining traffic discipline. Furthermore, nations like China and India have enormous geographical areas, as well as a vast network of roads and highways. Together, these nations' increasing road building and development are driving the Asia Pacific market's expansion.
Get Customized Report as per your Business Requirement - Request For Customized Report
Regional Coverage
North America
-
US
-
Canada
-
Mexico
Europe
-
Eastern Europe
-
Poland
-
Romania
-
Hungary
-
Turkey
-
Rest of Eastern Europe
-
-
Western Europe
-
Germany
-
France
-
UK
-
Italy
-
Spain
-
Netherlands
-
Switzerland
-
Austria
-
Rest of Western Europe
-
Asia Pacific
-
China
-
India
-
Japan
-
South Korea
-
Vietnam
-
Singapore
-
Australia
-
Rest of Asia Pacific
Middle East & Africa
-
Middle East
-
UAE
-
Egypt
-
Saudi Arabia
-
Qatar
-
Rest of Middle East
-
-
Africa
-
Nigeria
-
South Africa
-
Rest of Africa
-
Latin America
-
Brazil
-
Argentina
-
Colombia
-
Rest of Latin America
Key Players in Road Safety System Market
The major key players are American Traffic Solutions, Conduent, Cubic Corporation, Dahua Technology, FLIR Services, IDEMIA, Siemens, Swarco, Vitronic and others.
Cubic Corporation-Company Financial Analysis
| Report Attributes | Details |
| Market Size in 2023 | US$ 3.45 Bn |
| Market Size by 2031 | US$ 12.28 Bn |
| CAGR | CAGR of 17.2 % From 2023 to 2031 |
| Base Year | 2023 |
| Forecast Period | 2024-2031 |
| Historical Data | 2020-2022 |
| Report Scope & Coverage | Market Size, Segments Analysis, Competitive Landscape, Regional Analysis, DROC & SWOT Analysis, Forecast Outlook |
| Key Drivers | • Rising demand for safety systems in vehicles. |
| Market Restraints | • The requirement of high investments. |
Frequently Asked Questions
North America is the largest market for road safety systems.
The high cost and the adaptability issues, also the requirement of highly skilled professionals.
Rising demand for safety systems in vehicles.
The Road Safety System Market size was recorded at USD 3.45 Bn in 2023 and is expected to reach USD 12.28 Bn by 2031.
GAGR of 17.2% over the forecast period of 2024-2031.
Get in Touch
