Sales Gamification Software Market Report Scope & Overview:

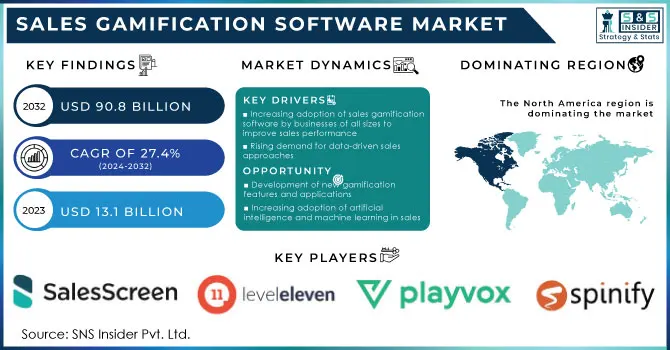
The Sales Gamification Software Market was valued at USD 16.73 billion in 2024 and is expected to reach USD 116.09 billion by 2032, growing at a CAGR of 27.4% over the forecast period of 2025-2032. 

As businesses are increasingly recognizing the importance of employee engagement, they are investing in gamification as a means to improve engagement and create a more interactive working environment. Leaders can use gamified sales tools such as leaderboards, point systems, rewards, and real-time feedback to supercharge motivation by creating visibility around both individual and team performance. This taps into natural fitness weaknesses that employees want and feel rewarded when they do it. 

Sales Gamification Software Market,Revenue Analysis

Get More Information on Sales Gamification Software Market - Request Sample Report

Sales gamification software adoption is largely fueled by the rising demand for performance optimization. Gamification organizations are adopting gamification to improve sales performance by setting clear, measurable, and attainable goals for sales teams that may be affected through an engaging game-like experience successful gamification relies on competitive instincts, rewarding targets, and tracking progress, such that milestones become celebrations with teams of sales or marketing more focused on the objectives in hand. 

Key Sales Gamification Software Market Trends

  • Integration of AI-driven analytics in Sales Gamification Software enhances performance monitoring, minimizes human errors, and encourages utilization across corporate and remote settings.

  • Biometric authentication features in platforms are gaining traction, strengthening data security, reducing unauthorized access, and complying with organizational IT protocols.

  • Rising adoption of cloud-based solutions promotes remote engagement, supports personalized incentive programs, and facilitates virtual coaching for sales teams.

  • Government-backed digital transformation initiatives in emerging regions, including Africa, Southeast Asia, and Latin America, accelerate the implementation of sophisticated gamified platforms.

  • Mobile-first gamification tools are increasingly preferred, enabling real-time feedback, improving user interaction, and expanding reach in hybrid workforce environments.

Sales Gamification Software Market Growth Drivers:

  • Rising demand for data-driven sales approaches.

  • Increasing adoption of sales gamification software by businesses of all sizes to improve sales performance.

Enterprises are also investing a lot of options in sales gamification software that is ultimately trending to encourage growing needs across organizations regardless of their size owing to factors such as improved sales and enhanced employee engagement. Gamification incorporates aspects of games into your sales processes–like leaderboards, rewards, and challenges into a competitive yet breathy canvas for sales teams. It promotes a culture of winning, motivating sales reps to exceed those targets and be more involved with their work. Also, businesses know that they might have to use different training and motivational methods than before because the market is shifting rapidly. Using gamification, organizations can offer instant feedback and acknowledgment, thereby enhancing performance and productivity. Also, technology is improving and these tools are becoming increasingly more accessible and less expensive, allowing even the little guy to make use of complex sales gamification techniques that can produce massive ROI. Therefore, sales gamification will remain in trend evermore which a part of the wider approach towards new and engaging business-driving methods.

According to the U.S. Small Business Administration (SBA), 73% of small businesses report that technology improves their overall productivity, with gamification tools specifically designed to boost sales efficiency being a part of this trend.

Moreover, The U.S. Bureau of Labor Statistics reports that businesses spent an average of USD 1,299 per employee on training and development. Companies increasingly allocate a portion of this budget toward innovative training solutions like gamification to maximize the effectiveness of their sales teams.

Sales Gamification Software Market Restraints:

  • High cost of sales gamification software.

  • Lack of awareness about the benefits of sales gamification software.

One of the key restraints in sales gamification software adoption is low awareness among businesses about its advantages. Most organizations and especially most small to medium enterprises do not understand how gamification can improve employee motivation, engagement, and overall sales performance. The lack of understanding gives rise to myths regarding the usage and success of gamification techniques, which results in a missed opportunity for companies to optimize their sales procedures. Moreover, companies sometimes see gamification more as a fashion than a strategy which will result in them being reluctant to use efforts on implementation. This behavior is amplified by a relative lack of formal education and training on gamification principles, leading to hesitancy in potentially disruptive solutions becoming part of the existing sales framework. Many organizations will fail to realize the potential tools at their disposal which when deployed correctly could enhance both sales effectiveness and competitive advantage without sufficient awareness of how gamification can result in such outcomes.

Sales Gamification Software Market Opportunities:

  • Development of new gamification features and applications

  • Increasing adoption of artificial intelligence and machine learning in sales.

The rise of artificial intelligence (AI) and machine learning (ML) definitively is revolutionizing how companies reach out to clients as well as manage their sales workflow. This allows organizations to analyze massive amounts of data in real time, revealing insights into customer behaviors, preferences, and trends. AI and ML in customer relationship management also, by harnessing AI and ML, sales teams can maintain their productivity by automating repetitive tasks like lead scoring & data input so that they can spend more time nurturing relationships with prospects/clients and closing deals. In addition, predictive analytics driven by these technologies also find prospective customers and predict sales trends with high precision which can lead to making better decisions. Chatbots and Virtual Assistants: AI-powered chatbots and virtual assistants automate customer engagement, offering personalized responses and support to streamline the customer experience. With companies realizing the significant competitive advantage gained by utilizing AI & ML in their business processes, the adoption of sales strategies embedded with them is only going to increase. Leading to better efficiencies, higher effectiveness, and increased sales revenue.

Sales Gamification Software Market Segment Analysis
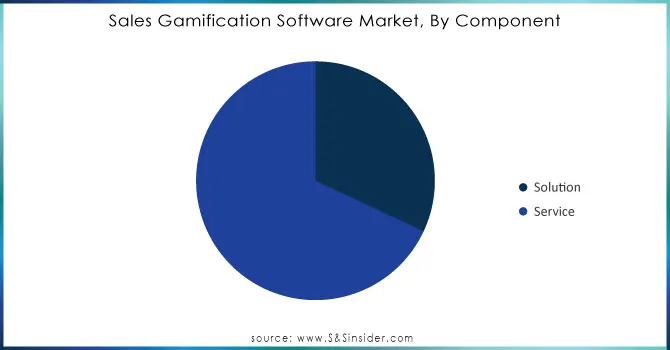
By Component

The service held the largest market share around 68% in 2023. It is because this helps give constant service, customization, and add-on services for greater customer satisfaction and loyalty. Consulting, training, and customer support are critical services that help clients efficiently adopt products into their workflow; the better the adoption, the more valuable each relationship between provider and customer becomes. In software and technology sectors, for example, service components such as technical support, user training, and maintenance are important for enhancing customer experience but also can be a source of recurring revenue thanks to subscription-based models. Moreover, the increasing focus on customer-centric business strategies has highlighted the value of offering services that are tailored to individual client needs and preferences, allowing companies to stand out in competitive markets. Since businesses are more focused on providing a complete solution to specific client needs, the service segment is expected to grow continuously and this strengthens its dominance in terms of market share together with sustainable growth.

Sales-Gamification-Software-Market-By-Component

Need Any Customization Research On Sales Gamification Software Market - Inquiry Now

By Deployment Component

The cloud services held the largest market share around 62% in 2023. Cloud solutions are often consumed through a subscription model that drives predictable budgeting and capital expenditure planning, which leads to less upfront capital expenditure for organizations. In addition, cloud platforms provide convenient access to data and applications from any location a vital benefit in the current remote and hybrid work landscape. Cloud makes traditional on-premise systems lacking, focusing on high capital expenditure, maintenance, and limited scalability. The ready access to technology means increased collaboration, an integrated operating model, and higher throughput. Moreover, with growing data security and compliance requirements around the use of cloud-based services, many more organizations have moved away from on-premise solutions in favor of fast and more current cloud technology. This shift also accentuates the role of cloud technology in enhancing digital transformation and efficiency in service delivery across all industries.

By End-User

The telecommunications sector had the highest market share in 2023 because of competition and the continuous improvement required in sales performance. Sales in the telecom sector are getting tougher and more competitive, according to the changing landscapes of customer needs and competition. Sales gamification software provides telecom organizations with fresh and fun ideas to fire up their sales reps and drive performance, and productivity, through leaderboards, rewards, and performance tracking. Telcos can also adopt gamification practices for sales processes to energize their workforce, optimize training cycles, and encourage customer-facing employees towards better performances that translate to successful sales revenue. Secondly, as the telecom sector has one of the highest adoptions of technology and data analytics among all sectors, implementing gamification techniques becomes more effective in this vertical therefore anchoring its stronghold in the market

Sales Gamification Software Market Regional Analysis

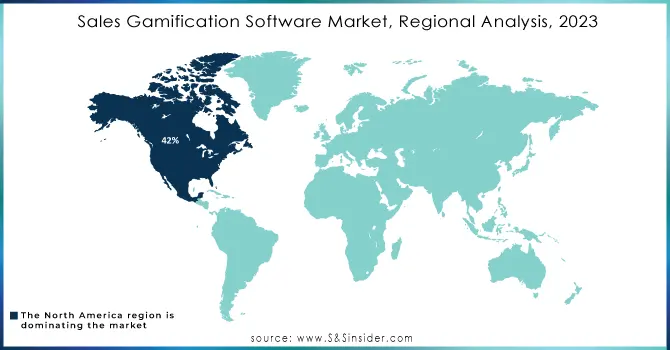
North America Sales Gamification Software Market Insights

North America, particularly the U.S., is a leading market for sales gamification software due to widespread digital adoption and advanced technological infrastructure. Companies are increasingly implementing gamification strategies to enhance sales performance, motivate teams, and improve employee engagement. The market growth is fueled by enterprises seeking innovative solutions to boost productivity, encourage healthy competition, and optimize performance tracking. Gamification software is being integrated with CRM and analytics platforms, enabling real-time insights and personalized incentives. The focus on digital transformation and performance-oriented work cultures makes North America a mature and highly receptive market.

U.S. Sales Gamification Software Market Insights

The U.S. stands as the dominant force in the global sales gamification software market, driven by its advanced technological infrastructure, high adoption rates of digital solutions, and a strong focus on enhancing employee engagement and sales performance. Businesses across various sectors are increasingly integrating gamified elements into their sales strategies to motivate teams, foster healthy competition, and improve productivity. The market's expansion is further propelled by the rise of remote and hybrid work models, which necessitate innovative tools to maintain team cohesion and performance. 

Asia-Pacific Sales Gamification Software Market Insights

Asia-Pacific is emerging as a high-growth region for sales gamification software. Rapid economic development, digital transformation, and growing enterprise adoption are driving market expansion. Organizations in countries like China, India, Japan, and Australia are increasingly leveraging gamified solutions to enhance employee motivation, foster collaboration, and improve sales performance. Gamification is being used to track progress, reward achievements, and create a competitive yet engaging work environment. The growing focus on workforce productivity, combined with increasing awareness of gamification benefits, is encouraging businesses to adopt these solutions, positioning Asia-Pacific as a key market for future growth.

Latin America (LATAM) Sales Gamification Software Market Insights

Latin America is witnessing significant adoption of sales gamification software as organizations seek innovative ways to drive employee engagement and enhance performance. Businesses are leveraging gamified solutions to streamline sales processes, incentivize achievements, and create a more motivated workforce. Digital transformation initiatives, rising awareness of gamification benefits, and competitive business landscapes are supporting market growth. Companies are integrating gamification platforms with existing CRM and sales analytics tools to track performance, monitor progress, and provide real-time rewards. The increasing focus on productivity improvement and employee engagement is making Latin America an emerging and promising region for sales gamification adoption.

Middle East & Africa (MEA) Sales Gamification Software Market Insights

The Middle East and Africa are gradually adopting sales gamification software, driven by growing digital transformation and the desire to enhance employee engagement. Businesses are increasingly using gamified solutions to motivate sales teams, track performance, and encourage healthy competition. Awareness of the benefits of gamification, including improved productivity, better goal alignment, and workforce motivation, is steadily increasing across the region. Organizations in both established and emerging markets are integrating gamification tools with sales management and CRM platforms to monitor achievements and incentivize employees. This trend is expected to drive further adoption and market growth in the coming years.

Sales-Gamification-Software-Market-Regional-Analysis-2023

Sales Gamification Software Market Key Players:

Some of the Sales Gamification Software Market Companies

  • Playvox

  • Spinify

  • Ambition

  • LevelEleven

  • Sales Screen

  • SalesHood

  • SalesLoft

  • Xactly

  • Verint

  • Aon

  • Qstream

  • Motive

  • MindTickle

  • SAP

  • Oracle

  • Zoho

  • BambooHR

  • Tandem

  • KnoahSoft

  • Salesforce

Sales Gamification Software Market for Competitive Landscape:

Playvox, founded in 2012 and headquartered in San Francisco, California, USA, is a leading provider of workforce optimization and gamification software. The platform focuses on enhancing employee engagement, performance management, and real-time analytics, helping organizations motivate teams, improve productivity, and optimize sales and customer service outcomes globally.

  • In 2023, Playvox announced the launch of enhanced analytics features that provide deeper insights into sales performance and gamification metrics, allowing businesses to better tailor their strategies for team motivation. This update emphasizes the integration of AI to provide real-time feedback.

Spinify, established in 2013 and based in Sydney, Australia, specializes in sales gamification and performance management solutions. Its platform enables businesses to create customized leaderboards, performance dashboards, and goal-tracking tools to boost team motivation, engagement, and sales productivity, leveraging gamified strategies for measurable business results.

  • In 2023, Spinify introduced new customization features, enabling companies to create tailored leaderboards and performance dashboards to fit their unique sales strategies. This enhancement aims to increase engagement by allowing users to visualize their goals and achievements better.

Sales Gamification Software Market Report Scope:

Report Attributes Details

Market Size in 2024

 US$ 16.73 Billion

Market Size by 2032

 US$ 116.09 Billion

CAGR 

 CAGR of 27.4 % From 2025 to 2032

Base Year

 2023

Forecast Period

 2025-2032

Historical Data

 2021-2023

Report Scope & Coverage

Market Size, Segments Analysis, Competitive  Landscape, Regional Analysis, DROC & SWOT Analysis, Forecast Outlook

Key Segments

• By Component (Solution, Services)
• By Deployment Component (Cloud, On-Premise)
• By Organization Size (Large Enterprise, Small and Medium Size Enterprise)
• By End-User (Telecom, BFSI, Education, Manufacturing, Healthcare, Retail, Others)

Regional Analysis/Coverage

North America (US, Canada), Europe (Germany, France, UK, Italy, Spain, Poland, Russsia, Rest of Europe), Asia Pacific (China, India, Japan, South Korea, Australia,ASEAN Countries, Rest of Asia Pacific), Middle East & Africa (UAE, Saudi Arabia, Qatar, Egypt, South Africa, Rest of Middle East & Africa), Latin America (Brazil, Argentina, Mexico, Colombia Rest of Latin America)

Company Profiles

Playvox, Spinify, Ambition, Level Eleven, Sales Screen, SalesHood, SalesLoft, Xactly, Verint, Aon

Table Of Contents

1. Introduction

1.1 Market Definition & Scope

 1.2 Research Assumptions & Abbreviations

 1.3 Research Methodology

2. Executive Summary

2.1 Market Snapshot

 2.2 Market Absolute $ Opportunity Assessment & Y-o-Y Analysis, 2021–2032

 2.3 Market Size & Forecast, By Segmentation, 2021–2032

  2.3.1 Market Size By Component

  2.3.2 Market Size By Deployment Component

  2.3.3 Market Size By Organization Size

  2.3.4 Market Size By End-User

 2.4 Market Share & Bps Analysis By Region, 2024

 2.5 Industry Growth Scenarios – Conservative, Likely & Optimistic

 2.6 Industry CxO’s Perspective

3. Market Overview

3.1 Market Dynamics

  3.1.1 Drivers

  3.1.2 Restraints

  3.1.3 Opportunities

  3.1.4 Key Market Trends

 3.2 Industry PESTLE Analysis

 3.3 Key Industry Forces (Porter’s) Impacting Market Growth

 3.4 Industry Supply Chain Analysis

  3.4.1 Raw Material Suppliers

  3.4.2 Manufacturers

  3.4.3 Distributors/Suppliers

  3.4.4 Customers/End-Users

 3.5 Industry Life Cycle Assessment

 3.6 Parent Market Overview

 3.7 Market Risk Assessment

4. Statistical Insights & Trends Reporting

4.1 Pricing & Cost Trends

4.1.1 Variation in unit expenditure across hospital mattresses, surgical pads, orthopedic supports, and wound dressings

4.1.2 Comparative analysis of specialty foam versus conventional cushioning substitutes

4.1.3 Projected fluctuations influenced by polymer, additive, and silicone availability

4.2 Production & Supply Statistics

4.2.1 Manufacturing capability assessment across North America, Europe, Asia-Pacific, and Latin America

4.2.2 Raw ingredient reliance including antimicrobial compounds, retardants, and bio-based polymers

4.2.3 International shipment volumes for therapeutic, protective, and packaging applications

4.3 Technological & Innovation Metrics

4.3.1 Novel developments in biodegradable, hypoallergenic, and ventilated foam solutions

4.3.2 Capital allocation towards ergonomic, pressure-relieving, and anti-decubitus research

4.3.3 Market proportion of customized formulations versus standardized foam sheets

4.4 Product & Patient Impact

4.4.1 Enhancement in patient support, sleep quality, and post-surgical recovery comfort

4.4.2 Liquid absorption efficiency, cushion resilience, and microbial defense performance

4.4.3 Durability contribution for prosthetics, orthopedic braces, and medical transport padding

5. Sales Gamification Software Market Segmental Analysis & Forecast, By Component, 2021 – 2032, Value (USD Billion)

5.1 Introduction

 5.2 Solution

  5.2.1 Key Trends

  5.2.2 Market Size & Forecast, 2021 – 2032

 5.3 Services

6. Sales Gamification Software Market Segmental Analysis & Forecast, By Deployment Component, 2021 – 2032, Value (USD Billion)

    6.1 Introduction

 6.2 Cloud

  6.2.1 Key Trends

  6.2.2 Market Size & Forecast, 2021 – 2032

 6.3 On-Premise

7. Sales Gamification Software Market Segmental Analysis & Forecast, By Organization Size, 2021 – 2032, Value (USD Billion)

    7.1 Introduction

 7.2 Large Enterprise

  7.2.1 Key Trends

  7.2.2 Market Size & Forecast, 2021 – 2032

 7.3 Small and Medium Size Enterprise

8. Sales Gamification Software Market Segmental Analysis & Forecast, By End-User, 2021 – 2032, Value (USD Billion)

    8.1 Introduction

 8.2 Telecom

  8.2.1 Key Trends

  8.2.2 Market Size & Forecast, 2021 – 2032

 8.3 BFSI

    8.4 Education

    8.5 Manufacturing

       8.6 Healthcare

       8.7 Retail

       8.8 Others

9. Sales Gamification Software Market Segmental Analysis & Forecast By Region, 2021 – 2025, Value (USD Billion)

9.1 Introduction

9.2 North America

 9.2.1 Key Trends

 9.2.2 Sales Gamification Software Market Size & Forecast, By Component, 2021 – 2032

 9.2.3 Sales Gamification Software Market Size & Forecast, By Deployment Component, 2021 – 2032

 9.2.4 Sales Gamification Software Market Size & Forecast, By Organization Size, 2021 – 2032

 9.2.5 Sales Gamification Software Market Size & Forecast, By End-User, 2021 – 2032

 9.2.6 Sales Gamification Software Market Size & Forecast, By Country, 2021 – 2032

  9.2.6.1 USA

   9.2.6.1.1 Sales Gamification Software Market Size & Forecast, By Component, 2021 – 2032

   9.2.6.1.2 Sales Gamification Software Market Size & Forecast, By Deployment Component, 2021 – 2032

   9.2.6.1.3 Sales Gamification Software Market Size & Forecast, By Organization Size, 2021 – 2032

   9.2.6.1.4 Sales Gamification Software Market Size & Forecast, By End-User, 2021 – 2032

  9.2.6.2 Canada

   9.2.6.2.1 Sales Gamification Software Market Size & Forecast, By Component, 2021 – 2032

   9.2.6.2.2 Sales Gamification Software Market Size & Forecast, By Deployment Component, 2021 – 2032

   9.2.6.2.3 Sales Gamification Software Market Size & Forecast, By Organization Size, 2021 – 2032

   9.2.6.2.4 Sales Gamification Software Market Size & Forecast, By End-User, 2021 – 2032

9.3 Europe

 9.3.1 Key Trends

 9.3.2 Sales Gamification Software Market Size & Forecast, By Component, 2021 – 2032

 9.3.3 Sales Gamification Software Market Size & Forecast, By Deployment Component, 2021 – 2032

 9.3.4 Sales Gamification Software Market Size & Forecast, By Organization Size, 2021 – 2032

 9.3.5 Sales Gamification Software Market Size & Forecast, By End-User, 2021 – 2032

 9.3.6 Sales Gamification Software Market Size & Forecast, By Country, 2021 – 2032

  9.3.6.1 Germany

   9.3.6.1.1 Sales Gamification Software Market Size & Forecast, By Component, 2021 – 2032

   9.3.6.1.2 Sales Gamification Software Market Size & Forecast, By Deployment Component, 2021 – 2032

   9.3.6.1.3 Sales Gamification Software Market Size & Forecast, By Organization Size, 2021 – 2032

   9.3.6.1.4 Sales Gamification Software Market Size & Forecast, By End-User, 2021 – 2032

  9.3.6.2 UK

   9.3.6.2.1 Sales Gamification Software Market Size & Forecast, By Component, 2021 – 2032

   9.3.6.2.2 Sales Gamification Software Market Size & Forecast, By Deployment Component , 2021 – 2032

   9.3.6.2.3 Sales Gamification Software Market Size & Forecast, By Organization Size, 2021 – 2032

   9.3.6.2.4 Sales Gamification Software Market Size & Forecast, By End-User, 2021 – 2032

  9.3.6.3 France

   9.3.6.3.1 Sales Gamification Software Market Size & Forecast, By Component, 2021 – 2032

   9.3.6.3.2 Sales Gamification Software Market Size & Forecast, By Deployment Component , 2021 – 2032

   9.3.6.3.3 Sales Gamification Software Market Size & Forecast, By Organization Size, 2021 – 2032

   9.3.6.3.4 Sales Gamification Software Market Size & Forecast, By End-User, 2021 – 2032

  9.3.6.4 Italy

   9.3.6.4.1 Sales Gamification Software Market Size & Forecast, By Component, 2021 – 2032

   9.3.6.4.2 Sales Gamification Software Market Size & Forecast, By Deployment Component , 2021 – 2032

   9.3.6.4.3 Sales Gamification Software Market Size & Forecast, By Organization Size, 2021 – 2032

   9.3.6.4.4 Sales Gamification Software Market Size & Forecast, By End-User, 2021 – 2032

  9.3.6.5 Spain

   9.3.6.5.1 Sales Gamification Software Market Size & Forecast, By Component, 2021 – 2032

   9.3.6.5.2 Sales Gamification Software Market Size & Forecast, By Deployment Component , 2021 – 2032

   9.3.6.5.3 Sales Gamification Software Market Size & Forecast, By Organization Size, 2021 – 2032

   9.3.6.5.4 Sales Gamification Software Market Size & Forecast, By End-User, 2021 – 2032

  9.3.6.6 Russia

   9.3.6.6.1 Sales Gamification Software Market Size & Forecast, By Component, 2021 – 2032

   9.3.6.6.2 Sales Gamification Software Market Size & Forecast, By Deployment Component , 2021 – 2032

   9.3.6.6.3 Sales Gamification Software Market Size & Forecast, By Organization Size, 2021 – 2032

   9.3.6.6.4 Sales Gamification Software Market Size & Forecast, By End-User, 2021 – 2032

  9.3.6.7 Poland

   9.3.6.7.1 Sales Gamification Software Market Size & Forecast, By Component, 2021 – 2032

   9.3.6.7.2 Sales Gamification Software Market Size & Forecast, By Deployment Component , 2021 – 2032

   9.3.6.7.3 Sales Gamification Software Market Size & Forecast, By Organization Size, 2021 – 2032

   9.3.6.7.4 Sales Gamification Software Market Size & Forecast, By End-User, 2021 – 2032

  9.3.6.8 Rest of Europe

   9.3.6.8.1 Sales Gamification Software Market Size & Forecast, By Component, 2021 – 2032

   9.3.6.8.2 Sales Gamification Software Market Size & Forecast, By Deployment Component , 2021 – 2032

   9.3.6.8.3 Sales Gamification Software Market Size & Forecast, By Organization Size, 2021 – 2032

   9.3.6.8.4 Sales Gamification Software Market Size & Forecast, By End-User, 2021 – 2032   

9.4 Asia-Pacific

 9.4.1 Key Trends

 9.4.2 Sales Gamification Software Market Size & Forecast, By Component, 2021 – 2032

 9.4.3 Sales Gamification Software Market Size & Forecast, By Deployment Component , 2021 – 2032

 9.4.4 Sales Gamification Software Market Size & Forecast, By Organization Size, 2021 – 2032

 9.4.5 Sales Gamification Software Market Size & Forecast, By End-User, 2021 – 2032

 9.4.6 Sales Gamification Software Market Size & Forecast, By Country, 2021 – 2032

  9.4.6.1 China

   9.4.6.1.1 Sales Gamification Software Market Size & Forecast, By Component, 2021 – 2032

   9.4.6.1.2 Sales Gamification Software Market Size & Forecast, By Deployment Component , 2021 – 2032

   9.4.6.1.3 Sales Gamification Software Market Size & Forecast, By Organization Size, 2021 – 2032

   9.4.6.1.4 Sales Gamification Software Market Size & Forecast, By End-User, 2021 – 2032

  9.4.6.2 India

   9.4.6.2.1 Sales Gamification Software Market Size & Forecast, By Component, 2021 – 2032

   9.4.6.2.2 Sales Gamification Software Market Size & Forecast, By Deployment Component , 2021 – 2032

   9.4.6.2.3 Sales Gamification Software Market Size & Forecast, By Organization Size, 2021 – 2032

   9.4.6.2.4 Sales Gamification Software Market Size & Forecast, By End-User, 2021 – 2032

  9.4.6.3 Japan

   9.4.6.3.1 Sales Gamification Software Market Size & Forecast, By Component, 2021 – 2032

   9.4.6.3.2 Sales Gamification Software Market Size & Forecast, By Deployment Component , 2021 – 2032

   9.4.6.3.3 Sales Gamification Software Market Size & Forecast, By Organization Size, 2021 – 2032

   9.4.6.3.4 Sales Gamification Software Market Size & Forecast, By End-User, 2021 – 2032

  9.4.6.4 South Korea

   9.4.6.4.1 Sales Gamification Software Market Size & Forecast, By Component, 2021 – 2032

   9.4.6.4.2 Sales Gamification Software Market Size & Forecast, By Deployment Component , 2021 – 2032

   9.4.6.4.3 Sales Gamification Software Market Size & Forecast, By Organization Size, 2021 – 2032

   9.4.6.4.4 Sales Gamification Software Market Size & Forecast, By End-User, 2021 – 2032

  9.4.6.5 Australia

   9.4.6.5.1 Sales Gamification Software Market Size & Forecast, By Component, 2021 – 2032

   9.4.6.5.2 Sales Gamification Software Market Size & Forecast, By Deployment Component , 2021 – 2032

   9.4.6.5.3 Sales Gamification Software Market Size & Forecast, By Organization Size, 2021 – 2032

   9.4.6.5.4 Sales Gamification Software Market Size & Forecast, By End-User, 2021 – 2032

  9.4.6.6 ASEAN Countries

   9.4.6.6.1 Sales Gamification Software Market Size & Forecast, By Component, 2021 – 2032

   9.4.6.6.2 Sales Gamification Software Market Size & Forecast, By Deployment Component , 2021 – 2032

   9.4.6.6.3 Sales Gamification Software Market Size & Forecast, By Organization Size, 2021 – 2032

   9.4.6.6.4 Sales Gamification Software Market Size & Forecast, By End-User, 2021 – 2032

  9.4.6.7 Rest of Asia-Pacific

   9.4.6.7.1 Sales Gamification Software Market Size & Forecast, By Component, 2021 – 2032

   9.4.6.7.2 Sales Gamification Software Market Size & Forecast, By Deployment Component , 2021 – 2032

   9.4.6.7.3 Sales Gamification Software Market Size & Forecast, By Organization Size, 2021 – 2032

   9.4.6.7.4 Sales Gamification Software Market Size & Forecast, By End-User, 2021 – 2032

9.5 Latin America

 9.5.1 Key Trends

 9.5.2 Sales Gamification Software Market Size & Forecast, By Component, 2021 – 2032

 9.5.3 Sales Gamification Software Market Size & Forecast, By Deployment Component , 2021 – 2032

 9.5.4 Sales Gamification Software Market Size & Forecast, By Organization Size, 2021 – 2032

 9.5.5 Sales Gamification Software Market Size & Forecast, By End-User, 2021 – 2032

 9.5.6 Sales Gamification Software Market Size & Forecast, By Country, 2021 – 2032

  9.5.6.1 Brazil

   9.5.6.1.1 Sales Gamification Software Market Size & Forecast, By Component, 2021 – 2032

   9.5.6.1.2 Sales Gamification Software Market Size & Forecast, By Deployment Component , 2021 – 2032

   9.5.6.1.3 Sales Gamification Software Market Size & Forecast, By Organization Size, 2021 – 2032

   9.5.6.1.4 Sales Gamification Software Market Size & Forecast, By End-User, 2021 – 2032

  9.5.6.2 Argentina

   9.5.6.2.1 Sales Gamification Software Market Size & Forecast, By Component, 2021 – 2032

   9.5.6.2.2 Sales Gamification Software Market Size & Forecast, By Deployment Component , 2021 – 2032

   9.5.6.2.3 Sales Gamification Software Market Size & Forecast, By Organization Size, 2021 – 2032

   9.5.6.2.4 Sales Gamification Software Market Size & Forecast, By End-User, 2021 – 2032

  9.5.6.3 Mexico

   9.5.6.3.1 Sales Gamification Software Market Size & Forecast, By Component, 2021 – 2032

   9.5.6.3.2 Sales Gamification Software Market Size & Forecast, By Deployment Component , 2021 – 2032

   9.5.6.3.3 Sales Gamification Software Market Size & Forecast, By Organization Size, 2021 – 2032

   9.5.6.3.4 Sales Gamification Software Market Size & Forecast, By End-User, 2021 – 2032

  9.5.6.4 Colombia

   9.5.6.4.1 Sales Gamification Software Market Size & Forecast, By Component, 2021 – 2032

   9.5.6.4.2 Sales Gamification Software Market Size & Forecast, By Deployment Component , 2021 – 2032

   9.5.6.4.3 Sales Gamification Software Market Size & Forecast, By Organization Size, 2021 – 2032

   9.5.6.4.4 Sales Gamification Software Market Size & Forecast, By End-User, 2021 – 2032

  9.5.6.5 Rest of Latin America

   9.5.6.5.1 Sales Gamification Software Market Size & Forecast, By Component, 2021 – 2032

   9.5.6.5.2 Sales Gamification Software Market Size & Forecast, By Deployment Component , 2021 – 2032

   9.5.6.5.3 Sales Gamification Software Market Size & Forecast, By Organization Size, 2021 – 2032

   9.5.6.5.4 Sales Gamification Software Market Size & Forecast, By End-User, 2021 – 2032

9.6 Middle East & Africa

 9.6.1 Key Trends

 9.6.2 Sales Gamification Software Market Size & Forecast, By Component, 2021 – 2032

 9.6.3 Sales Gamification Software Market Size & Forecast, By Deployment Component , 2021 – 2032

 9.6.4 Sales Gamification Software Market Size & Forecast, By Organization Size, 2021 – 2032

 9.6.5 Sales Gamification Software Market Size & Forecast, By End-User, 2021 – 2032

 9.6.6 Sales Gamification Software Market Size & Forecast, By Country, 2021 – 2032

  9.6.6.1 UAE

   9.6.6.1.1 Sales Gamification Software Market Size & Forecast, By Component, 2021 – 2032

   9.6.6.1.2 Sales Gamification Software Market Size & Forecast, By Deployment Component , 2021 – 2032

   9.6.6.1.3 Sales Gamification Software Market Size & Forecast, By Organization Size, 2021 – 2032

   9.6.6.1.4 Sales Gamification Software Market Size & Forecast, By End-User, 2021 – 2032

  9.6.6.2 Saudi Arabia

   9.6.6.2.1 Sales Gamification Software Market Size & Forecast, By Component, 2021 – 2032

   9.6.6.2.2 Sales Gamification Software Market Size & Forecast, By Deployment Component , 2021 – 2032

   9.6.6.2.3 Sales Gamification Software Market Size & Forecast, By Organization Size, 2021 – 2032

   9.6.6.2.4 Sales Gamification Software Market Size & Forecast, By End-User, 2021 – 2032

  9.6.6.3 Qatar

   9.6.6.3.1 Sales Gamification Software Market Size & Forecast, By Component, 2021 – 2032

   9.6.6.3.2 Sales Gamification Software Market Size & Forecast, By Deployment Component , 2021 – 2032

   9.6.6.3.3 Sales Gamification Software Market Size & Forecast, By Organization Size, 2021 – 2032

   9.6.6.3.4 Sales Gamification Software Market Size & Forecast, By End-User, 2021 – 2032

  9.6.6.4 Egypt

   9.6.6.4.1 Sales Gamification Software Market Size & Forecast, By Component, 2021 – 2032

   9.6.6.4.2 Sales Gamification Software Market Size & Forecast, By Deployment Component , 2021 – 2032

   9.6.6.4.3 Sales Gamification Software Market Size & Forecast, By Organization Size, 2021 – 2032

   9.6.6.4.4 Sales Gamification Software Market Size & Forecast, By End-User, 2021 – 2032

  9.6.6.5 South Africa

   9.6.6.5.1 Sales Gamification Software Market Size & Forecast, By Component, 2021 – 2032

   9.6.6.5.2 Sales Gamification Software Market Size & Forecast, By Deployment Component , 2021 – 2032

   9.6.6.5.3 Sales Gamification Software Market Size & Forecast, By Organization Size, 2021 – 2032

   9.6.6.5.4 Sales Gamification Software Market Size & Forecast, By End-User, 2021 – 2032

  9.6.6.6 Rest of Middle East & Africa

   9.6.6.6.1 Sales Gamification Software Market Size & Forecast, By Component, 2021 – 2032

   9.6.6.6.2 Sales Gamification Software Market Size & Forecast, By Deployment Component , 2021 – 2032

   9.6.6.6.3 Sales Gamification Software Market Size & Forecast, By Organization Size, 2021 – 2032

   9.6.6.6.4 Sales Gamification Software Market Size & Forecast, By End-User, 2021 – 2032

10. Competitive Landscape

 10.1 Key Players' Positioning

 10.2 Competitive Developments

  10.2.1 Key Strategies Adopted (%), By Key Players, 2024

  10.2.2 Year-Wise Strategies & Development, 2021 – 2025

  10.2.3 Number Of Strategies Adopted By Key Players, 2024

 10.3 Market Share Analysis, 2024

 10.4 Product/Service & Application Benchmarking

  10.4.1 Product/Service Specifications & Features By Key Players

  10.4.2 Product/Service Heatmap By Key Players

  10.4.3 Application Heatmap By Key Players

 10.5 Industry Start-Up & Innovation Landscape

10.6 Key Company Profiles

 10.6.1 Spinify

  10.6.1.1 Company Overview & Snapshot

  10.6.1.2 Product/Service Portfolio

  10.6.1.3 Key Company Financials

  10.6.1.4 SWOT Analysis

 10.6.2 Ambition

 10.6.3 LevelEleven

 10.6.4 Sales Screen

 10.6.5 SalesHood

 10.6.6 SalesLoft

 10.6.7 Xactly

 10.6.8 Verint

 10.6.9 Aon

    10.6.10 Qstream

 10.6.11 Motive

 10.6.12 MindTickle

 10.6.13 SAP

 10.6.14 Oracle

 10.6.15 Zoho

 10.6.16 BambooHR

 10.6.17 Tandem

 10.6.18 KnoahSoft

 10.6.19 Salesforce

 10.6.20 Saudi Arabian Oil Co.

11. Analyst Recommendations

 11.1 SNS Insider Opportunity Map

 11.2 Industry Low-Hanging Fruit Assessment

 11.3 Market Entry & Growth Strategy

 11.4 Analyst Viewpoint & Suggestions on Market Growth

12. Assumptions

13. Disclaimer

14. Appendix

 14.1 List Of Tables

 14.2 List Of Figure

KEY MARKET SEGMENTATION

By Component

  • Solution

  •  Services

By Deployment Component

  • Cloud

  • On-Premise

By Organization Size

  • Large Enterprise

  • Small and Medium Size Enterprise

By End-User

  • Telecom

  • BFSI

  • Education

  • Manufacturing

  •  Healthcare

  •  Retail

  •  Others

Request for Segment Customization as per your Business Requirement: Segment Customization Request


Regional Coverage:

North America

  • US

  • Canada

Europe

  • Germany

  • UK

  • France

  • Italy

  • Spain

  • Russia

  • Poland

  • Rest of Europe

Asia Pacific

  • China

  • India

  • Japan

  • South Korea

  • ASEAN Countries

  • Australia

  • Rest of Asia Pacific

Latin America

  • Brazil

  • Argentina

  • Mexico

  • Colombia

  • Rest of Latin America

Middle East & Africa

  • UAE

  • Saudi Arabia

  • Qatar

  • Egypt

  • South Africa

  • Rest of Middle East & Africa

Request for Country Level Research Report: Country Level Customization Request


Available Customization

With the given market data, SNS Insider offers customization as per the company’s specific needs. The following customization options are available for the report:

  • Detailed Volume Analysis

  • Criss-Cross segment analysis (e.g. Product X Application)

  • Competitive Product Benchmarking

  • Geographic Analysis

  • Additional countries in any of the regions

  • Customized Data Representation

  • Detailed analysis and profiling of additional market players


An accurate research report requires proper strategizing as well as implementation. There are multiple factors involved in the completion of good and accurate research report and selecting the best methodology to compete the research is the toughest part. Since the research reports we provide play a crucial role in any company’s decision-making process, therefore we at SNS Insider always believe that we should choose the best method which gives us results closer to reality. This allows us to reach at a stage wherein we can provide our clients best and accurate investment to output ratio.

Each report that we prepare takes a timeframe of 350-400 business hours for production. Starting from the selection of titles through a couple of in-depth brain storming session to the final QC process before uploading our titles on our website we dedicate around 350 working hours. The titles are selected based on their current market cap and the foreseen CAGR and growth.


The 5 steps process:

Step 1: Secondary Research:

Secondary Research or Desk Research is as the name suggests is a research process wherein, we collect data through the readily available information. In this process we use various paid and unpaid databases which our team has access to and gather data through the same. This includes examining of listed companies’ annual reports, Journals, SEC filling etc. Apart from this our team has access to various associations across the globe across different industries. Lastly, we have exchange relationships with various university as well as individual libraries.

Secondary Research

Step 2: Primary Research

When we talk about primary research, it is a type of study in which the researchers collect relevant data samples directly, rather than relying on previously collected data.  This type of research is focused on gaining content specific facts that can be sued to solve specific problems. Since the collected data is fresh and first hand therefore it makes the study more accurate and genuine.

We at SNS Insider have divided Primary Research into 2 parts.

Part 1 wherein we interview the KOLs of major players as well as the upcoming ones across various geographic regions. This allows us to have their view over the market scenario and acts as an important tool to come closer to the accurate market numbers. As many as 45 paid and unpaid primary interviews are taken from both the demand and supply side of the industry to make sure we land at an accurate judgement and analysis of the market.

This step involves the triangulation of data wherein our team analyses the interview transcripts, online survey responses and observation of on filed participants. The below mentioned chart should give a better understanding of the part 1 of the primary interview.

Primary Research

Part 2: In this part of primary research the data collected via secondary research and the part 1 of the primary research is validated with the interviews from individual consultants and subject matter experts.

Consultants are those set of people who have at least 12 years of experience and expertise within the industry whereas Subject Matter Experts are those with at least 15 years of experience behind their back within the same space. The data with the help of two main processes i.e., FGDs (Focused Group Discussions) and IDs (Individual Discussions). This gives us a 3rd party nonbiased primary view of the market scenario making it a more dependable one while collation of the data pointers.

Step 3: Data Bank Validation

Once all the information is collected via primary and secondary sources, we run that information for data validation. At our intelligence centre our research heads track a lot of information related to the market which includes the quarterly reports, the daily stock prices, and other relevant information. Our data bank server gets updated every fortnight and that is how the information which we collected using our primary and secondary information is revalidated in real time.

Data Bank Validation

Step 4: QA/QC Process

After all the data collection and validation our team does a final level of quality check and quality assurance to get rid of any unwanted or undesired mistakes. This might include but not limited to getting rid of the any typos, duplication of numbers or missing of any important information. The people involved in this process include technical content writers, research heads and graphics people. Once this process is completed the title gets uploader on our platform for our clients to read it.

Step 5: Final QC/QA Process:

This is the last process and comes when the client has ordered the study. In this process a final QA/QC is done before the study is emailed to the client. Since we believe in giving our clients a good experience of our research studies, therefore, to make sure that we do not lack at our end in any way humanly possible we do a final round of quality check and then dispatch the study to the client.