Screw Top Jar Market Report Scope And Overview:
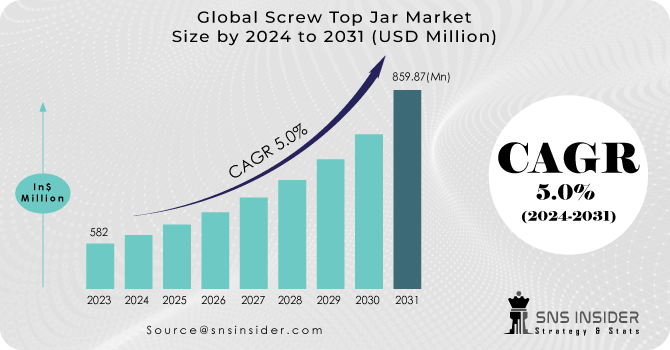
The Screw Top Jar Market size was USD 582 million in 2023 and is expected to Reach USD 859.87 million by 2031 and grow at a CAGR of 5.0% over the forecast period of 2024-2031.
The thriving healthcare sector is positioned to boost sales of screw top jars and provide abundant growth prospects for manufacturers in this industry. The healthcare sector is experiencing rapid growth globally, projected to expand by 7% through 2026 according to research conducted by the World Health Organization (WHO). This trend is expected to create favorable growth opportunities for manufacturers of screw top jars. The increasing incidence of various health conditions like diabetes, hypertension, and dermatitis is fueling the sales of medications such as tablets and ointments. Consequently, this trend is expected to influence the demand for screw top jars.
Get More Information on Screw Top Jar Market - Request Sample Report
In recent years, the cosmetics & personal care sector has experienced significant growth driven by rapid urbanization and increasing consumer expenditure. People worldwide are investing substantially in cosmetics & personal care products. For example, according to the L’Oreal 2021 Annual Report, the global cosmetics sector achieved a valuation of 228 billion euros. Consequently, there is a surge in demand for packaging solutions like screw top jars, which are extensively utilized for the storage and protection of a diverse range of cosmetic & personal care products.
MARKET DYNAMICS
KEY DRIVERS:
-
The global screw-top jar market is expected to expand significantly due to its increasing utilization across various applications.
Screw-top jars have emerged as a favored packaging choice across a range of products, spanning from coffee and spices to cosmetics, surpassing alternative packaging methods due to their numerous benefits. These jars are increasingly preferred for everyday use due to their convenience, versatility, lightweight design, and ability to securely store food items, ensuring freshness with their inner and outer closures.
-
Plastic screw top jars are ideal for transporting food products due to their lighter weight compared to glass and enhanced safety features.
RESTRAIN:
-
The adverse environmental impacts of the material influence the screw-top jar market.
-
The high cost and limited availability of raw materials, coupled with a shortage of labor in developed economies, will also serve as constraints.
OPPORTUNITY:
-
The healthcare and pharmaceutical sectors' adoption of screw top jars is boosting demand and creating lucrative market opportunities.
This heightened interest is primarily due to the jars' capability to safeguard the chemical integrity of medications. By providing secure seals, screw top jars help to maintain the potency and effectiveness of pharmaceutical products over extended periods, thus extending their shelf life. As pharmaceutical companies prioritize product safety and efficacy, the adoption of screw top jars as packaging solutions becomes increasingly favored.
-
Urbanization and increasing affluence are altering consumer purchasing behaviors, leading to a heightened demand for high-end screw top jars for everyday use.
CHALLENGES:
-
Market saturation and the need for continuous innovation pose significant hurdles for industry players.
-
The emergence of alternative products in the market acts as a constraint, redirecting consumer focus and influencing the demand for Screw Top Jar products.
IMPACT OF RUSSIAN UKRAINE WAR
The conflict in the Black Sea region led to a rise in energy and commodity prices, resulting in increased costs for grain and oilseeds. The imposition of martial law in Ukraine on February 25 compelled several facilities, including Karpatneftekhim, the country's largest petrochemical (PET) plant, to suspend operations. The continuing conflict is prompting companies with significant financial connections to the region to assess the potential long-term impact it may have on their operations. Mondi, a specialist in paper and packaging and the parent company of Mondi Syktyvkar, has halted operations at its paper bag plant in Lviv, Ukraine. Packaging materials, including glass containers, demand energy for production, with some materials requiring more energy than others. For instance, glass containers rely on oil and gas during manufacturing. Any increase in oil prices will impact these materials, albeit indirectly, as they are interconnected along the supply chain. Collectively hamper the screw top jar market.
IMPACT OF ECONOMIC SLOWDOWN
Economic downturns and reductions in consumer spending present obstacles to market expansion, affecting the demand for Screw Top Jar products. Businesses may encounter difficulties in managing inventory levels as demand fluctuates during economic slowdowns, potentially leading to overstocking or understocking of screw top jars. Economic downturns can influence consumer preferences and priorities, potentially leading to shifts away from certain types of packaging, including screw top jars, in favor of more cost-effective alternatives.
KEY MARKET SEGMENTS
By Material
-
Plastic
-
Glass
-
Metal
The plastic segment held the majority share, accounting for 58.8% of the screw top jar market. Plastic is favored over glass due to its cost-effectiveness and availability in various forms such as Poly Propylene (PP), Low Density Polyethylene (LDPE), and High Density Polyethylene (HDPE). Plastic jars also offer a longer lifespan compared to glass jars, as they are less prone to breakage.
By Capacity
-
Less than 50 ml
-
51 to 200 ml
-
201 to 500 ml
-
501 to 1000 ml
-
1000 ml and above
The 51 to 200 ml segment is expected to lead the target market throughout the forecast period, capturing approximately 34.5% of the screw top jar industry. Screw top jars ranging from 51 to 200 ml in capacity are versatile and widely used across various industries, particularly by cosmetics and food & beverage manufacturers.
By Product
-
Oilseeds
-
Cereals
-
Others
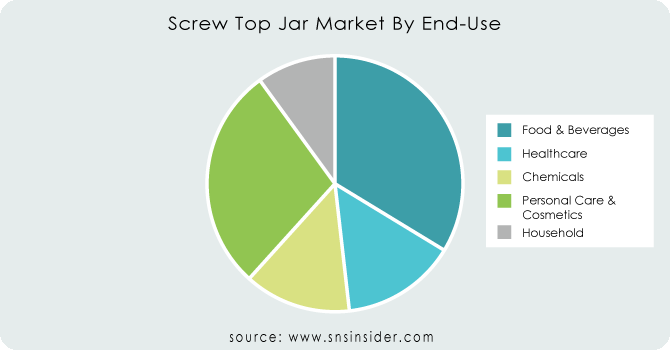
By End-use
-
Food & Beverages
-
Healthcare
-
Chemicals
-
Personal Care & Cosmetics
-
Household
The healthcare & pharmaceuticals and personal care sectors hold the largest market shares in the screw top jar market, accounting for 30.5% and 28.3%, respectively. Plastic, glass, or acrylic jars are utilized for their aesthetic appeal across various applications, including personal care, healthcare & pharmaceuticals, food & beverage, and household uses.
Get Customized Report as per Your Business Requirement - Request For Customized Report
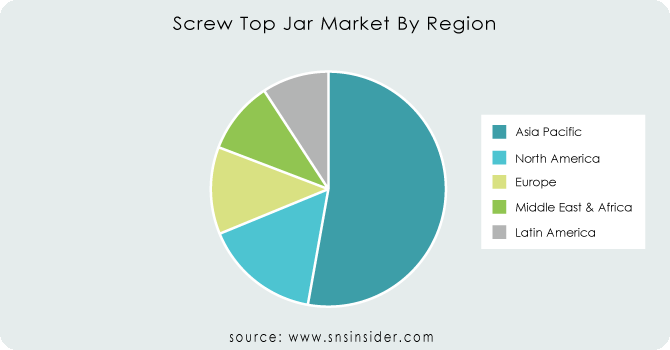
REGIONAL ANALYSIS
The Asia-Pacific region emerges as the dominant player in the screw top jar market in terms of market share 52%. This is attributed to the rising demand for screw top jars in this region. Within the Asia-Pacific region, India and China stand out, being at the forefront due to their advantages of low labor and manufacturing costs. Numerous major players across various sectors are redirecting their production units to the Asia Pacific region, drawn by the availability of inexpensive labor and the rapidly growing economic growth rate, along with flourishing manufacturing industries. Some notable key players are channeling their efforts towards innovation initiatives and allocating resources to technology development.
North America is projected to experience the most rapid growth during the forecasted period, driven by the presence of prominent market players and the burgeoning food and beverage industry in this region. The strong expansion of the cosmetics industry in the United States is anticipated to drive the need for screw top jars as a packaging option. As per the International Trade Administration (ITA), the United States ranks as one of the primary producers and exporters of cosmetic products worldwide. Notably, exports of cosmetics from the United States experienced an annual growth rate of 2% from 2017 to 2019, reaching approximately US$ 15.04 billion.
REGIONAL COVERAGE:
North America
-
US
-
Canada
-
Mexico
Europe
-
Eastern Europe
-
Poland
-
Romania
-
Hungary
-
Turkey
-
Rest of Eastern Europe
-
-
Western Europe
-
Germany
-
France
-
UK
-
Italy
-
Spain
-
Netherlands
-
Switzerland
-
Austria
-
Rest of Western Europe
-
Asia Pacific
-
China
-
India
-
Japan
-
South Korea
-
Vietnam
-
Singapore
-
Australia
-
Rest of Asia Pacific
Middle East & Africa
-
Middle East
-
UAE
-
Egypt
-
Saudi Arabia
-
Qatar
-
Rest of Middle East
-
-
Africa
-
Nigeria
-
South Africa
-
Rest of Africa
-
Latin America
-
Brazil
-
Argentina
-
Colombia
-
Rest of Latin America
Key players
Major players in Screw Top Jar Market are Ardagh Group S.A, Gulf glass manufacturing CO. KSC, SKS Bottle and Packaging, Inc, Hukam Chand Yash pal, HEINZ-GLAS GmbH & Co. KGaA ,Klar glass Sp.z.o.o., The Container Store Inc., Le Parfait, Verallia, Auer Packaging and others.
Ardagh Group S.A-Company Financial Analysis
RECENT DEVELOPMENT
-
In June 2023, Cameo Metal Products revealed a collaboration with the online storefront Impacked to introduce a series of aluminum jar covers paired with corresponding glass jars.
-
In May 2023, Ardagh Group disclosed a partnership with Newell to create the Ball® Honeybee Keepsake Mason Jars.
-
In February 2023, Aegg Ltd. unveiled three new screw-top jars engineered with reduced glass usage.
-
In 2019, Auer Packaging announced plans to build its third production hall in Amerang. This new hall will feature architecture similar to the company's existing halls and will add an additional 3,000 m2 of production space.
| Report Attributes | Details |
|---|---|
| Market Size in 2023 | US$ 582 Million |
| Market Size by 2031 | US$ 859.87 Million |
| CAGR | CAGR of 5.0 % From 2024 to 2031 |
| Base Year | 2023 |
| Forecast Period | 2024-2031 |
| Historical Data | 2020-2022 |
| Report Scope & Coverage | Market Size, Segments Analysis, Competitive Landscape, Regional Analysis, DROC & SWOT Analysis, Forecast Outlook |
| Key Segments | • By Material(Plastic, Glass, Metal) • By Capacity (Less Than 50 Ml, 51 To 200 Ml, 201 To 500 Ml, 501 To 1000 Ml, 1000 Ml And Above) • By Product (Oilseeds, Cereals, Others) • By End-Use(Food & Beverages, Healthcare, Chemicals, Personal Care & Cosmetics, Household) |
| Regional Analysis/Coverage | North America (US, Canada, Mexico), Europe (Eastern Europe [Poland, Romania, Hungary, Turkey, Rest of Eastern Europe] Western Europe] Germany, France, UK, Italy, Spain, Netherlands, Switzerland, Austria, Rest of Western Europe]), Asia Pacific (China, India, Japan, South Korea, Vietnam, Singapore, Australia, Rest of Asia Pacific), Middle East & Africa (Middle East [UAE, Egypt, Saudi Arabia, Qatar, Rest of Middle East], Africa [Nigeria, South Africa, Rest of Africa], Latin America (Brazil, Argentina, Colombia, Rest of Latin America) |
| Company Profiles | Ardagh Group S.A, Gulf glass manufacturing CO. KSC, SKS Bottle and Packaging, Inc, Hukam Chand Yash pal, HEINZ-GLAS GmbH & Co. KGaA ,Klar glass Sp.z.o.o., The Container Store Inc., Le Parfait, Verallia, Auer Packaging |
| Key Drivers | • The global screw-top jar market is expected to expand significantly due to its increasing utilization across various applications. • Plastic screw top jars are ideal for transporting food products due to their lighter weight compared to glass and enhanced safety features. |
| Restraints | • The adverse environmental impacts of the material influence the screw-top jar market. • The high cost and limited availability of raw materials, coupled with a shortage of labor in developed economies, will also serve as constraints. |
Frequently Asked Questions
Ans: The Asia-pacific region held the largest market share and will continue to dominate the market.
Ans: The adverse environmental impacts of the material influence the screw-top jar market.
Ans: A key driver is the global screw-top jar market is expected to expand significantly due to its increasing utilization across various applications.
Ans: The Screw Top Jar Market size was USD 582 million in 2023 and is expected to Reach USD 859.87 million by 2031.
Ans: The Screw Top Jar Market is expected to grow at a CAGR of 5.0 %.
Get in Touch
