Security Screening Market Report Scope & Overview:
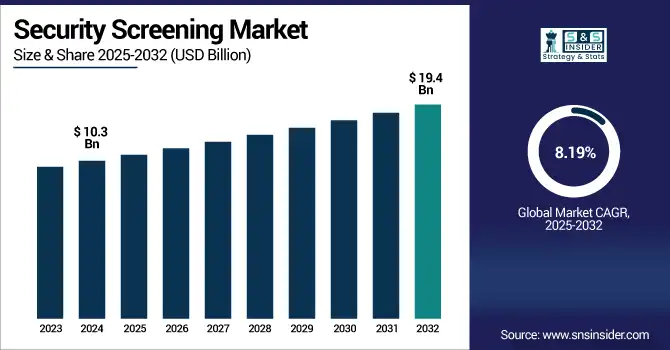
The security screening market size was valued at USD 10.3 billion in 2024 and is expected to reach USD 19.4 billion by 2032, growing at a CAGR of 8.19% during 2025-2032.
To Get more information on Security-Screening-Market - Request Free Sample Report
Security Screening Market growth is driven by the global rise of terrorism and smuggling across borders, and the access to critical infrastructure and places. For enhancing public safety at airports, border checkpoints, seaports, and likewise high-security facilities, governments and private sectors are making gigantic investments on cutting-edge screening technologies, comprising of X-ray scanners, biometric systems, explosive trace detectors, and so on. Also, an increasing number of AI and machine learning-based solutions for threat detection and automation in the screening process are driving the growth of the global proximity card market. Moreover, urbanisation, expansion of airports, and an increase in air travel also drive demand. On the flip side, technological innovations that offer more speed and precision in the screening solution are also an important part of the ingredient.
In the U.S. Security Screening Market, growth is driven by Demand for enhanced screening processes at public places, coupled with a need to strengthen airport security to comply with stringent airport security mandates, acceleration in demand for government infrastructure protection. The market was valued at USD 3.2 billion in 2024 and is expected to reach USD 5.4 billion by 2032, growing at a CAGR of 6.9%. A key Security Screening Market trend in the U.S. is the combination of AI-based threat detection and touchless screening technologies.
Market Dynamics:
Drivers:
-
Rising Global Threats Lead to Security Technology Adoption
The continuous increase in cross-border terrorism, border smuggling, and transnational corporate crime is one of the main factors attributed to the growth of the Security Screening Market. Global governments are massively increasing on investment in highly scalable advanced detection and surveillance technologies at airports, seaports, border checkpoints, and target-specific key public venues. Explosives, weapons, and narcotics incidents have necessitated stringent security regulations and the need for a quick and effective screening infrastructure. Specifically, rising geopolitical tensions and growing mass gathering activities are driving the need for continuous automated and smart real-time threat detection systems. Public and private sector organizations prioritizing safety are deploying modern security screening systems integrated with AI to upgrade their legacy systems.
In 2024, the U.S. experienced only three verified terrorist attacks, resulting in one fatality, marking the lowest annual terror-related death toll since 2010
Restraints:
-
High Costs and Privacy Risks Slow Market Penetration
The high cost of procurement, installation, and maintenance of advanced security screening systems has been a barrier to adoption in developing countries or smaller institutions. Advanced scanners based on millimeter-wave or backscatter X-rays require major capital investment. Furthermore, the user as well as the regulatory bodies resist biometric data collection, facial recognition, and body scanners because of privacy concerns. While it has elicited concerns over privacy invasion, leading to increases in legal arrangements and requirements for the establishment of data protection systems related to such technologies. This can hinder deployments, especially in areas with restricted cybersecurity support and in areas where privacy laws are tight. A persistent constraint is the balance between security requirements and costs, and ethics.
Opportunities:
-
AI Integration Enhances Screening Speed and Accuracy
The growing AI, machine learning, and automation provide ample opportunities for the Security Screening Market, Major Challenges. Such technologies facilitate better, quicker, and reliable detection of hidden weapons, explosives, and contraband with little possibility of human error. Smart screening systems can analyze huge amounts of data, identify behavioural anomalies, and in the case of a change in the threatscape, actually respond in mixed frequencies. Further, the automation enables Contactless, Seamless security checks — a need of the post-pandemic world. Finally, the added benefits of predictive analytics and cloud threat monitoring provide businesses with centralized control over their cybersecurity and an improved ability to respond to threats. Provided that initial costs of implementation can be kept pocket-friendly, AI-powered screening systems with modular upgrades can draw on these trends, particularly, covering urban infrastructure, transport, and/or defence is a critical need for high-potential vendors.
82% of security professionals report that AI improves threat detection accuracy, with systems identifying 30–50% more threats than traditional methods
Challenges:
-
System Incompatibility Hampers Operational Efficiency
The integration of security systems, such as video surveillance, biometric access control, baggage screening, et cetera, into a single platform is one of the key challenges faced by the Security Screening Market. Legacy systems are often not designed to integrate with newer digital technologies, leading to operational silos and friction. Such interoperability problems can impact the detection of threats, slow down the response time, and raise the security risk. Furthermore, public-sector procurement lags and complicated regulatory approvals also make it problematic to upgrade the systems. The need to enable real-time communication between disparate technologies, in a manner that upholds the integrity of the data, is a great cybersecurity challenge. This calls for and demands open-architecture solutions, robust APIs & global adherence to interoperability standards so that unified and scalable screening ecosystems can be composed and de-composed as required.
Segmentation Analysis:
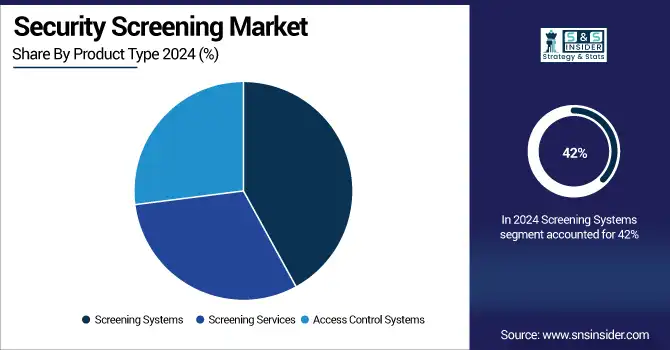
By Product Type:
Screening Systems dominated the market in 2024 and accounted for 42% of the Security Screening Market share. they are widely used in airports, borders, and high-security facilities. High demand for X-ray, metal detection, and millimeter-wave scanners due to increasing global threats and regulatory mandates supports adoption. Infrastructure security is expected to remain steadfast through 2032, with stable double-digit growth of security upgrades in equipment by region.
In April 2025, TSA initiated pilots using AI and virtual reality to assist screeners in luggage x‑ray interpretation and threat evaluation, improving accuracy and reducing training time
Access control systems are expected to register the fastest CAGR, attributed to the rapidly expanding demand for biometric authentication, facial recognition, and contactless entry. Health concerns, upgrades of security in corporate facilities, and projects on smart city are speeding up the adoption. This segment will witness a staggering footprint expansion with the integration of AI and cloud-based identity management by 2032, primarily across commercial and public transportation.
By Technology:
X-ray Screening led the security screening market in 2024 and held the revenue share of more than 39%, owing to its high prevalence for baggage and parcel inspection at airports, customs, and logistics. It is indispensable due to its reliability, scalability, and ability to detect concealed objects in high-throughput. This segment is expected to be at the forefront through 2032, with continuous advancements in AI image analysis and 3D scanning likely to propel this segment forward, especially in aviation and cargo security.
In March 2025, DHS Science & Technology’s “Screening at Speed” program introduced a truck-mounted mobile X‑ray screening system, enabling field-deployable, high-throughput inspections at border checkpoints and temporary security sites
Biometric Screening is expected to register the fastest CAGR as it has been extensively used across airports, customs, and logistics for baggage and parcel inspection purposes. It has become essential due to its reliability, scalability, and ability to detect hidden cavities at high volumes. AI Image analysis and 3D scanning upgrades in the upcoming years are likely to maintain this segment on top through 2032, with a major share of this segment associated with aviation and cargo security.
By Application:
Airport Security dominated the security screening market in 2024 and accounted for a significant revenue share, due to complex regulatory frameworks for international air traffic, increasing air passenger traffic, and ongoing investment in advanced baggage and passenger screening systems. Demand will remain strong for AI-powered CT scanners, biometric verification, and explosive detection systems. This segment will continue to remain the largest throughout the forecast period, attributed to the seamless high-throughput security being prioritized at airports across the globe.
Public Places & Events are expected to record the fastest CAGR, due to increasing threats in public events like stadiums, concerts, arenas, and executive gatherings. Public Places & Events will be governed in terms of the CAGR of the market. Crowd safety concerns and growing urban surveillance initiatives are acting as catalysts for its adoption. By 2032, cities and event organizers, rethinking their approach to instantaneous threat neutralization, will deploy mobile scanners, walk-through detectors and facial recognition systems more readily
By End-User:
The government segment dominated the security screening market and accounted for the largest share in 2024, owing to its prominent usage in airports, border control, embassies, correctional facilities, and other national critical infrastructures. Security of the homeland and anti-terrorism driven sectors of the national security and national defense are primary reasons for investments. Biometric screening, AI-based threat detection, and non-intrusive inspection technologies, continuous investments in this segment will sustain the leading position in adoption through 2032
The Commercial segment is expected to register the fastest CAGR, owing to increasing security requirements at malls, corporate campuses, party halls, and data centers. Under the influence of increasing threats, high foot traffic, and regulatory pressure, many businesses are moving towards the use of smart screening systems. Facial recognition, access control, and touchless technology incorporation will spur rapid growth in the commercial market from 2023 to 2032.
Regional Analysis:
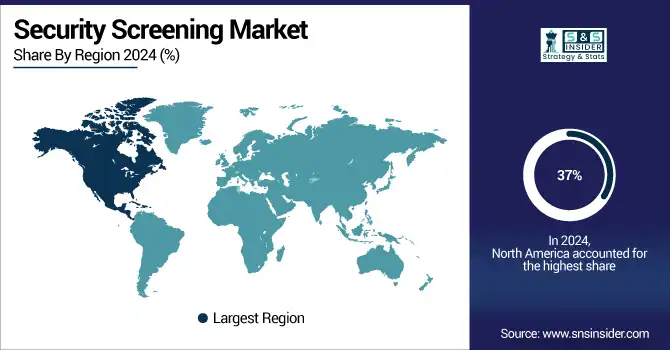
North America dominated the security screening market in 2024 and accounted for 37% of revenue share, owing to its highly technological advanced security infrastructure, vast government investment in homeland security, and adoption of AI-based screening technologies that ai-based. Demand continues to be fueled by major airport renovations, stringent TSA mandates, and modernization of border patrol methods. North America will continue its leadership with ongoing investments in smart surveillance and terrorist counter initiatives that will persist to 2032.
According to a security screening market, Asia-Pacific is projected to register the fastest CAGR driven by rising terrorism-related violence in countries such as India, China, and southeast Asia. The smart city programs, escalating cross-border tensions, and rising adoption of biometric and AI-based screening systems will drive robust market growth through 2032 across public, transportation, and critical infrastructure sectors.
Europe's security screening market is expanding due to the European Union (EU) safety regulations, growing terror threats on the continent, and surging adoption of smart surveillance technologies, including screening solutions for critical infrastructure and public venues, are some of the factors bolstering growth in the regional market. Acceptance of AI-powered screening solutions in airports and border controls is propelling regional growth through 2032.
Germany leads the European security screening market, based on strong regulations, robust enforcement, and an advanced industrial base. Germany is a leading market for European security screening. Airport security modernization efforts are also well underway. AI powered X-ray screening at transport hubs, biometric scanners at transportation hubs, correctional facilities, and commercial zones will enhance the overall market status through such strategic initiatives and smart infrastructure programs.
Get Customized Report as per Your Business Requirement - Enquiry Now
Key Players:
The major security screening market companies are Smiths Detection, OSI Systems, Inc. (includes Rapiscan Systems and American Science and Engineering), Leidos Holdings, Inc., Thales Group, FLIR Systems (a Teledyne Technologies company), Rohde & Schwarz GmbH & Co KG, Analogic Corporation, Autoclear, LLC, Nuctech Company Limited, Astrophysics Inc., Ceia S.p.A., 3DX-RAY Ltd., VOTI Detection Inc., Gilardoni S.p.A., Adani Systems, Inc., Tek84 Inc., Unival Group GmbH, Aventura Technologies, Inc., Liberty Defense Technologies, Inc., Integrated Defense and Security Solutions (IDSS) and others.
Recent Developments:
-
In March 2025, Smiths Detection formed a strategic partnership with Deepnoid to integrate AI into its HI-SCAN 6040-2is, boosting X-ray screening efficiency.
-
In January 2025, Smiths Group announced the planned demerger or sale of Smiths Detection by end of 2025 to streamline operations and unlock shareholder value.
|
Report Attributes |
Details |
|
Market Size in 2024 |
US$ 10.3 Billion |
|
Market Size by 2032 |
US$ 19.3 Billion |
|
CAGR |
CAGR of 8.19% From 2025 to 2032 |
|
Base Year |
2024 |
|
Forecast Period |
2025-2032 |
|
Historical Data |
2021-2023 |
|
Report Scope & Coverage |
Market Size, Segments Analysis, Competitive Landscape, Regional Analysis, DROC & SWOT Analysis, Forecast Outlook |
|
Key Segments |
• By Product Type (Screening Systems, Screening Services, Access Control Systems) |
|
Regional Analysis/Coverage |
North America (US, Canada), Europe (Germany, France, UK, Italy, Spain, Poland, Rest of Europe), Asia Pacific (China, India, Japan, South Korea, ASEAN Countries, Australia, Rest of Asia Pacific), Middle East & Africa (UAE, Saudi Arabia, Qatar,Egypt, South Africa, Rest of Middle East & Africa), Latin America (Brazil, Argentina, Mexico, Colombia, Rest of Latin America) |
|
Company Profiles |
Smiths Detection, OSI Systems, Inc. (includes Rapiscan Systems and American Science and Engineering), Leidos Holdings, Inc., Thales Group, FLIR Systems (a Teledyne Technologies company), Rohde & Schwarz GmbH & Co KG, Analogic Corporation, Autoclear, LLC, Nuctech Company Limited, Astrophysics Inc., Ceia S.p.A., 3DX-RAY Ltd., VOTI Detection Inc., Gilardoni S.p.A., Adani Systems, Inc., Tek84 Inc., Unival Group GmbH, Aventura Technologies, Inc., Liberty Defense Technologies, Inc., Integrated Defense and Security Solutions (IDSS) and others in the report |
Frequently Asked Questions
Ans- The North America region dominated the Security Screening Market with 37% of revenue share in 2024.
Ans- Airport Security dominated the security screening market in 2024 and accounted for a significant revenue share
Ans- Rising Global Threats Lead to Security Technology Adoption
Ans- The security screening market size was valued at USD 10.3 billion in 2024 and is expected to reach USD 19.4 billion by 2032
Ans- The expected CAGR of the Security Screening Market over 2025-2032 is 8.19%.
Get in Touch
