Insurtech Market Report Scope & Overview:
The Insurtech Market is estimated at USD 19.29 billion in 2025E and is expected to reach USD 580.36 billion by 2033, growing at a CAGR of 53.03 % from 2026-2033.
The insurtech market, which merges insurance with technology, has recently seen notable growth and change. Advances in digital technology, data analytics, and artificial intelligence are transforming traditional insurance models. Major factors driving this growth include the rising demand for tailored insurance products, the widespread use of smartphones and connected devices, and increasing expectations for smooth digital interactions. Innovations like telematics, which uses vehicle data for customized premiums, and blockchain, which improves transparency and efficiency in claims processing, are reshaping the industry. Additionally, the focus on customer-oriented solutions and the drive for operational efficiency are leading insurance companies to invest in digital tools and platforms. As insurtech evolves, incorporating machine learning, big data, and IoT will likely spur further innovation, enhance risk assessment, and improve customer engagement.
Insurtech Market Size and Forecast:
-
Market Size in 2025E: USD 19.29 Billion
-
Market Size by 2033: USD 580.36 Billion
-
CAGR: 53.03% from 2025 to 2032
-
Base Year: 2025
-
Forecast Period: 2026–2033
-
Historical Data: 2022–2024

Get More Information on Insurtech Market - Request Sample Report
Key Trends in the Insurtech Market:
-
AI- and ML-driven underwriting and claims automation for faster processing.
-
Growing adoption of blockchain for fraud detection and secure policy management.
-
Expansion of on-demand and usage-based insurance models (e.g., pay-per-use).
-
Increased integration with IoT devices, telematics, and wearables for risk assessment.
-
Rising popularity of embedded insurance within digital platforms and ecosystems.
-
Focus on hyper-personalized insurance products tailored to individual needs.
-
Use of big data and predictive analytics for dynamic pricing and risk evaluation.
The U.S. Insurtech market size was valued at an estimated USD 8.25 billion in 2025 and is projected to reach USD 250.80 billion by 2033, growing at a CAGR of 52.7% over the forecast period 2026–2033. Market growth is driven by rapid digital transformation across the insurance industry, increasing adoption of AI, big data analytics, blockchain, and cloud technologies to enhance underwriting, claims processing, and customer experience. Rising consumer demand for personalized, on-demand insurance products, along with the expansion of digital-first and usage-based insurance models, is accelerating market expansion. Additionally, strong venture capital investments, partnerships between traditional insurers and technology startups, and supportive regulatory frameworks further reinforce the robust growth outlook of the U.S. insurtech market during the forecast period.
Insurtech Market Drivers:
-
Insurtech solutions help to reduce operational costs and streamline processes, increasing insurance companies' profitability.
-
Growing venture capital and investment in insurtech startups are driving innovation and market growth.
-
Innovations in artificial intelligence, machine learning, and blockchain are enabling more efficient and effective insurance solutions.
Recent advancements in artificial intelligence (AI), machine learning (ML), and blockchain are significantly enhancing the efficiency and effectiveness of insurance solutions. AI and ML technologies are transforming how insurers process data, assess risk, and handle claims. According to research, AI-driven tools can reduce the time required for claims processing by up to 30%, and ML algorithms improve underwriting accuracy by analyzing vast amounts of data more effectively than traditional methods. For instance, companies like Lemonade are leveraging AI to automate claims approval, resulting in claims being paid in as little as three seconds.
Blockchain technology is also making a substantial impact by providing a decentralized and transparent ledger for transactions. A 2024 report from Deloitte highlights that blockchain can enhance transparency and reduce fraud in the insurance industry. Blockchain’s ability to securely store and verify transactions helps in streamlining processes like policy issuance and claims management. For example, Insurwave, a platform developed by EY and Guardtime, uses blockchain to manage marine insurance contracts, improving efficiency and reducing administrative costs.
These technological innovations are not just theoretical; they are actively reshaping the insurance landscape. A 2024 survey by Accenture found that 45% of insurers are already investing in AI and blockchain technologies, with 35% expecting to see a return on investment within the next three years. These advancements are paving the way for more accurate risk assessment, quicker claims resolution, and a more streamlined customer experience, ultimately driving the growth and modernization of the insurtech market.
Insurtech Market Restraints:
-
Dependency on advanced technologies that may fail or underperform.
-
Challenges in handling sensitive customer information securely.
-
High competition and market fullness in developed regions.
In the insurtech market, high competition and market saturation, especially in developed regions like North America and Europe, pose significant challenges. Numerous startups and established players are competing for market share, leading to strong competition. This saturation makes it difficult for new entrants to differentiate themselves, attract customers, and achieve growth. Insurtech companies must continuously innovate and provide unique value propositions to stand out, often leading to high marketing and operational costs. Furthermore, established insurers are rapidly adopting digital strategies, further intensifying the competitive landscape. As a result, insurtech firms struggle to maintain profitability and secure long-term sustainability. This competitive pressure also forces companies to offer lower prices and enhanced services, which can squeeze profit margins. Ultimately, market saturation limits growth opportunities, making it crucial for insurtech companies to find niche markets or expand to emerging regions to sustain their business.
Insurtech Market Segmentation Analysis:
By Type, Health Insurance Leads the Market, While Home Insurance Poised for Fastest Growth
With more than 23.5% share of the global revenue, the health segment dominated the market in 2025. The rising demand for digital platforms, which connect exchanges, brokers, providers, and carriers in health insurance, is anticipated to boost the demand for the health segment. Insurers are increasingly integrating mobility features into their health insurance services to enhance convenience.
The home insurance segment is expected to experience the most significant growth during the forecast period. Many home insurance providers are developing innovative products tailored for both commercial and residential real estate professionals, as well as their tenants and residents. These companies are embracing insurtech solutions to reduce the time from listing to leasing. By leveraging AI technology, these solutions offer personalized insurance policies and manage claims efficiently, eliminating the need for insurance brokers.
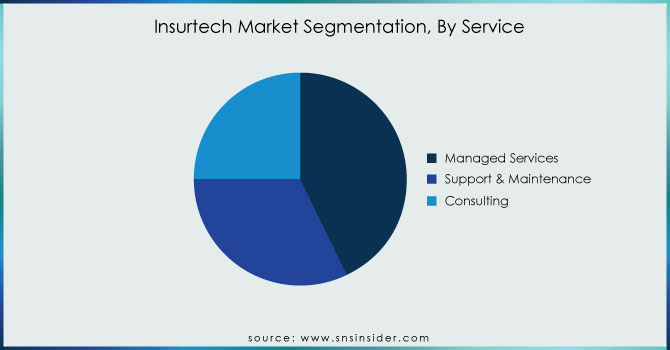
By Service, Managed Services Dominate, Support & Maintenance to Witness Strongest Growth
In 2025, the managed services segment captured the largest revenue share, exceeding 43.2%. Managed services providers offer insurers a strategic path to transformation by combining their expertise and talent with cutting-edge technologies. They also supply insurers with optimal processes, best practices, and regulatory guidance. Additionally, managed services help insurers tackle IT and operational challenges while seizing new opportunities in the insurance sector.
The support and maintenance segment is expected to register the highest growth over the forecast period. The expansion of the support and maintenance segment is driven by the rising adoption of advanced technologies and distribution channels among insurance companies. Many insurers worldwide are concentrating on implementing cutting-edge technology and tailoring legacy software to meet their specific requirements.
Need any customization research on Insurtech Market - Enquiry Now
By Technology, Cloud Computing Leads the Market, Blockchain Set for Fastest Growth
The cloud computing segment dominated the market with a revenue share more than of 24.3% in 2025. Cloud computing has revolutionized the insurance industry through its versatility, ease of implementation, and flexibility. The increasing adoption of Bring Your Device (BYOD) policies, along with the rising volume of data collected by insurance companies, is projected to fuel growth. Simultaneously, collaborations between cloud computing solution providers and insurance companies are boosting the development of insurtech products, which is anticipated to spur market growth. For instance, in November 2023, Amazon Web Services Inc. announced that American International Group, Inc. had selected it as their preferred public cloud provider. This partnership is intended to help American International Group improve its services for customers.
The blockchain segment is expected to account for the highest growth during the forecast period. Blockchain technology allows insurance companies to reduce operational costs and enhance operational efficiencies. this technology can fuel growth, unify diverse insurtech platforms, and facilitate the introduction of new services, especially for individuals who previously lacked access to insurance.
By End-User, BFSI Dominates, Healthcare Expected to Witness Strongest Growth
In 2025, the BFSI segment led the market, capturing over 20.5% of the global revenue share. BFSI companies are increasingly adopting insurtech solutions to enhance business efficiency. The rise in connected devices within the BFSI sector is generating substantial amounts of data. Insurance companies have recognized the potential of this data to improve services, reduce costs, gain valuable insights, and increase revenue.
The healthcare segment is anticipated to register the fastest growth during the forecast period 2026-2033. The increasing digitization within the insurance sector is likely to accelerate the adoption of insurtech solutions in the healthcare industry. The expansion of devices has led to a greater need for efficient monitoring, management, and maintenance of data across healthcare organizations.
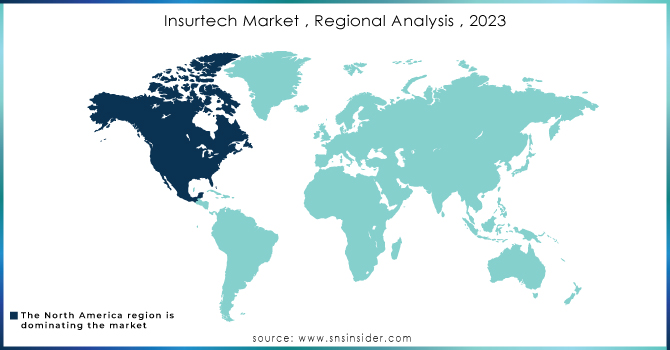
North America Dominates the Insurtech Market in 2025E
In 2025E, North America commands an estimated 41% share of the global Insurtech Market, solidifying its leadership position. The region’s dominance is driven by strong adoption of digital insurance platforms, high venture capital funding, and a robust insurance ecosystem. The rapid integration of AI, blockchain, and cloud computing into insurance services enables operational efficiency and enhanced customer experiences. With a mature financial infrastructure and favorable regulatory support, North America remains the largest contributor to insurtech innovation, driving global adoption and market growth.
United States Leads North America’s Insurtech Market
The United States dominates due to its advanced technological ecosystem, extensive insurance industry, and high consumer demand for digital-first insurance solutions. Major U.S.-based startups and established insurers are leveraging artificial intelligence, data analytics, and blockchain to improve efficiency, reduce fraud, and personalize offerings. The U.S. also benefits from significant venture capital funding, government support for digital transformation, and strong partnerships between insurtech startups and traditional insurers. With widespread smartphone penetration and tech-savvy consumers, the United States stands as the primary driver of North America’s insurtech market leadership in 2024.
Asia Pacific is the Fastest-Growing Region in the Insurtech Market in 2025
The Asia Pacific Insurtech Market is projected to grow at a remarkable 56% CAGR from 2026 to 2033. Growth is fueled by rapid digitization, expanding mobile penetration, and increasing adoption of IoT and AI across insurance services. Rising middle-class populations, strong government-backed fintech initiatives, and the popularity of mobile-based microinsurance further accelerate the region’s expansion. Countries like China, India, and Japan are actively integrating digital insurance into mainstream financial systems, making Asia Pacific the fastest-growing hub for insurtech adoption worldwide.
China Leads Asia Pacific’s Insurtech Market
China dominates due to its massive smartphone penetration, thriving fintech ecosystem, and strong government support for digital finance innovation. Leading technology giants such as Alibaba and Tencent are embedding insurance services into their digital platforms, offering seamless access to millions of consumers. AI and big data applications allow Chinese insurers to provide personalized policies and improve risk assessments, boosting adoption rates. Growing public awareness, increased investment in digital startups, and cost-effective product scaling position China as the leading market for insurtech in Asia Pacific in 2025.
Europe Insurtech Market Insights, 2025
Europe accounted for an estimated 27% share of the global Insurtech Market in 2025, supported by strong regulatory frameworks and growing digital adoption. EU policies like PSD2 and GDPR promote transparency, trust, and digital compliance, accelerating the integration of AI, blockchain, and cloud solutions across the sector.
United Kingdom Leads Europe’s Insurtech Market
The United Kingdom dominates due to its mature fintech ecosystem, robust venture capital investment, and high consumer preference for digital-first insurance services. London’s position as a global financial hub fosters collaboration between insurers and startups, boosting innovation and scaling opportunities. The UK’s strong regulatory support and widespread digital transformation initiatives make it the leading driver of insurtech adoption across Europe in 2024.
Middle East & Africa and Latin America Insurtech Market Insights, 2025
The Insurtech Market in the Middle East & Africa and Latin America experienced steady growth in 2025, driven by rising smartphone adoption and expanding financial inclusion initiatives. In the Middle East, GCC countries like the UAE and Saudi Arabia are leading with government-backed digital transformation programs and strong fintech ecosystems. In Latin America, Brazil and Mexico spearhead growth through mobile-first insurance platforms and AI-driven microinsurance offerings. Both regions are attracting global players and foreign investments, creating opportunities for improved accessibility and faster adoption of digital insurance solutions.
Competitive Landscape for the Insurtech Market:
Lemonade
Lemonade is a U.S.-based insurtech known for its direct-to-consumer, app-first insurance offerings and AI-driven policy issuance and claims processing. The company leverages behavioral economics and chat-based interfaces to simplify renters, homeowners, and pet insurance purchases, automating underwriting with machine learning and reducing friction for customers. Lemonade operates with a digital-first distribution model, combining transparent pricing, rapid claims adjudication, and a social-good Giveback feature that donates unclaimed premiums to charities. Its role in the insurtech market is notable for driving consumer-facing automation and reimagining policy purchase and servicing for younger, digital-native customers.
-
In April 2024, Lemonade expanded its product suite and refined AI claims automation to improve speed, reduce fraud, and boost customer retention.
Root Insurance
Root Insurance is a U.S.-based insurtech that pioneered usage-based auto insurance through telematics and smartphone-driven driving behavior analysis. The company uses in-app driving assessments to offer personalized premiums, emphasizing safer drivers with lower rates and leveraging data science to streamline underwriting. Root’s direct-to-consumer model focuses on simple digital onboarding, fast policy changes, and automated claims handling to lower acquisition costs and improve scalability for personal auto lines. Its role in the market centers on demonstrating the value of behavior-based pricing and mobile-first telematics for modernizing personal auto insurance.
-
In February 2024, Root Insurance intensified telematics-based personalization and claims automation to scale usage-based auto offerings and improve loss ratios.
Hippo Insurance
Hippo Insurance is a U.S.-based insurtech specializing in homeowner-centric insurance with a focus on smart-home integration and proactive risk prevention. The company offers modernized homeowners policies with streamlined digital quoting, extended coverage options, and value-added services such as smart device partnerships and home-maintenance monitoring. Hippo positions itself as a customer-friendly alternative to legacy carriers by combining rapid digital issuance with proactive loss mitigation, aiming to reduce claims frequency and improve long-term profitability. Its role in the market emphasizes prevention-first homeowner products and seamless digital servicing.
-
In June 2024, Hippo advanced its smart-home partnerships and proactive risk-management services to minimize claims and deliver personalized homeowner protection.
Metromile
Metromile is a U.S.-based insurtech focused on pay-per-mile auto insurance that appeals to low-mileage drivers through telematics-enabled pricing and digital policy management. Using a compact device or app to capture mileage and trip data, Metromile offers usage-based premiums, automated trip summaries, and digital claims tools to lower costs for occasional drivers. The company’s platform also provides diagnostics and trip insights, positioning Metromile as both an insurer and a mobility-data provider. Its role in the insurtech market highlights the commercial viability of consumption-based insurance models for specific driver segments.
-
In March 2024, Metromile enhanced its pay-per-mile pricing model and digital claims efficiency to attract low-mileage drivers and monetize mobility data.
Insurtech Companies are:
-
Lemonade
-
Hippo Insurance
-
Metromile
-
PolicyBazaar
-
Oscar Health
-
Clover Health
-
ZhongAn Insurance
-
Acko General Insurance
-
Bright Health Group
-
Alan
-
WeFox
-
BIMA
-
Trōv
-
Slice Labs
-
Shift Technology
-
Majesco
-
Quantemplate
-
Damco Group
| Report Attributes | Details |
| Market Size in 2025E | USD 19.29 Billion |
| Market Size by 2033 | USD 580.36 Billion |
| CAGR | CAGR of 53.03% From 2025 to 2032 |
| Base Year | 2025 |
| Forecast Period | 2026-2033 |
| Historical Data | 2022-2024 |
| Report Scope & Coverage | Market Size, Segments Analysis, Competitive Landscape, Regional Analysis, DROC & SWOT Analysis, Forecast Outlook |
| Key Segments | • By Type (Auto, Business, Health, Home, Specialty, Travel, and Others) • By Service (Consulting, Support & Maintenance, and Managed Services) • By Technology (Blockchain, Cloud Computing, IoT, Machine Learning, Robo Advisory, and Others) • By End-use (Automotive, BFSI, Government, Healthcare, Manufacturing, Retail, Transportation, and Others) |
| Regional Analysis/Coverage | North America (US, Canada, Mexico), Europe (Germany, France, UK, Italy, Spain, Poland, Turkey, Rest of Europe), Asia Pacific (China, India, Japan, South Korea, Singapore, Australia, Taiwan, Rest of Asia Pacific), Middle East & Africa (UAE, Saudi Arabia, Qatar, South Africa, Rest of Middle East & Africa), Latin America (Brazil, Argentina, Rest of Latin America) |
| Company Profiles | Lemonade, Root Insurance, Hippo Insurance, Metromile, PolicyBazaar, Oscar Health, Clover Health, ZhongAn Insurance, Acko General Insurance, Next Insurance, Bright Health Group, Alan, WeFox, BIMA, Trōv, Slice Labs, Shift Technology, Majesco, Quantemplate, Damco Group |
Frequently Asked Questions
- Easy to real-time tracking and monitoring with the help of (AI) artificial intelligence, blockchain, machine learning, and cloud computing Devices.
- • Increasing the sales of insurtech with the help of AI, ML, cloud computing, and blockchain.
USD 19.29 billion in 2025 is the market share of the Insurtech Market.
The major worldwide key players in the Insurtech Market are Damco Group, DXC Technology Company, Insurance Technology Services, Majesco, Oscar Insurance, Quan template, Shift Technology, Trov Insurance Solutions, LLC., Wipro Limited.
Growth rate of the Insurtech Market is CAGR 53.03%.
The market is expected to grow to USD 580.36 billion by the forecast period of 2033.
Get in Touch
