Self-Checkout System Market Report Scope & Overview:
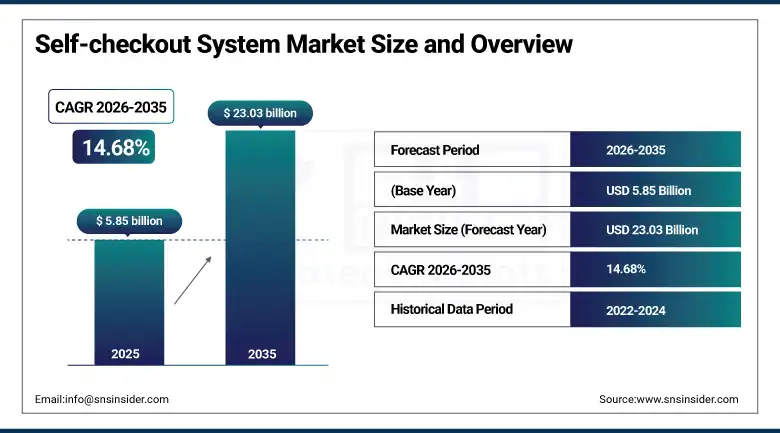
The Self-Checkout System market was valued at USD 5.85 billion in 2025 and is expected to reach USD 23.03 billion by 2035, growing at a CAGR of 14.68% from 2026–2035.
Modern self-checkout systems have evolved substantially beyond the early generation of weight-based verification kiosks that generated customer frustration through frequent unexpected item alerts, as current platforms incorporate AI-powered item recognition through computer vision cameras that can identify products by visual appearance without barcode scanning, intelligent exception handling that distinguishes genuine errors from intentional theft attempts with greater accuracy than rule-based weight verification systems, seamless integration with loyalty programmes and personalised promotional offers, support for a full range of contactless digital payment methods, and increasingly natural user interfaces designed through extensive usability research to minimise friction for customers of varying technology comfort levels.
A 2025 survey of North American grocery retailers indicated that stores with optimised self-checkout deployments achieved average checkout lane utilisation improvements of 23% over equivalent staffed-only configurations during peak trading periods, with customer satisfaction scores for the self-checkout experience reaching parity with staffed checkout satisfaction for approximately 78% of surveyed shoppers who rated self-checkout as their preferred method for transactions under 15 items.
Self-Checkout System Market Size and Forecast
-
Market Size in 2026E: USD 6.71 Billion
-
Market Size by 2035: USD 23.03 Billion
-
CAGR: 14.68% from 2026 to 2035
-
Fastest Growing Region: Asia Pacific
-
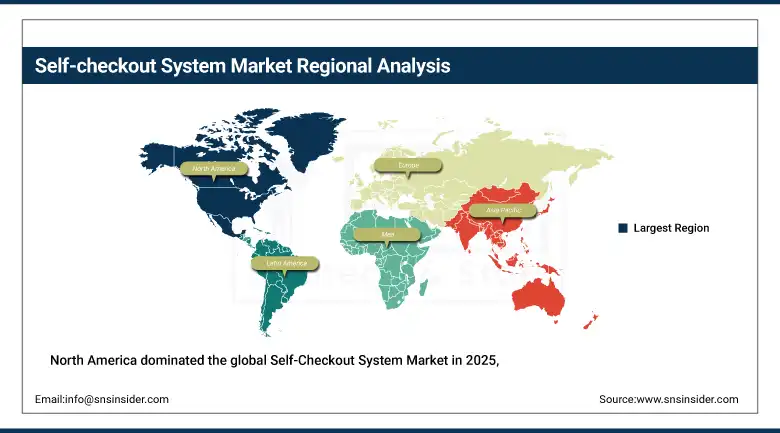
Largest Region: North America
To Get more information On Self-checkout System Market - Request Free Sample Report
Self-Checkout System Market Trends
-
Accelerating integration of computer vision and AI-powered frictionless checkout technology that eliminates barcode scanning entirely, allowing customers to place items in their basket or shopping bag while cameras and machine learning models automatically identify and price the entire transaction without any manual scanning interaction, representing the next evolution beyond conventional self-checkout kiosks toward the Amazon Go and similar grab-and-go retail models.
-
Growing deployment of mobile-based self-checkout applications that enable customers to scan items with their smartphones as they shop and pay through integrated digital wallets without interacting with any kiosk hardware, reducing retail infrastructure investment while addressing the preferences of digitally native consumer segments who prefer smartphone-native transaction experiences.
-
Rising adoption of RFID-enabled self-checkout that reads all items simultaneously through radio frequency identification rather than requiring sequential barcode scanning, dramatically accelerating the checkout process for full basket transactions and virtually eliminating the scan failure frustration that has been the primary negative driver of self-checkout dissatisfaction in consumer surveys.
-
Increasing retailer investment in self-checkout loss prevention technology as theft and item substitution incidents have grown with self-checkout adoption, including AI-powered camera systems that monitor self-checkout interactions for suspicious behaviour patterns, weight verification systems calibrated to sub-gram accuracy, and receipt verification scanning at store exits integrated with transaction records.
-
Expanding self-checkout deployment into new retail verticals beyond the grocery and general merchandise formats where the technology has historically concentrated, including fuel and convenience stations, pharmacy and drug store chains, DIY home improvement retail, and quick-service restaurant and fast food formats where self-service ordering and payment kiosks are becoming the dominant transaction interface.
U.S. Self-Checkout System Market Outlook
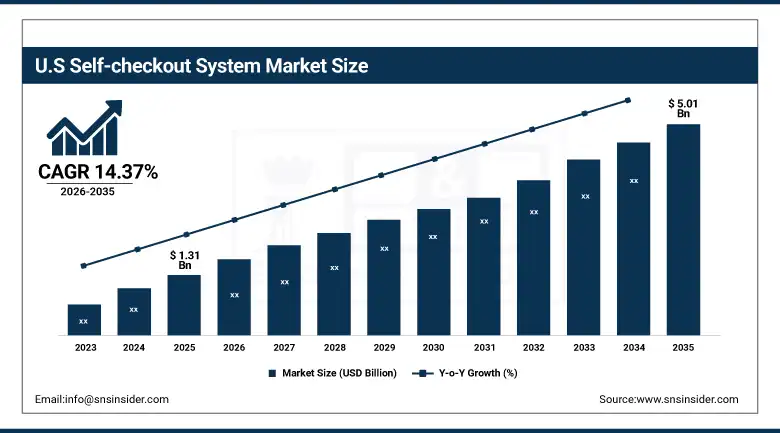
The U.S. Self-Checkout System Market was valued at approximately USD 1.31 billion in 2025 and is expected to reach approximately USD 5.01 billion by 2035, growing at a CAGR of 14.37%, underpinned by rapid AI and contactless payment adoption, rising retail labour costs that strengthen the economic case for automation, supportive regulatory environment for retail technology innovation, and the highest self-checkout hardware penetration rate among major retail formats globally.
The United States is the world's most advanced and extensively deployed self-checkout market, where the technology has progressed from a competitive differentiator to a standard fixture in grocery, mass merchandise, home improvement, and pharmacy retail formats over two decades of progressive adoption. Major U.S. grocery and mass merchandise retailers including Walmart, Kroger, Target, Home Depot, and CVS collectively operate tens of thousands of self-checkout units across their store networks, and the continuous improvement of their self-checkout implementations through AI-assisted loss prevention, digital payment integration, and user experience optimisation represents a sustained technology refresh and capability investment cycle that anchors the U.S. market's revenue base. The emergence of Amazon Just Walk Out and Zippin cashierless checkout technologies deployed in convenience, sports venue, and travel retail formats represents the leading edge of self-checkout's evolution in the U.S. toward fully frictionless transaction experiences where customer payment occurs automatically without any active scanning or payment interaction.
The U.S. retail industry's structural labour shortage, where the Bureau of Labor Statistics consistently documents vacancy rates in frontline retail positions exceeding 5%, combined with sustained minimum wage increases across major retail states pushing frontline cashier costs above the annualised capital and maintenance cost of self-checkout technology, has permanently shifted the labour cost comparison that determines retailer self-checkout investment decisions in favour of technology-assisted checkout in virtually all formats above the small independent store threshold.
Self-Checkout System Market Segment Analysis
-
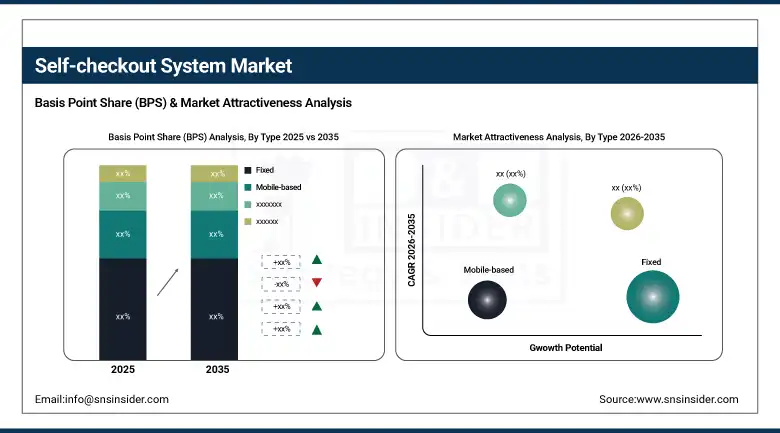
By Type, Fixed systems dominated with approximately 73.20% of revenues in 2025 through their widespread installation across supermarket, hypermarket, and mass merchandise formats where the comprehensive feature set, payment hardware integration, and physical kiosk design of fixed systems meets the full range of transaction scenarios; Mobile-based is the fastest-growing type at a CAGR of 15.40% as smartphone scan-and-go applications expand checkout optionality for digitally engaged shoppers.
-
By Component, Solutions led with approximately 70.20% of revenues in 2025 encompassing the self-checkout software platform, payment processing integration, and kiosk hardware; Services is the fastest-growing component at a CAGR of 16.2% as installation, integration, managed services, and ongoing software maintenance support for expanding self-checkout deployments create sustained professional services demand.
-
By Application, Supermarkets & Hypermarkets dominated as the primary deployment environment for fixed self-checkout systems where the format's high transaction volumes, basket size diversity, and staffing cost structures create the strongest economic case for self-checkout adoption; Convenience Stores and Fuel & Gas Stations are emerging as the fastest-growing application segments as compact kiosk formats and mobile checkout options make the technology viable in smaller-format retail environments previously considered unsuitable for self-checkout deployment.
By Type, Fixed systems dominate, Mobile-based is expected to grow fastest
Fixed self-checkout systems retained the dominant type position with approximately 73.20% of the Self-Checkout System Market in 2025, reflecting their status as the established standard for self-checkout deployment in the major retail formats including supermarkets, hypermarkets, and mass merchandise stores that collectively represent the largest retail transaction volumes globally. Fixed kiosk systems from leading manufacturers including NCR, Toshiba Global Commerce Solutions, Diebold Nixdorf, and Fujitsu provide the full hardware and software integration required for the complete retail transaction including barcode scanning, weight verification, payment processing, and receipt generation within a purpose-designed unit whose physical dimensions and user interface are optimised for the retail checkout context. The installed base of hundreds of thousands of fixed self-checkout units across North American and European retail creates a replacement cycle market alongside new deployment volume, as retailers upgrade ageing first and second-generation systems with current platforms incorporating AI-powered loss prevention cameras, contactless payment hardware, and improved user interface software.
Mobile-based self-checkout is the fastest-growing type at a CAGR of 15.40% through 2035, representing the convergence of retail transaction technology with the consumer smartphone platforms that an increasing proportion of shoppers prefer to use as their primary commercial interaction device. Scan-and-go smartphone applications developed by major retailers including Walmart, Kroger, and Meijer, and powered by mobile point-of-sale platforms from technology providers including Zebra Technologies and Scandit, enable customers to scan product barcodes as they shop and complete payment through an integrated digital wallet or loyalty programme payment method without any physical kiosk interaction. The elimination of kiosk hardware reduces retailer capital investment, eliminates the physical space constraints of kiosk lane configurations, and removes the waiting queue friction that occurs when all available kiosk lanes are occupied.
By Application, Supermarkets & Hypermarkets dominate, Convenience Stores are expected to grow fastest
Supermarkets and Hypermarkets retained the dominant application position in the Self-Checkout System Market in 2025, reflecting the format's combination of very high transaction volumes, diverse basket compositions encompassing fresh produce, weighed items, and packaged goods requiring robust item recognition, and large store footprints that can accommodate the lane space requirements of multiple kiosk stations alongside staffed checkout options. The economics of self-checkout deployment in large-format grocery are particularly compelling as the combination of high transaction volumes, sustained labour cost pressure, and customer preference data showing a majority of grocery shoppers prefer self-checkout for medium and small basket transactions creates a straightforward return on investment calculation that justifies the capital expenditure on technology upgrade cycles even as initial system costs remain substantial.
Convenience stores and fuel and gas station retail are the fastest-growing application segments as compact kiosk designs, AI-powered age verification for regulated product sales, and integration with fuel payment systems make self-checkout viable in format sizes and transaction profiles that had previously been considered outside the self-checkout addressable market. The deployment of self-checkout at convenience retail chains including 7-Eleven, Circle K, and BP Connect formats is driven by the format's acute labour shortage challenge where small-footprint stores with limited staffing levels suffer disproportionately from cashier unavailability, creating customer experience disruption that self-checkout kiosks operating during unmanned periods can mitigate.
Regional Analysis
|
Region |
Major Country |
Share within Region, 2025 (%) |
|---|---|---|
|
North America |
United States |
85.7% |
|
Europe |
Germany |
22.4% |
|
Asia Pacific |
China |
48.3% |
|
Middle East & Africa |
UAE |
31.5% |
|
Latin America |
Brazil |
43.8% |
North America Self-Checkout System Market Insights
North America dominated the global Self-Checkout System Market in 2025, with the United States accounting for approximately 85.7% of North American revenues. The region's leadership reflects its position as the world's most mature self-checkout market where the technology has been deployed at commercial scale for over two decades across grocery, mass merchandise, home improvement, and pharmacy retail formats, creating an established installed base requiring continuous upgrade and expansion alongside the innovation activity that is advancing the technology toward fully frictionless AI-powered checkout. Major U.S. retail chains' continued investment in self-checkout system refresh and expansion, combined with the active commercialisation of next-generation cashierless checkout technologies by Amazon, Zebra, and specialist startups, sustains market revenue growth above and beyond the natural replacement cycle of existing installed systems.
Get Customized Report as per Your Business Requirement - Enquiry Now
Europe Self-Checkout System Market Insights
Europe is a large and technically advanced self-checkout market anchored by the United Kingdom's grocery retail sector, which was among the earliest to achieve widespread self-checkout deployment beginning in the early 2000s through Tesco, Sainsbury's, Marks & Spencer, and Asda, and Germany's robust consumer electronics and mass merchandise retail sector that has progressively adopted self-checkout as store formats have modernised. Germany accounts for approximately 22.4% of European self-checkout revenues, driven by the expansion of Lidl, Aldi, and Rewe self-checkout deployments across their European store networks and the growing adoption by electronics retailers including Media Markt and Saturn. European retail's GDPR-compliant requirements for biometric data handling in facial recognition-based age verification and cashierless checkout systems create regulatory complexity that is shaping technology selection decisions differently from North American implementations where data privacy regulations are less restrictive.
Asia Pacific Self-Checkout System Market Insights
Asia Pacific is the fastest-growing self-checkout system market, driven by the combination of rapid organised retail sector expansion across China, India, South Korea, Japan, and Southeast Asia creating new store format deployment opportunities, technology-forward consumer demographics particularly in urban markets who readily adopt self-service retail interactions, and government-supported retail modernisation programmes in several countries that incentivise adoption of advanced retail technology. China accounts for approximately 48.3% of Asia Pacific self-checkout revenues, reflecting the extraordinary scale of modern retail format development and the integration of self-checkout capability into Alibaba and JD's new retail concept stores that blend online and offline commerce through seamlessly integrated autonomous checkout technology. Japan's convenience store sector, the world's most sophisticated in terms of technology integration, is progressively implementing self-checkout and semi-self-checkout systems at its approximately 55,000 convenience stores where labour shortages are creating urgency around automation investment.
MEA & Latin America Self-Checkout System Market Insights
The Middle East and Africa and Latin America represent developing self-checkout markets where modern organised retail formats including supermarkets, hypermarkets, and shopping mall anchor stores are the primary deployment environments as standalone and compact format retail lacks the transaction volumes that justify self-checkout capital investment at current technology cost points. UAE leads MEA self-checkout deployment at approximately 31.5% of regional revenues through its concentration of premium hypermarket formats including Carrefour, LuLu, and Spinneys that have adopted self-checkout as a customer experience differentiation tool in a competitive grocery retail market serving a technology-comfortable expatriate and domestic consumer demographic. Brazil leads Latin American self-checkout adoption at approximately 43.8% of regional revenues through the country's large organised grocery retail sector where Carrefour Brazil, GPA, and Grupo Mateus have deployed self-checkout at significant scale in their supermarket and hypermarket networks.
Market Dynamics
Growth Drivers: Structural retail labour shortages and rising minimum wages creating permanent economic imperative for checkout automation combined with consumer preference shifts toward self-service convenience
The primary structural growth drivers for the Self-Checkout System Market are the enduring retail sector labour shortage that has made cashier hiring and retention progressively more challenging and expensive across North America, Europe, and the Asia Pacific developed market economies, combined with the sustained consumer preference shift toward self-service checkout options documented across retail consumer surveys in every major market where the technology has achieved meaningful penetration. The economic case for self-checkout investment has strengthened significantly as minimum wage legislation in major U.S. states, the United Kingdom, Australia, Germany, and across much of the EU has raised frontline cashier wage costs while technology costs have continued their long-term deflationary trajectory, compressing the payback period for new self-checkout deployments to levels that make the investment justifiable even in retail formats where transaction volumes had previously been considered insufficient to support the business case.
Restraints: Retail theft and shrinkage concerns limiting deployment confidence, customer experience friction in poorly implemented systems generating consumer backlash, and high-value item verification requirements limiting basket type suitability
A significant restraint on the Self-Checkout System Market is the elevated retail shrinkage rates that have been empirically associated with self-checkout adoption in multiple retail chain internal studies and third-party research, where the combination of unintentional scanning errors, deliberate item misrepresentation, and opportunistic theft in unmonitored self-checkout environments contributes to inventory losses that in some cases have caused retailers to reduce or reconfigure their self-checkout deployments following comprehensive loss prevention analysis. Several major U.S. grocery chains including Dollar General and Walmart have announced selective self-checkout restrictions or conversions back to staffed lanes in specific store formats following loss analyses demonstrating that shrinkage costs exceeded the labour savings that motivated the original deployment. The customer experience limitations of first and second-generation self-checkout systems, where weight verification false positives, barcode scan failures, age verification interruptions, and restricted payment method acceptance have created customer frustration experiences that contribute to negative brand sentiment, remain a meaningful restraint in markets where poor early implementations have embedded consumer scepticism toward the technology category.
Opportunities: AI-powered frictionless checkout creating the next generation of differentiated retail experience, self-checkout expansion into unserved verticals, and emerging market modern retail format development
The commercialisation of AI-powered frictionless checkout technology that eliminates the scanning, bagging, and payment interaction steps entirely, replacing them with computer vision item detection and automatic payment from a registered payment method as customers exit the store, represents the most transformative market development opportunity in the self-checkout system category as it addresses both the labour cost driver and the customer experience quality driver simultaneously without the friction associated with conventional self-checkout kiosk interactions. Retailers in high-footfall locations including sports stadiums, airport terminals, university campuses, and office building food courts represent large underserved deployment opportunities where the combination of constrained space, very high peak transaction volumes, and technology-comfortable customer demographics create conditions well suited to mobile and frictionless checkout technology formats.
Recent Developments:
-
January 2025: Fujitsu unveiled its next-generation unified commerce solution integrating AI-powered data analytics across online, in-store, and back-office retail operations, incorporating advanced self-checkout monitoring capabilities that correlate checkout performance data with inventory, staffing, and customer journey analytics for comprehensive retail operations intelligence.
-
January 2025: Honeywell's annual AI in Retail Survey reported that over 80% of surveyed U.S. retailers planned to expand AI adoption across retail operations including checkout automation within the following 12 months, confirming broad retail industry commitment to accelerating technology investment in customer-facing automation.
-
2025: NCR Voyix launched updated self-checkout software incorporating enhanced computer vision loss prevention capabilities reducing shrinkage-related incidents by over 30% in pilot deployments compared with weight-only verification systems, directly addressing the primary restraint that has caused retailers to question self-checkout expansion investments.
-
2025: Zebra Technologies expanded its Zebra Workcloud commerce platform with new scan-and-go mobile checkout capabilities enabling retailers to deploy smartphone-based self-checkout without kiosk hardware investment, reducing the entry cost for mid-market and convenience retail self-checkout adoption significantly.
-
2025: Toshiba Global Commerce Solutions introduced an AI-powered self-checkout assistance platform providing real-time intervention recommendations to self-checkout monitoring associates, reducing exception handling time per customer incident and improving overall self-checkout lane throughput during peak trading periods.
Self-Checkout System Market Key Players
-
NCR Corporation
-
Diebold Nixdorf, Inc.
-
Toshiba Global Commerce Solutions
-
Fujitsu Limited
-
ITAB Group
-
ECR Software Corporation (ECRS)
-
Pan-Oston Corporation
-
Slabb Kiosks
-
MetroClick
-
Pyramid Computer GmbH
-
Gilbarco Veeder-Root
-
StrongPoint
-
DXC Technology
-
KIOSK Information Systems
-
Zebra Technologies
-
IBM Corporation
-
Honeywell International Inc.
-
Olea Kiosks Inc.
-
ShelfX Inc.
-
ePOS HYBRI
Self-Checkout System Market Report Scope:
| Report Attributes | Details |
|---|---|
| Market Size in 2025 | USD 5.85 Billion |
| Market Size by 2035 | USD 23.03 Billion |
| CAGR | CAGR of 14.68% From 2026 to 2035 |
| Base Year | 2025 |
| Forecast Period | 2026-2035 |
| Historical Data | 2022-2024 |
| Report Scope & Coverage | Market Size, Segments Analysis, Competitive Landscape, Regional Analysis, DROC & SWOT Analysis, Forecast Outlook |
| Key Segments | • By Type (Fixed, Mobile-based) • By Component (Solutions, Services) • By Application (Supermarkets & Hypermarkets, Convenience Stores, Department Stores, Fuel & Gas Stations, Others) |
| Regional Analysis/Coverage | North America (US, Canada, Mexico), Europe (Eastern Europe [Poland, Romania, Hungary, Turkey, Rest of Eastern Europe] Western Europe] Germany, France, UK, Italy, Spain, Netherlands, Switzerland, Austria, Rest of Western Europe]), Asia Pacific (China, India, Japan, South Korea, Vietnam, Singapore, Australia, Rest of Asia Pacific), Middle East & Africa (Middle East [UAE, Egypt, Saudi Arabia, Qatar, Rest of Middle East], Africa [Nigeria, South Africa, Rest of Africa], Latin America (Brazil, Argentina, Colombia, Rest of Latin America) |
| Company Profiles | NCR Corporation, Diebold Nixdorf, Inc., Toshiba Global Commerce Solutions, Fujitsu Limited, ITAB Group, ECR Software Corporation (ECRS), Pan-Oston Corporation, Slabb Kiosks, MetroClick, Pyramid Computer GmbH, Gilbarco Veeder-Root, StrongPoint, DXC Technology, KIOSK Information Systems, Zebra Technologies, IBM Corporation, Honeywell International Inc., Olea Kiosks Inc., ShelfX Inc., ePOS HYBRID |
Frequently Asked Questions
Ans: North America dominated the Self-Checkout System Market in 2025.
Ans: Fixed systems dominated with approximately 73.20% of revenues in 2025.
Ans: Structural retail labour shortages combined with rising minimum wages creating permanent economic imperative for checkout automation, alongside consumer preference shifts toward self-service and contactless shopping experiences that self-checkout technology satisfies more effectively than staffed alternatives.
Ans: The Self-Checkout System Market was valued at USD 5.85 billion in 2025.
Ans: The Self-Checkout System Market is expected to grow at a CAGR of 14.68% from 2026 to 2035.
Get in Touch
