Web 3.0 blockchain Market Report Insights:
Get more information on Web 3.0 blockchain Market - Request Free Sample Report
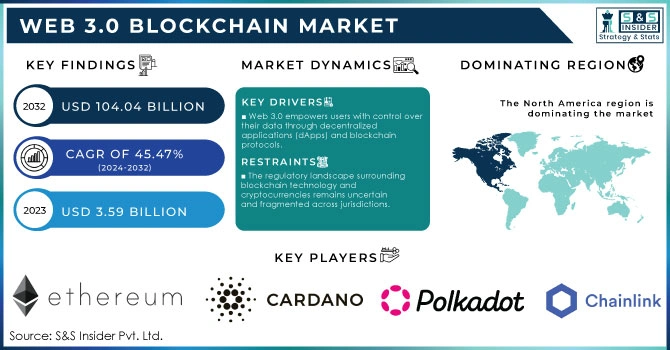
The Web 3.0 Blockchain Market was valued at USD 3.59 billion in 2023 and is expected to reach USD 104.04 Billion by 2032, growing at a CAGR of 45.47% over the forecast period 2024-2032.
The Web 3.0 blockchain market is emerging as a transformative sector that leverages decentralized technologies to reshape how digital interactions occur. One prominent application of Web 3.0 blockchain technology is in the financial services sector, particularly through decentralized finance (DeFi). As of January 2024, the decentralized finance (DeFi) market holds approximately USD 55.95 billion in total value locked (TVL). Global blockchain spending is projected to reach USD 19 billion by 2024, highlighting the growth and adoption of blockchain solutions. The cryptocurrency landscape has expanded rapidly, with 8,992 different cryptocurrencies available for trade as of January 2024, a substantial increase from 5,840 cryptocurrencies in September 2021. Bitcoin remains the dominant player in the market, boasting a market cap of around USD 892 billion and a price of USD 45,505.81 per BTC. Following closely is Wrapped Bitcoin (WBTC) at USD 45,456.18. In terms of trading volume, Tether (USDT) leads with a 24-hour trade value of USD 51.69 billion, while Bitcoin and Ethereum follow with approximately USD 32.73 billion and USD 11 billion, respectively. DeFi platforms utilize blockchain technology to offer financial services such as lending, borrowing, and trading without traditional banking intermediaries. This democratization of finance allows users from diverse backgrounds to access capital and financial products, fostering financial inclusion. The DeFi landscape has seen exponential growth, with the total value locked (TVL) in these protocols reaching billions of dollars, reflecting a significant shift towards alternative financial systems.
The Web 3.0 blockchain market also holds potential in the realm of digital identity and personal data management. Traditional identity verification processes often rely on centralized databases, making them vulnerable to data breaches and misuse. Web 3.0 allows individuals to manage their own digital identities through decentralized identity solutions, where users control their personal information and share it selectively with service providers. This shift not only enhances privacy and security but also empowers users with ownership of their data, aligning with the ethos of the decentralized web.
Web 3.0 Blockchain Market Dynamics
Drivers
-
Web 3.0 empowers users with control over their data through decentralized applications (dApps) and blockchain protocols.
This change is essential because it enables users to have more control over their digital identities and assets, empowering them. In Web 3.0, people can participate in direct transactions without middlemen, cutting costs and improving confidentiality. For instance, In 2022, DappRadar reached 50 blockchain integrations tracking almost 13,000 dapps and more than 13,500 NFT collections. This decentralized method reduces the dangers linked to centralized data breaches and censorship, promoting a safer and more durable digital space. Ownership is especially influential in sectors like finance, social media, and content creation. Individuals can profit from their input, resulting in novel opportunities for creativity and revenue generation. For instance, artists can distribute their creations as non-fungible tokens (NFTs), maintaining rights to earn royalties from subsequent sales, a practice that was difficult in conventional methods. Moreover, decentralized finance (DeFi) has gained traction in Web 3.0, enabling individuals to participate in lending, borrowing, and trading without relying on traditional banks or financial institutions. This opening up of financial services benefits unbanked populations by giving them access to important financial tools and resources. As more people recognize the advantages of decentralization, an increasing number of users and developers are drawn to Web 3.0 solutions, leading to a rise in adoption and investment in the blockchain market. This pattern is predicted to persist as technologies develop and regulatory frameworks adjust to support decentralized systems.
-
Internet users are increasingly concerned about privacy and security due to rising cyber threats and regulations regarding data privacy.
Web 3.0 blockchain technologies provide improved security through cryptographic methods to protect user information. In the conventional web framework, users frequently need to sacrifice their privacy to use services, resulting in data being sold to third parties or vulnerable to unauthorized access. Web 3.0 solves these problems by allowing users to engage in anonymous or pseudonymous interactions while maintaining ownership of their data. The permanent nature of blockchain guarantees that data cannot be changed or removed without agreement from the network, lowering the chances of tampering and fraudulent activity. This is especially important for use in industries like healthcare, finance, and supply chain management, where maintaining data integrity is crucial. Furthermore, the growing adoption of privacy-centered protocols like ZK-SNARKs enables transactions to be validated without exposing the data underneath. This ability is changing how sensitive information is managed, making sure it follows rules like the General Data Protection Regulation (GDPR).
Restraints
-
The regulatory landscape surrounding blockchain technology and cryptocurrencies remains uncertain and fragmented across jurisdictions.
The unpredictability creates major obstacles for the Web 3.0 blockchain market, as businesses deal with diverse regulations that can affect their activities, adherence needs, and overall market sustainability. Several countries are in the process of establishing regulations for blockchain and cryptocurrency, resulting in uncertainties about taxation, securities regulations, and protecting consumers. This uncertainty may discourage businesses and investors from participating in the market, impeding the progress of Web 3.0 solutions. Furthermore, strict regulations may be enforced by regulatory agencies on blockchain applications, especially those about finance, data privacy, and consumer protection. Adhering to these rules can be expensive and time-intensive for companies, shifting focus from creativity and growth. Potential regulatory crackdowns or bans on specific blockchain activities may lead to fear and uncertainty among developers and users. Consequently, numerous stakeholders might have reservations about investing in or embracing Web 3.0 technologies, which could impede growth and innovation.
Web 3.0 Blockchain Market Segmentation Overview
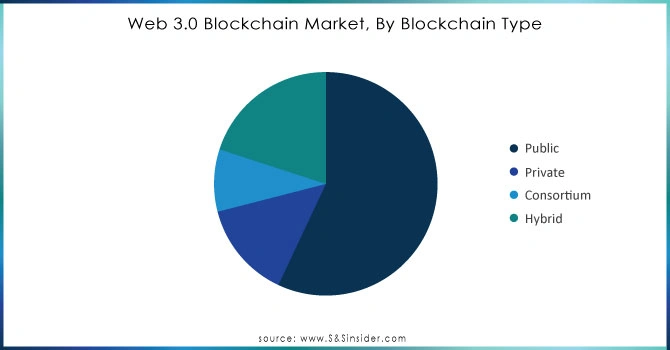
By Blockchain Type
Public blockchains dominated the market with a 57% market share in 2023, due to their decentralized nature and transparency. They enable all individuals to take part in the network, increasing security and trust between users. Public blockchains such as Bitcoin and Ethereum demonstrate this concept by allowing direct transactions between peers without requiring middlemen. Their open-source characteristic promotes creativity, enabling developers to design decentralized applications (dApps) for a range of sectors, including finance and supply chain management. Prominent examples consist of decentralized finance (DeFi) platforms like Uniswap and Aave, built on Ethereum, providing financial services without reliance on traditional banking institutions.
The hybrid blockchain is projected to grow at a faster rate during 2023-2032 in the Web 3.0 blockchain market. Hybrid blockchains mix elements of public and private blockchains, providing versatility, scalability, and improved privacy. This section is designed for companies that want the advantages of decentralization while still having control of sensitive information. For example, businesses can utilize hybrid blockchains to conduct transactions privately but share certain data publicly. Companies such as IBM have utilized hybrid blockchain technology through their IBM Blockchain Platform to enable secure and effective supply chain management.
Need any customization research on Web 3.0 blockchain Market - Enquiry Now
By Application
The cryptocurrency sector led the market in 2023 with over 37% market share, representing a considerable portion of the market's total worth. This supremacy is a result of the rising popularity of digital currencies such as Bitcoin, Ethereum, and others, which are transforming the financial industry by facilitating decentralized transactions without middlemen. Companies like Coinbase and Binance have become key figures, offering platforms for purchasing, selling, and exchanging different cryptocurrencies. These platforms utilize blockchain technology to guarantee safe, clear, and effective transactions.
Smart Contracts are expected to become the fastest-growing segment during 2024-2032, providing automatic contracts that execute on their own based on specific rules and conditions. This technology increases confidence, minimizes the necessity for middlemen, and simplifies operations in different sectors such as finance, real estate, and supply chain management. Ethereum and Chainlink are at the forefront, with Ethereum offering a strong foundation for creating and implementing smart contracts, and Chainlink concentrating on linking smart contracts to real-world information.
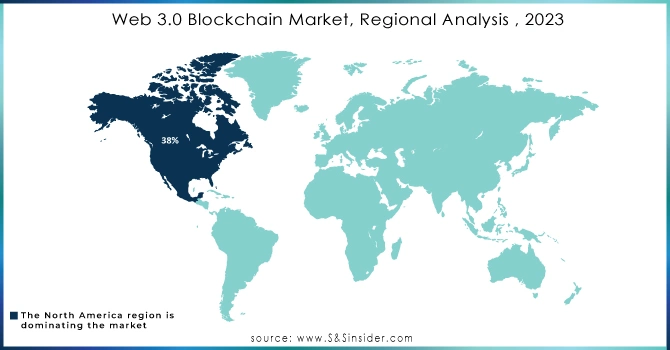
Web 3.0 Blockchain Market Regional Analysis
North America dominated the market with a 38% market share in 2023, driven by a robust technological infrastructure, significant investment, and a growing number of blockchain startups. The United States is at the forefront of innovation in decentralized applications and smart contracts, led by major players such as Ethereum and ConsenSys. Additionally, regulations are changing to encourage the usage of blockchain technology, creating a secure space for companies to function. Businesses such as Coinbase and BlockFi lead the way in incorporating blockchain technology into financial services, improving user experience with decentralized finance (DeFi) solutions.
The Asia-Pacific is anticipated to become the fastest-growing in the web 3.0 blockchain market during 2024-2032, fueled by increasing digitalization, rapid urbanization, and a young, tech-savvy population. China, India, and Singapore are all adopting blockchain technology in multiple industries such as finance, supply chain, and healthcare. China has become an important participant with its Blockchain Service Network (BSN), which seeks to simplify the creation and implementation of blockchain applications. In India, firms such as Polygon are making progress in improving Ethereum scalability, while ventures like WazirX are testing the limits of crypto exchanges.
Key Players in Web 3.0 Blockchain Market
The major key players in the Web 3.0 Blockchain Market are:
-
Ethereum (ETH, Solidity)
-
Cardano (ADA, Plutus)
-
Polkadot (DOT, Substrate)
-
Chainlink (LINK, Chainlink VRF)
-
Filecoin (FIL, Filecoin Network)
-
Tezos (XTZ, Michelson)
-
Solana (SOL, Solana Program Library)
-
Ripple (XRP, RippleNet)
-
Polygon Technology (MATIC, Polygon SDK)
-
Hedera (HBAR, Hedera Consensus Service)
-
Avalanche (AVAX, Avalanche Subnets)
-
Cosmos (ATOM, Cosmos SDK)
-
Algorand (ALGO, Algorand Standard Assets)
-
Arweave (AR, Arweave Permaweb)
-
EOS (EOS, EOSIO)
-
Near Protocol (NEAR, NEAR SDK)
-
Kusama (KSM, Parachains)
-
Waves (WAVES, Waves DEX)
-
Stellar (XLM, Stellar Network)
-
Zilliqa (ZIL, Zilliqa Smart Contracts)
Suppliers of Services/Platforms:
-
Infura (Ethereum infrastructure services)
-
Alchemy (Blockchain development platform)
-
Moralis (Web3 backend development services)
-
ChainSafe (Web3 libraries and tools)
-
Blockdaemon (Node infrastructure and deployment solutions)
-
Fleek (Decentralized hosting and development tools)
Recent Developments
-
October 2024: Sui, the blockchain platform recognized for its top-notch performance and scalability, revealed today the launch of its initial SuiHub in partnership with Ghaf Group, the prominent blockchain ally in the MENA area.
-
May 2024: Alchemy Pay, a company that offers payment solutions for fiat and cryptocurrencies, is getting ready to introduce its digital bank for Web 3.0. This new initiative is designed to offer Web 3.0 businesses worldwide a compliant and efficient solution for managing multiple fiat accounts, optimizing cash flows, and simplifying conversions between fiat and cryptocurrency.
-
June 2024: XMint, the gaming platform of Web 3.0, will be officially released on the Solana blockchain on June 20th. XMint's objective is to bring together different kinds of games such as casual, adventure, role-playing, and turn-based ones to provide gamers with a wide variety of gaming options.
| Report Attribute | Details |
|---|---|
| Market Size in 2023 | USD 3.59 Billion |
| Market Size by 2032 | USD 104.04 Billion |
| CAGR | CAGR of 45.47% From 2024 to 2032 |
| Base Year | 2023 |
| Forecast Period | 2024-2032 |
| Historical Data | 2020-2022 |
| Report Scope & Coverage | Market Size, Segments Analysis, Competitive Landscape, Regional Analysis, DROC & SWOT Analysis, Forecast Outlook |
| Key Segments | • By Blockchain Type (Public, Private, Consortium, Hybrid) • By Application (Cryptocurrency, Conversational AI, Data & Transaction Storage, Payments, Smart Contracts, Others) • By End User (BFSI, Retail & E-commerce, Media & Entertainment, Pharmaceuticals, IT & Telecom, Others) |
| Regional Analysis/Coverage | North America (US, Canada, Mexico), Europe (Eastern Europe [Poland, Romania, Hungary, Turkey, Rest of Eastern Europe] Western Europe] Germany, France, UK, Italy, Spain, Netherlands, Switzerland, Austria, Rest of Western Europe]), Asia Pacific (China, India, Japan, South Korea, Vietnam, Singapore, Australia, Rest of Asia Pacific), Middle East & Africa (Middle East [UAE, Egypt, Saudi Arabia, Qatar, Rest of Middle East], Africa [Nigeria, South Africa, Rest of Africa], Latin America (Brazil, Argentina, Colombia, Rest of Latin America) |
| Company Profiles | Ethereum, Cardano, Polkadot, Chainlink, Filecoin, Tezos, Solana, Ripple, Polygon, Hedera, Avalanche, Cosmos, Algorand, Arweave, EOS, Near Protocol, Kusama, Waves, Stellar, Zilliqa |
| Key Drivers | • Web 3.0 empowers users with control over their data through decentralized applications (dApps) and blockchain protocols. • Internet users are increasingly concerned about privacy and security due to rising cyber threats and regulations regarding data privacy. |
| RESTRAINTS | • The regulatory landscape surrounding blockchain technology and cryptocurrencies remains uncertain and fragmented across jurisdictions. |
Frequently Asked Questions
Ans. The Compound Annual Growth rate for Web 3.0 blockchain Market over the forecast period is 45%.
Ans. blockchain technology provides several benefits when used in Web 3.0, including decentralization, improved security, ownership of data, transparency, cryptocurrency enabled, and smart contracts.
Ans. Various uses of blockchain technologies like decentralized apps smart contracts, and non-fungible tokens will become more popular once Web 3.0 is widely accepted. Cryptocurrency is expected to hold the largest share in the global web 3.0 blockchain market
Ans. challenges of using blockchain technology in web 3.0 including complexity, security concerns, regulatory concerns, technology requirements, and lack of interoperability with Web 2.0.
Ans: North America dominated the Web 3.0 Blockchain Market in 2023.
Get in Touch
