Semi-Solid Dosage CDMO Market Report Scope & Overview:
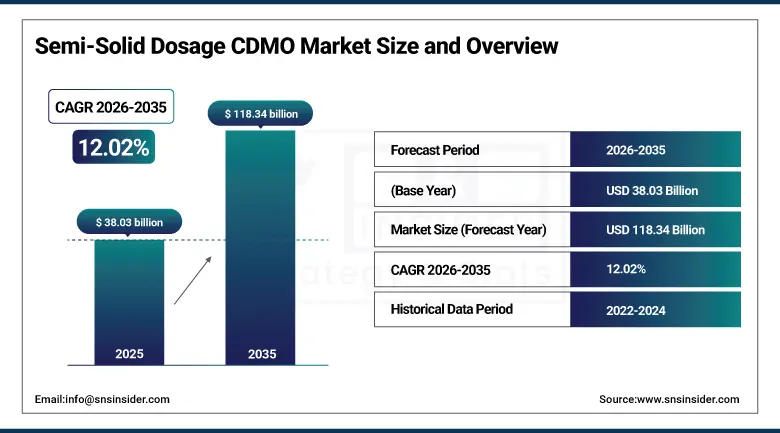
The Semi-Solid Dosage CDMO Market was valued at USD 38.03 billion in 2025 and is expected to reach USD 118.34 billion by 2035, growing at a CAGR of 12.02% from 2026-2035.
The global semi-solid dosage CDMO market is mainly driven by cost advantage, research and development outsourcing trends in pharma and biotech industries to access specialized expertise in the field, and the ability to expand production with minimal capital investment. The market further benefits over the migration towards advanced complex formulations encompassing multi-drug, nano-based, and enhanced penetration systems, which necessitate technologies to manufacture, including continuous manufacturing.
For instance, in October 2024, Informa Pharma Intelligence reported an 11% YoY growth in complex semi-solid formulations, with nano-based creams and transdermal patches showing the fastest market expansion.
Semi-Solid Dosage CDMO Market Size and Forecast
-
Market Size in 2025: USD 38.03 Billion
-
Market Size by 2035: USD 118.4 Billion
-
CAGR: 12.02% from 2026 to 2035
-
Base Year: 2025
-
Forecast Period: 2026–2035
-
Historical Data: 2022–2024
To Get more information on Semi-Solid Dosage CDMO Market - Request Free Sample Report
Semi-Solid Dosage CDMO Market Trends
-
Rising outsourcing of formulation development and manufacturing by pharmaceutical and biotech companies is driving the semi-solid dosage CDMO market.
-
Growing demand for topical, transdermal, and dermatological products such as creams, ointments, gels, and lotions is boosting market growth.
-
Increasing focus on cost optimization, faster time-to-market, and scalability is encouraging sponsors to partner with specialized CDMOs.
-
Expansion of dermatology, pain management, wound care, and cosmetic-pharma applications is fueling adoption.
-
Advancements in formulation technologies, controlled-release systems, and stability enhancement are shaping market trends.
-
Stringent regulatory requirements and the need for GMP-compliant manufacturing are increasing reliance on experienced CDMO partners.
-
Strategic collaborations between pharmaceutical companies, biotech firms, and CDMOs are accelerating innovation and global market expansion.
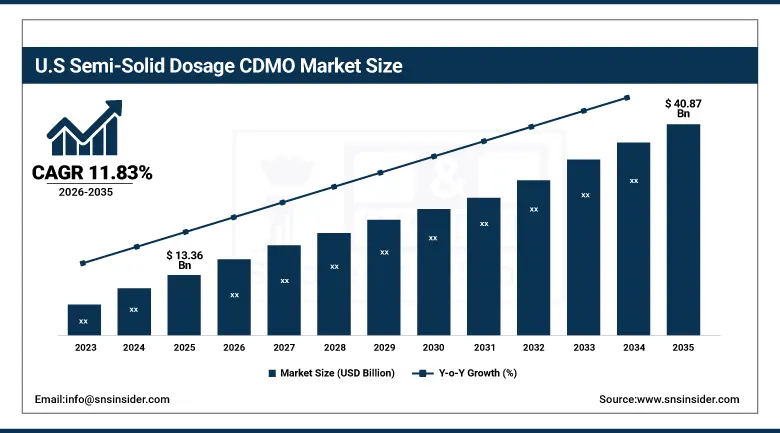
The U.S. Semi-Solid Dosage CDMO Market was valued at USD 13.36 billion in 2025 and is expected to reach USD 40.87 billion by 2035, growing at a CAGR of 11.83% from 2026-2035. The U.S. leads in the semi-solid dosage CDMO market owing to a large number of pharmaceutical players, advanced R&D infrastructure, and higher outsourcing adoption. Besides, there are several FDA-approved semi-solid manufacturers in the country, which results in high realization of global regulatory compliance.
Semi-Solid Dosage CDMO Market Growth Drivers:
-
Pharma & Biotech Outsourcing Trend is Driving the Semi-Solid Dosage CDMO Market Growth
The rising pharma and biotech outsourcing trend is the chief factor driving the global semi-solid dosage CDMO market share, as companies seek to slash operational costs, avoid investment in infrastructure, and tap into specialized formulation expertise. The semi-solid dosage CDMO market trends in Large and mid-tier drug makers are partnering with semi-solid dosage CDMOs to secure GMP compliance, scale up faster, and be ready for global regulatory inspection.
For instance, in September 2024, PhRMA found 78% of mid-to-large pharma firms outsourced semi-solid production, reflecting a rising Semi-Solid Dosage CDMO Market trend.
Semi-Solid Dosage CDMO Market Restraints:
-
Formulation Stability Challenges are Hampering the Semi-Solid Dosage CDMO Market Growth
Formulation stability challenges hold back the semi-solid dosage CDMO market analysis, as creams, gels, and ointments are prone to physical separation, viscosity changes, and degradation of active ingredients. This causes marketing complications, reduces shelf life, and lengthens the research and development timeline, often requiring reformulation, advanced excipients, or specialty packaging, which can increase cost pressure and program delays in launching a product.
Semi-Solid Dosage CDMO Market Opportunities:
-
Specialized And Personalized Formulations Drive Future Growth Opportunities for the Semi-Solid Dosage CDMO Market
The potential is provided for customized treatments relevant to the proteomic and genetic backgrounds of individual patients through TPD-based therapeutics. Through targeting the proteins that truly drive disease, TPD can offer highly selective interventions, cut off-target damage, and deliver better treatments. These individualised strategies could facilitate precision medicine in cancer, neurodegenerative, and autoimmune diseases, and lead to improved patient response and safety.
For instance, in June 2024, 32% of semi-solid products under development targeted pediatric and geriatric patients, highlighting growth in personalized formulations for specific age and sensitivity needs.
Key Semi-Solid Dosage CDMO Market Segment Analysis
-
By product, creams and lotions held the largest share of around 42.87%in 2025, and the ointments segment is expected to register the highest growth with a CAGR of 12.70%.
-
By route of administration, the topical segment dominated the market with approximately 85.53% share in 2025, while transdermal is expected to register the highest growth with a CAGR of 12.97%.
-
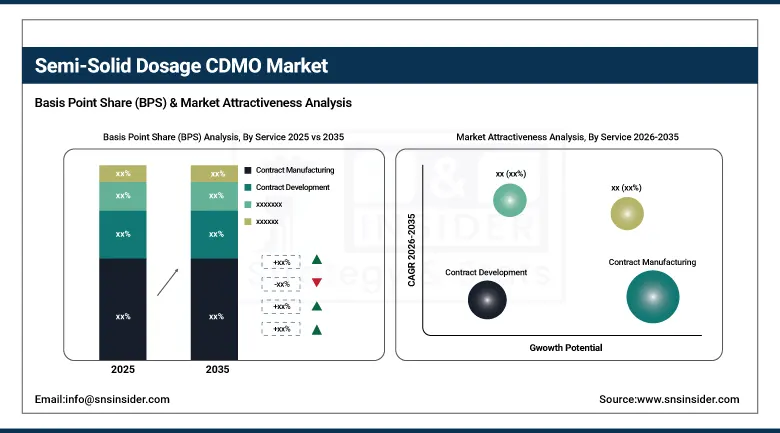
By service, contract manufacturing accounted for the leading share of nearly 69.92% in 2025, while contract development is expected to register the highest growth with a CAGR of 12.40%.
-
By end user, the pharmaceutical companies segment led the market with about 42.80% share in 2025, while the biopharmaceutical companies segment is forecasted to grow the fastest at a CAGR of 12.84%.
By Service, Contract Manufacturing Segment Lead, While Contract Development Registers Fastest Growth
The contract manufacturing segment accounted for the largest share of the Semi-Solid Dosage CDMO Market with about 69.92%, owing to pharmaceutical and biotech companies turning to third-party firms for manufacturing services in order to lower operational expenses, reduce the need for building new facilities, and tap into specialized formulation technology. In addition, the contract development segment is slated to grow at the fastest rate with a CAGR of around 12.40% throughout the forecast period of 2026–2035, as more traditional formulation expertise, stability optimization, and cutting-edge drug delivery innovation all demand specialized focus. Demand for Pharma & biotech to partner with CDMOs for complete end-to-end R&D.
By Product, Creams and Lotions Lead the Market, While Ointments Register Fastest Growth
The creams and lotions segment accounted for the highest revenue share of approximately 42.87% in 2025, as they have been extensively used in dermatology, cosmetics, and therapeutics due to providing patient-friendly non-invasive deliveries. Large-scale outsourcing, driven by high demand for OTC skincare, prescription dermatology treatments, and cosmetic cosmeceuticals. In comparison, the ointments segment is anticipated to achieve the highest CAGR of nearly 12.70% during the 2026–2035 period, driven by their predominantly occlusive properties, which are well-suited to chronically compromised skin and wound care, and for drug delivery with extended skin exposure.
By Route of Administration, the Topical Segment dominates, while the Transdermal Segment Shows Rapid Growth
The topical segment held the largest revenue share of approximately 85.53% in 2025, due to extensive use in dermatology, pain management, and cosmetic applications, and patient demand for localized non-invasive treatments. Increased OTC skincare, prescription dermatology drugs, and advanced transdermal delivery systems demand drives the outsourcing trends. On the other hand, the transdermal segment is predicted to grow at the strongest CAGR of approximately 12.97% during 2026–2035, as it slowly releases the drug into the body and can help adherence to therapy while reducing systemic effects of a drug.
By End User, Pharmaceutical Companies Segment Lead, While the Biopharmaceutical Companies Segment Grows the Fastest
The pharmaceutical companies segment held the largest revenue share of around 42.80% in the Semi-Solid Dosage CDMO Market in 2025, with their broad-based product pipelines in dermatology, pain management, and transdermal therapies that create high-volume outsourcing requirements. They need to save costs and time-to-market while adhering to the strict FDA and EMA guidelines & regulations. On the flip side, the biopharmaceutical companies segment, however, is projected to register the highest CAGR of around 12.84% during the forecast period of 2026 - 2035, as they specialize in advanced drug delivery, including biologic-embedded topicals and transdermal patches. Intensified CDMO outsourcing in specialized R&D and manufacturing competencies creates exigency and brings sustenance to the competitive intermediate phase.
Semi-Solid Dosage CDMO Market Regional Analysis
Asia Pacific Semi-Solid Dosage CDMO Market Insights
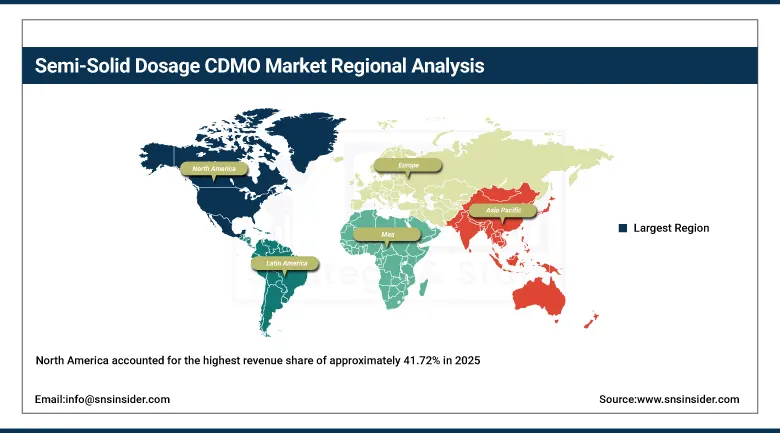
Asia-Pacific is the fastest-growing segment in the semi-solid dosage CDMO market with a CAGR of 12.91%, driven by burgeoning pharmaceutical industry growth, improved outsourcing over global drug makers, and competitive costs of production. Countries including India, China, and South Korea are spending a lot on GMP-certified semi-solid manufacturing facilities, which is attracting local and foreign clients to these regions. The occurrence of dermatological disorders on a global level, the extension of generic drug markets, and the increased adoption of OTC skincare & therapeutic products by the rising middle-class will continue to boost sales.
Get Customized Report as per Your Business Requirement - Enquiry Now
North America Semi-Solid Dosage CDMO Market Insights
North America accounted for the highest revenue share of approximately 41.72% in 2025 of the Semi-Solid Dosage CDMO Market, owing to the presence of a robust pharmaceutical and biotech ecosystem, extensive outsourcing uptake, and numerous FDA-approved manufacturing plants. Other positives are its strong and well-developed R&D infrastructure, heavy investment in dermatology and transdermal therapies, and excellent generic penetration. With lenient regulatory norms, robust intellectual property protection, and increasing consumer demand for OTC and prescription semi-solid products in bulk quantities, North America continues to remain at the top of the table on account of enhanced prevalence of innovation-led large-scale semi-solid contract manufacturing deals.
Europe Semi-Solid Dosage CDMO Market Insights
Europe is holding the second-largest market share of the semi-solid dosage CDMO market due to its well-established pharmaceutical manufacturing base, the presence of GMP-certified facilities, and the high prevalence rate of dermatological diseases and expertise in dermatology and transdermal drug delivery. Strength of the market is buoyed by the combination of advantageous regulation alignment across the EU, high demand in branded and generic semi-solids, and increasing use of CDMOs by domestic and international pharma companies to support innovation, with Germany, France, Italy, and the UK home to some bio/pharma-focused CDMOs relevant for small MedTech firms.
Latin America (LATAM) and Middle East & Africa (MEA) Semi-Solid Dosage CDMO Market Insights
Latin America and the Middle East & Africa (MEA) are evolving as potential growth regions of the semi-solid dosage CDMO market. The increasing incidence of dermatological and chronic diseases, along with growing regulatory guidelines and outsourcing of pharmaceutical services, is driving demand. Brazil, Mexico, the UAE and Saudi Arabia lead in terms of contract activity. CDMOs are using these areas for economical manufacturing and to grow in the market and reach underserved patients.
Semi-Solid Dosage CDMO Market Competitive Landscape:
Recipharm
Recipharm is a leading global contract development and manufacturing organization (CDMO) supporting pharmaceutical companies across the drug lifecycle. The company offers integrated services spanning formulation development, clinical trial material manufacturing, pilot-scale production, and commercial supply. Recipharm has strong capabilities in semi-solid, oral solid, and liquid dosage forms, serving branded and generic drug developers. Its global network of GMP-certified facilities enables flexible, scalable solutions focused on quality, speed, and regulatory compliance.
-
2023: Recipharm opened a new GMP clinical trial material suite in North Carolina, adding semi-solid formulation capabilities up to 20 liters to support early-stage topical drug development.
-
2024: Recipharm invested to upgrade its Zwickau site, expanding dry and wet granulation, tableting, and pilot-scale manufacturing to accelerate oral solid and formulated drug pipelines.
-
2025: Recipharm launched a new Pilot Scale Development Center in Germany, strengthening pilot-scale oral solid production while complementing existing semi-solid and liquid CDMO development services.
Thermo Fisher Scientific (Patheon)
Thermo Fisher Scientific, through its Patheon CDMO business, provides end-to-end drug development and manufacturing services across small molecules, biologics, and advanced therapies. The company supports pharmaceutical innovators with formulation development, clinical supply, and commercial manufacturing across oral, topical, sterile, and complex dosage forms. Patheon leverages global scale, scientific expertise, and advanced manufacturing infrastructure to help accelerate drug development timelines while maintaining high quality and regulatory standards.
-
2024: Thermo Fisher expanded its oral solid dose development and manufacturing footprint, enhancing early-stage formulation capabilities that also support adjacent semi-solid and topical drug development services.
-
2025: Thermo Fisher agreed to acquire Sanofi’s Ridgefield, New Jersey sterile manufacturing site, expanding U.S. drug product capacity and strengthening CDMO services across sterile, oral, and complex formulations.
Aenova Group
Aenova Group is a global CDMO specializing in pharmaceutical and healthcare product development and manufacturing. The company offers comprehensive services across solid, semi-solid, liquid, and sterile dosage forms, supporting customers from early development through commercial production. Aenova emphasizes formulation expertise, process innovation, and flexible manufacturing solutions. With a strong European manufacturing footprint, Aenova focuses on accelerating time-to-market while ensuring high-quality, compliant drug product delivery.
-
2023: Aenova expanded semi-solid and non-sterile liquid production at its Carugate, Italy site, installing new turbo-emulsifier systems and advanced filling equipment for complex formulations.
-
2025: Aenova introduced its Aenovation program to accelerate early pharmaceutical formulation development, strengthening CDMO capabilities including semi-solid formulation strategy and innovation support.
Semi-Solid Dosage CDMO Market Key Players:
-
Thermo Fisher Scientific
-
Aenova Group
-
Fareva
-
Famar
-
Delpharm
-
Cambrex
-
LTS Lohmann Therapie-Systeme
-
Kindeva Drug Delivery
-
Lubrizol Life Science Health
-
Evonik Health Care
-
MedPharm
-
Tergus Pharma
-
SGS Quay Pharma
-
UPM Pharmaceuticals
-
Aphena Pharma Solutions
-
CoreRx
-
Tiofarma
-
Perrigo
| Report Attributes | Details |
|---|---|
| Market Size in 2025 | USD 38.03 billion |
| Market Size by 2035 | USD 118.4 billion |
| CAGR | CAGR of 12.02% From 2026 to 2035 |
| Base Year | 2025 |
| Forecast Period | 2026-2035 |
| Historical Data | 2022-2024 |
| Report Scope & Coverage | Market Size, Segments Analysis, Competitive Landscape, Regional Analysis, DROC & SWOT Analysis, Forecast Outlook |
| Key Segments | • By Product (Ointments, Creams and Lotions, Pastes, Gels, Others) • By Route of Administration (Topical, Transdermal, Others) • By Service (Contract Development, Contract Manufacturing) • By End User (Pharmaceutical Companies, Biopharmaceutical Companies, Others) |
| Regional Analysis/Coverage | North America (US, Canada), Europe (Germany, France, UK, Italy, Spain, Poland, Russsia, Rest of Europe), Asia Pacific (China, India, Japan, South Korea, Australia,ASEAN Countries, Rest of Asia Pacific), Middle East & Africa (UAE, Saudi Arabia, Qatar, Egypt, South Africa, Rest of Middle East & Africa), Latin America (Brazil, Argentina, Mexico, Colombia Rest of Latin America) |
| Company Profiles | Recipharm, Thermo Fisher Scientific, Aenova Group, Fareva, Famar, Delpharm, NextPharma, Cambrex, LTS Lohmann Therapie-Systeme, Kindeva Drug Delivery, Lubrizol Life Science Health, Evonik Health Care, MedPharm, Tergus Pharma, SGS Quay Pharma, UPM Pharmaceuticals, Aphena Pharma Solutions, CoreRx, Tiofarma, Perrigo, and other players. |
Frequently Asked Questions
North America dominated the Semi-Solid Dosage CDMO Market in 2025.
The Creams and Lotions segment dominated the Semi-Solid Dosage CDMO Market in 2025.
Formulation Stability Challenges are Hampering the Semi-Solid Dosage CDMO Market Growth.
The Semi-Solid Dosage CDMO Market is expected to grow at a CAGR of 12.02% over the forecast period.
Get in Touch
