image

Service Bureau Market Report Scope & Overview:

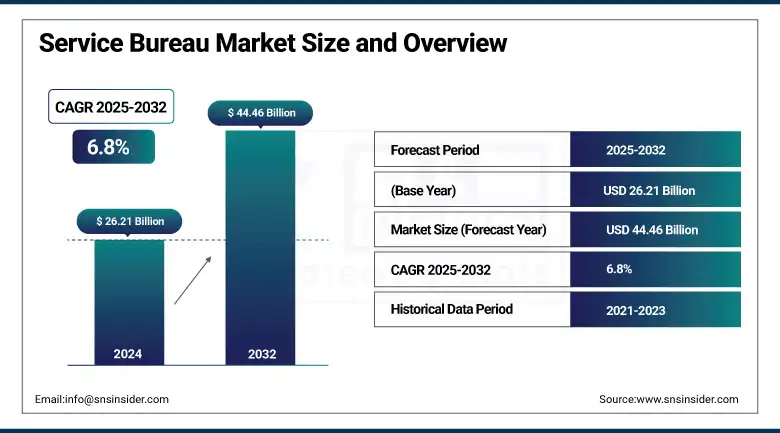
The Service Bureau Market Size was valued at USD 26.21 billion in 2024 and is expected to reach USD 44.46 billion by 2032 and grow at a CAGR of 6.8% over the forecast period 2025-2032.

The Service Bureau Market includes companies that provide outsourced services such as data processing, IT support, printing, and analytics to businesses in various industries. These service bureaus allow organizations to save on operational costs, improve the function of their processes, and gain access to specialized skills without the need to invest heavily in in-house infrastructure. Increasing digital transformation, cloud services adoption, and necessity for compliance and data security solutions to fuel the market growth. Healthcare, finance, and manufacturing are some of the key sectors that drive demand for AI systems in a sector that needs operational efficiency and regulatory compliance.

According to a study, computer support specialists are expected to grow 6% between 2023 and 2033, which is faster than the average for all jobs. This increase accounts for about 62,740 job openings each year, due to the need to replace workers leaving the labor force and the growing demand for help desk services. Likewise, the professional, scientific, and technical services industry, which includes IT outsourcing, is expected to grow at 10.5% over the same period, more than twice the growth rate for total employment of 4.2%. All of these trends highlight how important service bureaus are for specialized IT and support functions.

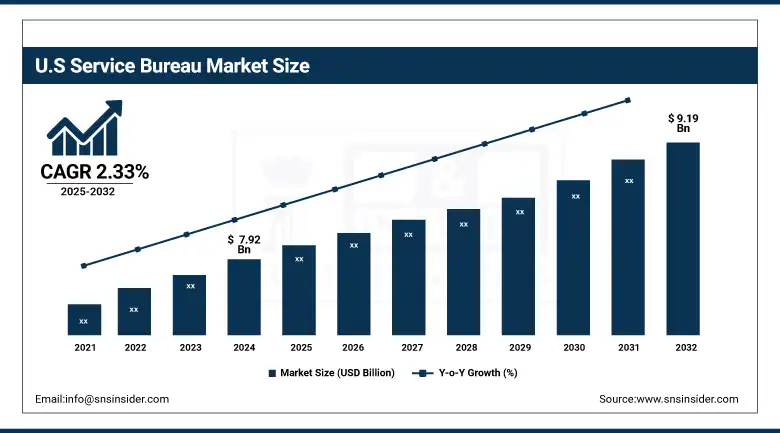
The U.S. Service Bureau Market size was USD 7.92 billion in 2024 and is expected to reach USD 9.19 billion by 2032, growing at a CAGR of 2.33% over the forecast period of 2025–2032. The rapid digital transformation across industries in the U.S. market has led to greater demand for outsourced IT, data processing, and compliance services. High technological infrastructure, high cloud computing adoption, and the presence of major service providers make the U.S. a high revenue-generating region in North America. These dynamics create a unique space for the U.S. to lead outsourcing solutions and managed services in the region.

Market Dynamics:

Key Drivers:

  • Increasing Global Demand for Outsourcing and Managed Services Drives the Growth of the Market

One of the primary drivers of the global service bureau market growth demand for outsourcing and managed services across industries globally. As companies strive to reduce operational costs and focus on core business areas, they increasingly delegate functions, such as data processing, IT support, payroll, and document management to a service bureau. The notable expansion of these trends in the Asia–Pacific and Latin America regions come from the fact that labor and technology adoption are generally cheaper in these regions compared to the East.

Likewise, big organizations also want to build lean operations across geographies and are finding service bureaus to be an efficient and centralized solution. In addition, both small businesses and corporations including service bureaus because they have scalable and customizable services. The global proliferation of digital business models, e-commerce, and work-from-home accelerates the need for flexible outsourced solutions even more. With companies across the world focusing on agility, efficiency, and digital transformation.

Restraints:

  • Lack of Standardization in Service Delivery Across Countries Restrains the market

A major restraint in the global Service Bureau Market is the lack of standardized service delivery models and regulatory frameworks across different regions. Unlike in the more regulated markets such as the U.S. and Europe, something that can dramatically taint the quality of services and compliance with laws and regulations, all of which impede transparency into the operations. This inconsistency affect multinationals that want the same level of service, data protection, and response time.

Furthermore, variations in labor laws, data privacy regulations, and technical infrastructure complicate service deployment and management. Clients may also face difficulties in enforcing contracts and ensuring accountability in regions with weaker legal enforcement. Such factors decrease the confidence that businesses have in moving mission-critical operations across borders and restrict global service bureaus from both penetrating and expanding in markets. Consequently, this non-standardization continues to be the primary barrier for smooth, international service bureau solution growth.

Opportunities:

  • Expanding Adoption of Digital Technologies in Emerging Economies Creates Substantial Growth Opportunities for the Market

The opportunities in the market is driven by the rapid digitalization of emerging economies. With most Asian-Pacific, African, and Latin American countries pumping money into IT infrastructure, cloud computing, and automation technologies, outsourced service solutions have a huge marketplace. With the rise of digitalisation among SMEs in those regions, they typically do not have the in-house expertise or a big budget to develop firm foundations for support systems. Additionally, given rising labor costs in some traditional outsourcing centers, providers are also looking at emerging regions as new places to diversify their portfolios. The digital upsurge in developing countries, along with budding entrepreneurship, makes the emerging economies a hotspot for future growth in the global Service Bureau Market.

Challenges:

  • Intense Global Competition and Pricing Pressure Pose a Critical Challenge for International Service Bureau Providers

The market expansion is challenged by the rising level of competition and pricing pressure across regions. With new players entering the market and established firms expanding their international presence, service providers are often forced to compete on cost rather than value-added services. This price-driven competition can erode profit margins, reduce service quality, and hinder investments in innovation.

Additionally, geopolitical risks, economic instability, and fluctuating foreign exchange rates make it difficult for global service bureaus to maintain consistent pricing models across different countries. The need to localize services while keeping costs under control further adds to operational complexity. Smaller firms may find it particularly difficult to compete against large global outsourcing companies with greater resources and scale.

Segmentation Analysis:

By Type

Data Processing Service Bureaus held the largest revenue share of 47% in 2024, driven by rising enterprise demand for efficient data management and automation. Industry adoption has been fueled by improved major offerings, such as the AI-Powered Data Services from IBM or Accenture Cloud-Native Processing Platforms. These improvements enable real-time analytics, regulatory compliance, and business intelligence. Due to growing volumes of data globally, this segment has remained a pillar of the service bureau market industry as it provides solutions for data-intensive industries, such as financial services, healthcare, and manufacturing, at a considerable scale and in a cost-effective, secure manner.

Payroll Service Bureaus are projected to grow at the highest CAGR of 12.05% during the forecast period, fueled by the rising need for automated, compliant payroll processing. Such enterprises as ADP, Paychex, and similar enterprises have unveiled a plethora of sophisticated AI-based platforms and mobile-ready services aimed at no-touch payroll, minimizing mistakes, and complying with the law. With the ever-increasing regulatory complexities and expansion of the global workforce, companies are forced to opt for outsourced payroll solutions.

By Industry

The Government segment held the largest revenue share of 28% in 2024, driven by increasing reliance on outsourced IT, data processing, and compliance management. Governments are collaborating with service bureaus for secure cloud migration & digitization. Examples of communications detailing these recent developments include those appearing from Accenture, through its public sector modernization tools, and CGI, through the delivery of advanced e-governance platforms. These efforts will ensure better citizen services and cybersecurity. As public agencies digitize operations, the demand for trusted, scalable service bureau solutions positions this segment as a dominant force in the market.

The Finance segment is projected to grow at the highest CAGR of 12.06% during the forecast period, fueled by the industry’s urgent need for secure, real-time data processing and regulatory compliance. Companies, such as ADP and FIS developed AI-embedded financial services platforms and global cloud-native solutions to serve banking and insurance organisations. The increasing use of fintech, complex reporting requirements, and demands for fraud prevention continue to compel financial institutions to utilize a service bureau, making this segment the fastest-growing component of the ever-evolving Service Bureau Market.

By Enterprise Size

The Medium-Sized Enterprises (100–499 employees) segment accounted for the largest revenue share of 35% in 2024, driven by its growing dependence on service bureaus to provide cheap IT, payroll, and data management. The enterprises provides scaled solutions for mid-size firms, without them having to spend on a complete in-house infrastructure. Such digital maturity and resource constraints classify this segment as a consistent revenue driver in the Service Bureau Market Outlook.

The Small Offices (1–9 employees) segment is projected to grow at the highest CAGR of 8.5% during the forecast period, as microbusinesses increasingly adopt outsourced services to improve efficiency without expanding headcount. The growth in this segment is indicative of the potential of the Service Bureau Market analysis in serving even the smaller business units across the globe, as rising entrepreneurial activity coupled with increased demand for low-cost, high-impact support drives the growth of this segment.

Regional Analysis:

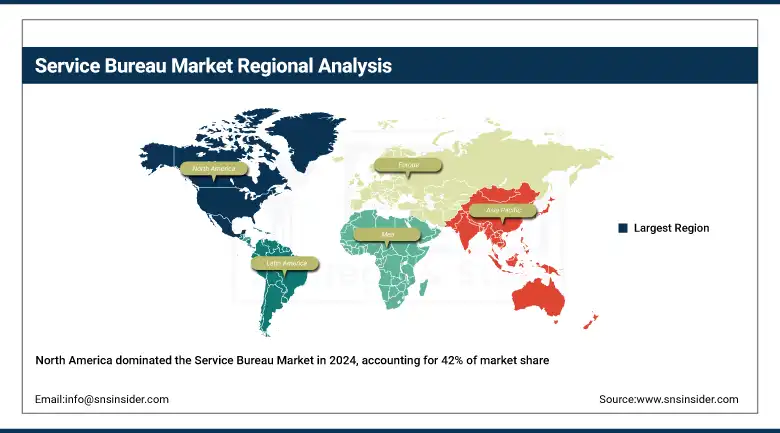
North America dominated the Market in 2024 with an Estimated Service Bureau Market Share of 42%. Market dominance is attributed to high digital transformation, modern IT infrastructure, and rising outsourcing trends in the target industries. The North American market is very much powered by the U.S., which has a very mature technology ecosystem, a large enterprise base, and a growing demand for specialized outsourced services. The country is called a leader in the Market due to government digital initiatives, cloud-first approaches, and massive implementation of AI by service delivery.

Asia-Pacific Region fastest fastest-growing region with an estimated CAGR of 12.11% in 2024. Rapid industrialization, increasing SME digitization, and low-cost service bureau offerings are propelling market growth in Asia-Pacific. Asia-Pacific Service Bureau Market is dominated by India, aided by an enormous IT human resource reservoir, lower service costs, and hyper-digital adoption among SMEs and enterprises. India is a preferred destination for service bureaus, based on government efforts including Digital India and growing global outsourcing demand across industry sectors.

In 2024, Europe showed a steady growth in the Service Bureau Market, with Germany holding the dominant share due to its advanced industrial base and ongoing digitalization in the manufacturing and finance sectors. Demand for streamlined outsourced service bureau solutions is being driven by Germany's robust manufacturing sector and emphasis on digital innovation. European firms are progressively offshoring information preparation, finance, and analysis to enhance consistency and diminishment costs. Further adoption is driven by the EU's attention to data protection (GDPR) and cloud computing.

The Middle East & Africa region is gradually emerging in the Service Bureau Market as governments push for digital transformation and smart services. The UAE leads regional growth due to strong investments in smart city initiatives, IT modernization, and paperless governance.  Latin America’s Service Bureau Market Trends is expanding steadily, led by Brazil and Mexico. Brazil’s growing fintech sector, complex regulatory environment, and rising startup ecosystem create high demand for outsourced payroll and compliance services. Service bureaus are key for SMEs seeking operational efficiency.

Key Players:

The Service Bureau Market companies are Iron Mountain Incorporated, Ricoh Company, Ltd., Xerox Corporation, Canon Business Process Services, Exela Technologies, Inc., HP Inc., Konica Minolta, Inc., Kodak Alaris, ARC Document Solutions, Inc., Kyocera Document Solutions Inc., and others.

Recent Developments:

  • February 2025 – Iron Mountain reported significant growth across its global Records and Information Management (RIM), data center, and Asset Lifecycle Management (ALM) services. This performance highlights Iron Mountain’s expanded role in outsourced document and data management services, directly aligning with the Service Bureau Market.

  • January 2025 – Ricoh was named a Leader in the IDC MarketScape: Worldwide Cloud Managed Print and Document Services Vendor Assessment. This recognition underscores Ricoh’s leadership in cloud-based document services, supporting its influence in the evolving Service Bureau Market.

Service Bureau Market Report Scope:

Report Attributes Details
Market Size in 2024 USD 26.21 Billion 
Market Size by 2032 USD 44.46 Billion 
CAGR CAGR of 6.8 % From 2025 to 2032
Base Year 2024
Forecast Period 2025-2032
Historical Data 2021-2023
Report Scope & Coverage Market Size, Segments Analysis, Competitive Landscape, Regional Analysis, DROC & SWOT Analysis, Forecast Outlook
Key Segments • By Type (Data Processing Service Bureaus, Payroll Service Bureaus, Printing and Mailing Service Bureaus, IT Service Bureaus, Others)
• By Enterprise Size (Small Offices [1–9 employees], Small Enterprises [10–99 employees], Medium-Sized Enterprises [100–499 employees], Large Enterprises [500–999 employees], Very Large Enterprises [1,000+ employees])
• By Industry Type (Finance, Healthcare, Retail, Manufacturing, Government, Education, Others)
Regional Analysis/Coverage North America (US, Canada, Mexico), Europe (Germany, France, UK, Italy, Spain, Poland, Turkey, Rest of Europe), Asia Pacific (China, India, Japan, South Korea, Singapore, Australia, Taiwan,  Rest of Asia Pacific), Middle East & Africa (UAE, Saudi Arabia, Qatar, South Africa, Rest of Middle East & Africa), Latin America (Brazil, Argentina, Rest of Latin America)
Company Profiles Iron Mountain Incorporated, Ricoh Company, Ltd., Xerox Corporation, Canon Business Process Services, Exela Technologies, Inc., HP Inc., Konica Minolta, Inc., Kodak Alaris, ARC Document Solutions, Inc., Kyocera Document Solutions Inc., and Others

Frequently Asked Questions

Ans: The Service Bureau Market is expected to grow at a CAGR of 6.8% during 2025-2032.

Ans: The Service Bureau Market size was USD 26.21 billion in 2024 and is expected to reach USD 44.46 billion by 2032.

Ans: The major growth factor of the Service Bureau Market is the increasing demand for cost-effective, outsourced digital and data processing services.

Ans: The Data Processing Service Bureaus segment dominated the Service Bureau Market.

Ans: North America dominated the Service Bureau Market in 2024.

Table of Contents

1. Introduction

1.1 Market Definition

1.2 Scope (Inclusion and Exclusions)

1.3 Research Assumptions

2. Executive Summary

2.1 Market Overview

2.2 Regional Synopsis

2.3 Competitive Summary

3. Research Methodology

3.1 Top-Down Approach

3.2 Bottom-up Approach

3.3. Data Validation

3.4 Primary Interviews

4. Market Dynamics Impact Analysis

4.1 Market Driving Factors Analysis

4.1.1 Drivers

4.1.2 Restraints

4.1.3 Opportunities

4.1.4 Challenges

4.2 PESTLE Analysis

4.3 Porter’s Five Forces Model

5. Statistical Insights and Trends Reporting

5.1 Workflow Customization Ratio

5.2 AI Utilization in Indexing and Classification

5.3 Disaster Recovery Preparedness Rate

5.4 Environmental Impact Savings

6. Competitive Landscape

6.1 List of Major Companies, By Region

6.2 Market Share Analysis, By Region

6.3 Product Benchmarking

6.3.1 Product specifications and features

6.3.2 Pricing

6.4 Strategic Initiatives

6.4.1 Marketing and promotional activities

6.4.2 Distribution and Supply Chain Strategies

6.4.3 Expansion plans and new Product launches

6.4.4 Strategic partnerships and collaborations

6.5 Technological Advancements

6.6 Market Positioning and Branding

7. Service Bureau Market Segmentation by Types

7.1 Chapter Overview

      7.2 Data Processing Service Bureaus

7.2.1 Data Processing Service Bureaus Market Trends Analysis (2021-2032)

7.2.2 Data Processing Service Bureaus Market Size Estimates and Forecasts to 2032 (USD Billion)

7.3 Payroll Service Bureaus

     7.3.1 Payroll Service Bureaus Market Trends Analysis (2021-2032)

          7.3.2 Payroll Service Bureaus Market Size Estimates and Forecasts to 2032 (USD Billion)

7.4 Printing and Mailing Service Bureaus

     7.4.1 Printing and Mailing Service Bureaus Market Trends Analysis (2021-2032)

          7.4.2 Printing and Mailing Service Bureaus Market Size Estimates and Forecasts to 2032 (USD Billion)

7.5 IT Service Bureaus

     7.5.1 IT Service Bureaus Market Trends Analysis (2021-2032)

          7.5.2 IT Service Bureaus Market Size Estimates and Forecasts to 2032 (USD Billion)

7.6 IT Service Bureaus

     7.6.1 IT Service Bureaus Market Trends Analysis (2021-2032)

          7.6.2 IT Service Bureaus Market Size Estimates and Forecasts to 2032 (USD Billion)

8. Service Bureau Market Segmentation by Enterprise Size

8.1 Chapter Overview

     8.2 Small Offices (1–9 employees)

            8.2.1 Small Offices (1–9 employees) Market Trend Analysis (2021-2032)

            8.2.2 Small Offices (1–9 employees) Market Size Estimates and Forecasts to 2032 (USD Billion)

8.3 Small Enterprises (10–99 employees)

      8.3.1 Small Enterprises (10–99 employees) Market Trends Analysis (2021-2032)

           8.3.2 Small Enterprises (10–99 employees) Market Size Estimates and Forecasts to 2032 (USD Billion)

8.4 Medium-Sized Enterprises (100–499 employees)

      8.4.1 Medium-Sized Enterprises (100–499 employees) Market Trends Analysis (2021-2032)

           8.4.2 Medium-Sized Enterprises (100–499 employees) Market Size Estimates and Forecasts to 2032 (USD Billion)

8.5 Large Enterprises (500–999 employees)

      8.5.1 Large Enterprises (500–999 employees) Market Trends Analysis (2021-2032)

           8.5.2 Large Enterprises (500–999 employees) Market Size Estimates and Forecasts to 2032 (USD Billion)

8.6 Very Large Enterprises (1,000+ employees)

      8.6.1 Very Large Enterprises (1,000+ employees) Market Trends Analysis (2021-2032)

           8.6.2 Very Large Enterprises (1,000+ employees) Market Size Estimates and Forecasts to 2032 (USD Billion)

9. Service Bureau Market Segmentation by Industry

9.1 Chapter Overview

9.2 Finance

        9.2.1 Finance Market Trends Analysis (2021-2032)

9.2.2 Finance Market Size Estimates and Forecasts to 2032 (USD Billion)

9.3 Government

        9.3.1 Government Market Trends Analysis (2021-2032)

9.3.2 Government Market Size Estimates and Forecasts to 2032 (USD Billion)

9.4 Healthcare

        9.4.1 Healthcare Market Trends Analysis (2021-2032)

9.4.2 Healthcare Market Size Estimates and Forecasts to 2032 (USD Billion)

9.5 Retail

        9.5.1 Retail Market Trends Analysis (2021-2032)

9.5.2 Retail Market Size Estimates and Forecasts to 2032 (USD Billion)

9.6 Manufacturing

        9.6.1 Manufacturing Market Trends Analysis (2021-2032)

9.6.2 Manufacturing Market Size Estimates and Forecasts to 2032 (USD Billion)

9.7 Education

        9.7.1 Education Market Trends Analysis (2021-2032)

9.7.2 Education Market Size Estimates and Forecasts to 2032 (USD Billion)

9.8 Others

        9.8.1 Others Market Trends Analysis (2021-2032)

9.8.2 Others Market Size Estimates and Forecasts to 2032 (USD Billion)

10. Regional Analysis

10.1 Chapter Overview

10.2 North America

10.2.1 Trends Analysis

10.2.2 North America Service Bureau Market Estimates and Forecasts, by Country (2021-2032) (USD Billion)

10.2.3 North America Service Bureau Market Estimates and Forecasts, by Types (2021-2032) (USD Billion) 

10.2.4 North America Service Bureau Market Estimates and Forecasts, by Enterprise Size (2021-2032) (USD Billion)

10.2.5 North America Service Bureau Market Estimates and Forecasts, by Industry (2021-2032) (USD Billion)

10.2.6 USA

10.2.6.1 USA Service Bureau Market Estimates and Forecasts, by Types (2021-2032) (USD Billion)

10.2.6.2 USA Service Bureau Market Estimates and Forecasts, by Enterprise Size (2021-2032) (USD Billion)

10.2.6.3 USA Service Bureau Market Estimates and Forecasts, by Industry (2021-2032) (USD Billion)

10.2.7 Canada

10.2.7.1 Canada Service Bureau Market Estimates and Forecasts, by Types (2021-2032) (USD Billion)

10.2.7.2 Canada Service Bureau Market Estimates and Forecasts, by Enterprise Size (2021-2032) (USD Billion)

10.2.7.3 Canada Service Bureau Market Estimates and Forecasts, by Industry (2021-2032) (USD Billion)

10.2.8 Mexico

10.2.8.1 Mexico Service Bureau Market Estimates and Forecasts, by Types (2021-2032) (USD Billion)

10.2.8.2 Mexico Service Bureau Market Estimates and Forecasts, by Enterprise Size (2021-2032) (USD Billion)

10.2.8.3 Mexico Service Bureau Market Estimates and Forecasts, by Industry (2021-2032) (USD Billion)

10.3 Europe

10.3.1 Trends Analysis

10.3.2 Eastern Europe Service Bureau Market Estimates and Forecasts, by Country (2021-2032) (USD Billion)

10.3.3 Eastern Europe Service Bureau Market Estimates and Forecasts, by Types (2021-2032) (USD Billion) 

10.3.4 Eastern Europe Service Bureau Market Estimates and Forecasts, by Enterprise Size (2021-2032) (USD Billion)

10.3.5 Eastern Europe Service Bureau Market Estimates and Forecasts, by Industry (2021-2032) (USD Billion)

10.3.6 Germany

10.3.6.1 Germany Service Bureau Market Estimates and Forecasts, by Types (2021-2032) (USD Billion)

10.3.6.2 Germany Service Bureau Market Estimates and Forecasts, by Enterprise Size (2021-2032) (USD Billion)

10.3.6.3 Germany Service Bureau Market Estimates and Forecasts, by Industry (2021-2032) (USD Billion)

10.3.7 France

10.3.7.1 France Service Bureau Market Estimates and Forecasts, by Types (2021-2032) (USD Billion)

10.3.7.2 France Service Bureau Market Estimates and Forecasts, by Enterprise Size (2021-2032) (USD Billion)

10.3.7.3 France Service Bureau Market Estimates and Forecasts, by Industry (2021-2032) (USD Billion)

10.3.8 UK

10.3.8.1 UK Service Bureau Market Estimates and Forecasts, by Types (2021-2032) (USD Billion)

10.3.8.2 UK Service Bureau Market Estimates and Forecasts, by Enterprise Size (2021-2032) (USD Billion)

10.3.8.3 UK Service Bureau Market Estimates and Forecasts, by Industry (2021-2032) (USD Billion)

10.3.9 Italy

10.3.9.1 Italy Service Bureau Market Estimates and Forecasts, by Types (2021-2032) (USD Billion)

10.3.9.2 Italy Service Bureau Market Estimates and Forecasts, by Enterprise Size (2021-2032) (USD Billion)

10.3.9.3 Italy Service Bureau Market Estimates and Forecasts, by Industry (2021-2032) (USD Billion)

10.3.10 Spain

10.3.10.1 Spain Service Bureau Market Estimates and Forecasts, by Types (2021-2032) (USD Billion)

10.3.10.2 Spain Service Bureau Market Estimates and Forecasts, by Enterprise Size (2021-2032) (USD Billion)

10.3.10.3 Spain Service Bureau Market Estimates and Forecasts, by Industry (2021-2032) (USD Billion)

10.3.11 Poland

10.3.11.1 Poland Service Bureau Market Estimates and Forecasts, by Types (2021-2032) (USD Billion)

10.3.11.2 Poland Service Bureau Market Estimates and Forecasts, by Enterprise Size (2021-2032) (USD Billion)

10.3.11.3 Poland Service Bureau Market Estimates and Forecasts, by Industry (2021-2032) (USD Billion)

10.3.12 Turkey

10.3.12.1 Turkey Service Bureau Market Estimates and Forecasts, by Types (2021-2032) (USD Billion)

10.3.12.2 Turkey Service Bureau Market Estimates and Forecasts, by Enterprise Size (2021-2032) (USD Billion)

10.3.12.3 Turkey Service Bureau Market Estimates and Forecasts, by Industry (2021-2032) (USD Billion)

10.3.13 Rest of Europe

10.3.13.1 Rest of Europe Service Bureau Market Estimates and Forecasts, by Types (2021-2032) (USD Billion)

10.3.13.2 Rest of Europe Service Bureau Market Estimates and Forecasts, by Enterprise Size (2021-2032) (USD Billion)

10.3.13.3 Rest of Europe Service Bureau Market Estimates and Forecasts, by Industry (2021-2032) (USD Billion)

10.4 Asia Pacific

10.4.1 Trends Analysis

10.4.2 Asia Pacific Service Bureau Market Estimates and Forecasts, by Country (2021-2032) (USD Billion)

10.4.3 Asia Pacific Service Bureau Market Estimates and Forecasts, by Types (2021-2032) (USD Billion) 

10.4.4 Asia Pacific Service Bureau Market Estimates and Forecasts, by Enterprise Size (2021-2032) (USD Billion)

10.4.5 Asia Pacific Service Bureau Market Estimates and Forecasts, by Industry (2021-2032) (USD Billion)

10.4.6 China

10.4.6.1 China Service Bureau Market Estimates and Forecasts, by Types (2021-2032) (USD Billion)

10.4.6.2 China Service Bureau Market Estimates and Forecasts, by Enterprise Size (2021-2032) (USD Billion)

10.4.6.3 China Service Bureau Market Estimates and Forecasts, by Industry (2021-2032) (USD Billion)

10.4.7 India

10.4.7.1 India Service Bureau Market Estimates and Forecasts, by Types (2021-2032) (USD Billion)

10.4.7.2 India Service Bureau Market Estimates and Forecasts, by Enterprise Size (2021-2032) (USD Billion)

10.4.7.3 India Service Bureau Market Estimates and Forecasts, by Industry (2021-2032) (USD Billion)

10.4.8 Japan

10.4.8.1 Japan Service Bureau Market Estimates and Forecasts, by Types (2021-2032) (USD Billion)

10.4.8.2 Japan Service Bureau Market Estimates and Forecasts, by Enterprise Size (2021-2032) (USD Billion)

10.4.8.3 Japan Service Bureau Market Estimates and Forecasts, by Industry (2021-2032) (USD Billion)

10.4.9 South Korea

10.4.9.1 South Korea Service Bureau Market Estimates and Forecasts, by Types (2021-2032) (USD Billion)

10.4.9.2 South Korea Service Bureau Market Estimates and Forecasts, by Enterprise Size (2021-2032) (USD Billion)

10.4.9.3 South Korea Service Bureau Market Estimates and Forecasts, by Industry (2021-2032) (USD Billion)

10.4.10 Singapore

10.4.10.1 Singapore Service Bureau Market Estimates and Forecasts, by Types (2021-2032) (USD Billion)

10.4.10.2 Singapore Service Bureau Market Estimates and Forecasts, by Enterprise Size (2021-2032) (USD Billion)

10.4.10.3 Singapore Service Bureau Market Estimates and Forecasts, by Industry (2021-2032) (USD Billion)

10.4.11 Australia

10.4.11.1 Australia Service Bureau Market Estimates and Forecasts, by Types (2021-2032) (USD Billion)

10.4.11.2 Australia Service Bureau Market Estimates and Forecasts, by Enterprise Size (2021-2032) (USD Billion)

10.4.11.3 Australia Service Bureau Market Estimates and Forecasts, by Industry (2021-2032) (USD Billion)

10.4.12 Rest of Asia Pacific

10.4.12.1 Rest of Asia Pacific Service Bureau Market Estimates and Forecasts, by Types (2021-2032) (USD Billion)

10.4.12.2 Rest of Asia Pacific Service Bureau Market Estimates and Forecasts, by Enterprise Size (2021-2032) (USD Billion)

10.4.12.3 Rest of Asia Pacific Service Bureau Market Estimates and Forecasts, by Industry (2021-2032) (USD Billion)

10.5 Middle East and Africa

10.5.1 Trends Analysis

10.5.2 Middle East & Africa Service Bureau Market Estimates and Forecasts, by Country (2021-2032) (USD Billion)

10.5.3 Middle East & Africa Service Bureau Market Estimates and Forecasts, by Types (2021-2032) (USD Billion) 

10.5.4 Middle East & Africa Service Bureau Market Estimates and Forecasts, by Enterprise Size (2021-2032) (USD Billion)

10.5.5 Middle East & Africa Service Bureau Market Estimates and Forecasts, by Industry (2021-2032) (USD Billion)

10.5.6 UAE

10.5.6.1 UAE Service Bureau Market Estimates and Forecasts, by Types (2021-2032) (USD Billion)

10.5.6.2 UAE Service Bureau Market Estimates and Forecasts, by Enterprise Size (2021-2032) (USD Billion)

10.5.6.3 UAE Service Bureau Market Estimates and Forecasts, by Industry (2021-2032) (USD Billion)

10.5.7 Saudi Arabia

10.5.7.1 Saudi Arabia Service Bureau Market Estimates and Forecasts, by Types (2021-2032) (USD Billion)

10.5.7.2 Saudi Arabia Service Bureau Market Estimates and Forecasts, by Enterprise Size (2021-2032) (USD Billion)

10.5.7.3 Saudi Arabia Service Bureau Market Estimates and Forecasts, by Industry (2021-2032) (USD Billion)

10.5.8 Qatar

10.5.8.1 Qatar Service Bureau Market Estimates and Forecasts, by Types (2021-2032) (USD Billion)

10.5.8.2 Qatar Service Bureau Market Estimates and Forecasts, by Enterprise Size (2021-2032) (USD Billion)

10.5.8.3 Qatar Service Bureau Market Estimates and Forecasts, by Industry (2021-2032) (USD Billion)

10.5.9 South Africa

10.5.9.1 South Africa Service Bureau Market Estimates and Forecasts, by Types (2021-2032) (USD Billion)

10.5.9.2 South Africa Service Bureau Market Estimates and Forecasts by Enterprise Size (2021-2032) (USD Billion)

10.5.9.3 South Africa Service Bureau Market Estimates and Forecasts, by Industry (2021-2032) (USD Billion)

10.5.10 Rest of Middle East & Africa

10.5.10.1 Rest of Middle East & Africa Service Bureau Market Estimates and Forecasts, by Types (2021-2032) (USD Billion)

10.5.10.2 Rest of Middle East & Africa Service Bureau Market Estimates and Forecasts, by Enterprise Size (2021-2032) (USD Billion)

10.5.10.3 Rest of Middle East & Africa Service Bureau Market Estimates and Forecasts, by Industry (2021-2032) (USD Billion)

10.6 Latin America

10.6.1 Trends Analysis

10.6.2 Latin America Service Bureau Market Estimates and Forecasts, by Country (2021-2032) (USD Billion)

10.6.3 Latin America Service Bureau Market Estimates and Forecasts, by Types (2021-2032) (USD Billion) 

10.6.4 Latin America Service Bureau Market Estimates and Forecasts, by Enterprise Size (2021-2032) (USD Billion)

10.6.5 Latin America Service Bureau Market Estimates and Forecasts, by Industry (2021-2032) (USD Billion)

10.6.6 Brazil

10.6.6.1 Brazil Service Bureau Market Estimates and Forecasts, by Types (2021-2032) (USD Billion)

10.6.6.2 Brazil Service Bureau Market Estimates and Forecasts, by Enterprise Size (2021-2032) (USD Billion)

10.6.6.3 Brazil Service Bureau Market Estimates and Forecasts, by Industry (2021-2032) (USD Billion)

10.6.7 Argentina

10.6.7.1 Argentina Service Bureau Market Estimates and Forecasts, by Types (2021-2032) (USD Billion)

10.6.7.2 Argentina Service Bureau Market Estimates and Forecasts, by Enterprise Size (2021-2032) (USD Billion)

10.6.7.3 Argentina Service Bureau Market Estimates and Forecasts, by Industry (2021-2032) (USD Billion)

10.6.8 Rest of Latin America

10.6.8.1 Rest of Latin America Service Bureau Market Estimates and Forecasts, by Types (2021-2032) (USD Billion)

10.6.8.2 Rest of Latin America Service Bureau Market Estimates and Forecasts, by Enterprise Size (2021-2032) (USD Billion)

10.6.8.3 Rest of Latin America Service Bureau Market Estimates and Forecasts, by Industry (2021-2032) (USD Billion)

11. Company Profiles

11.1 Iron Mountain Incorporated

11.1.1 Company Overview

11.1.2 Financial

11.1.3 Product/ Services Offered

11.1.4 SWOT Analysis

11.2 Ricoh Company, Ltd.

11.2.1 Company Overview

11.2.2 Financial

11.2.3 Product/ Services Offered

11.2.4 SWOT Analysis

11.3 Xerox Corporation

11.3.1 Company Overview

11.3.2 Financial

11.3.3 Product/ Services Offered

11.3.4 SWOT Analysis

11.4 Canon Business Process Services

11.4.1 Company Overview

11.4.2 Financial

11.4.3 Product/ Services Offered

11.4.4 SWOT Analysis

11.5 Exela Technologies, Inc.

11.5.1 Company Overview

11.5.2 Financial

11.5.3 Product/ Services Offered

11.5.4 SWOT Analysis

11.6 HP Inc.

11.6.1 Company Overview

11.6.2 Financial

11.6.3 Product/ Services Offered

11.6.4 SWOT Analysis

11.7 Konica Minolta, Inc.

11.7.1 Company Overview

11.7.2 Financial

11.7.3 Product/ Services Offered

11.7.4 SWOT Analysis

11.8 Kodak Alaris

11.8.1 Company Overview

11.8.2 Financial

11.8.3 Product/ Services Offered

11.8.4 SWOT Analysis

11.9 ARC Document Solutions, Inc.

11.9.1 Company Overview

11.9.2 Financial

11.9.3 Product/ Services Offered

11.9.4 SWOT Analysis

11.10 Kyocera Document Solutions Inc.

11.10.1 Company Overview

11.10.2 Financial

11.10.3 Product/ Services Offered

11.10.4 SWOT Analysis

12. Use Cases and Best Practices

13. Conclusion

An accurate research report requires proper strategizing as well as implementation. There are multiple factors involved in the completion of good and accurate research report and selecting the best methodology to compete the research is the toughest part. Since the research reports we provide play a crucial role in any company’s decision-making process, therefore we at SNS Insider always believe that we should choose the best method which gives us results closer to reality. This allows us to reach at a stage wherein we can provide our clients best and accurate investment to output ratio.

Each report that we prepare takes a timeframe of 350-400 business hours for production. Starting from the selection of titles through a couple of in-depth brain storming session to the final QC process before uploading our titles on our website we dedicate around 350 working hours. The titles are selected based on their current market cap and the foreseen CAGR and growth.


The 5 steps process:

Step 1: Secondary Research:

Secondary Research or Desk Research is as the name suggests is a research process wherein, we collect data through the readily available information. In this process we use various paid and unpaid databases which our team has access to and gather data through the same. This includes examining of listed companies’ annual reports, Journals, SEC filling etc. Apart from this our team has access to various associations across the globe across different industries. Lastly, we have exchange relationships with various university as well as individual libraries.

Secondary Research

Step 2: Primary Research

When we talk about primary research, it is a type of study in which the researchers collect relevant data samples directly, rather than relying on previously collected data.  This type of research is focused on gaining content specific facts that can be sued to solve specific problems. Since the collected data is fresh and first hand therefore it makes the study more accurate and genuine.

We at SNS Insider have divided Primary Research into 2 parts.

Part 1 wherein we interview the KOLs of major players as well as the upcoming ones across various geographic regions. This allows us to have their view over the market scenario and acts as an important tool to come closer to the accurate market numbers. As many as 45 paid and unpaid primary interviews are taken from both the demand and supply side of the industry to make sure we land at an accurate judgement and analysis of the market.

This step involves the triangulation of data wherein our team analyses the interview transcripts, online survey responses and observation of on filed participants. The below mentioned chart should give a better understanding of the part 1 of the primary interview.

Primary Research

Part 2: In this part of primary research the data collected via secondary research and the part 1 of the primary research is validated with the interviews from individual consultants and subject matter experts.

Consultants are those set of people who have at least 12 years of experience and expertise within the industry whereas Subject Matter Experts are those with at least 15 years of experience behind their back within the same space. The data with the help of two main processes i.e., FGDs (Focused Group Discussions) and IDs (Individual Discussions). This gives us a 3rd party nonbiased primary view of the market scenario making it a more dependable one while collation of the data pointers.

Step 3: Data Bank Validation

Once all the information is collected via primary and secondary sources, we run that information for data validation. At our intelligence centre our research heads track a lot of information related to the market which includes the quarterly reports, the daily stock prices, and other relevant information. Our data bank server gets updated every fortnight and that is how the information which we collected using our primary and secondary information is revalidated in real time.

Data Bank Validation

Step 4: QA/QC Process

After all the data collection and validation our team does a final level of quality check and quality assurance to get rid of any unwanted or undesired mistakes. This might include but not limited to getting rid of the any typos, duplication of numbers or missing of any important information. The people involved in this process include technical content writers, research heads and graphics people. Once this process is completed the title gets uploader on our platform for our clients to read it.

Step 5: Final QC/QA Process:

This is the last process and comes when the client has ordered the study. In this process a final QA/QC is done before the study is emailed to the client. Since we believe in giving our clients a good experience of our research studies, therefore, to make sure that we do not lack at our end in any way humanly possible we do a final round of quality check and then dispatch the study to the client.

Key Segments: 

By Types

    • Data Processing Service Bureaus

    • Payroll Service Bureaus

    • Printing and Mailing Service Bureaus

    • IT Service Bureaus

    • Others

By Enterprise Size

    • Small Offices (1–9 employees)

    • Small Enterprises (10–99 employees)

    • Medium-Sized Enterprises (100–499 employees)

    • Large Enterprises (500–999 employees)

    • Very Large Enterprises (1,000+ employees)

By Industry

    • Finance

    • Healthcare

    • Retail

    • Manufacturing

    • Government

    • Education

    • Others

Request for Segment Customization as per your Business Requirement: Segment Customization Request

Regional Coverage: 

North America

  • US

  • Canada

  • Mexico

Europe

  • Germany

  • France

  • UK

  • Italy

  • Spain

  • Poland

  • Turkey

  • Rest of Europe

Asia Pacific

  • China

  • India

  • Japan

  • South Korea

  • Singapore

  • Australia

  • Rest of Asia Pacific

Middle East & Africa

  • UAE

  • Saudi Arabia

  • Qatar

  • South Africa

  • Rest of Middle East & Africa

Latin America

  • Brazil

  • Argentina

  • Rest of Latin America

Request for Country Level Research Report: Country Level Customization Request

Available Customization 

With the given market data, SNS Insider offers customization as per the company’s specific needs. The following customization options are available for the report: 

  • Detailed Volume Analysis 

  • Criss-Cross segment analysis (e.g. Product X Application) 

  • Competitive Product Benchmarking 

  • Geographic Analysis 

  • Additional countries in any of the regions 

  • Customized Data Representation 

  • Detailed analysis and profiling of additional market players

Explore Key Insights 


  • Analyzes market trends, forecasts, and regional dynamics
  • Covers core offerings, innovations, and industry use cases
  • Profiles major players, value chains, and strategic developments
  • Highlights innovation trends, regulatory impacts, and growth opportunities
Request an Analyst Call