image

Service Delivery Platform Market Size, Share & Segmentation By Organization Size (Small and Medium Enterprises (SMEs), Large Enterprises), Telecom Service Sector (Mobile, PSTN (Public Switched Telephone Network), Business Data Services, Residential Broadband), Application (Communication and Collaboration, Enterprise Mobility and BYOD (Bring Your Own Device), Unified Communications, Content Delivery), End-User Industry (Healthcare, Banking, Financial Services, and Insurance (BFSI), Retail, IT and Telecom, Government, Energy and Utilities, Manufacturing), Region | Global Forecast 2025-2032

Date: July 2025 Report Code: SNS/ICT/7861 Page 300

Service Delivery Platform Market Report Scope & Overview:

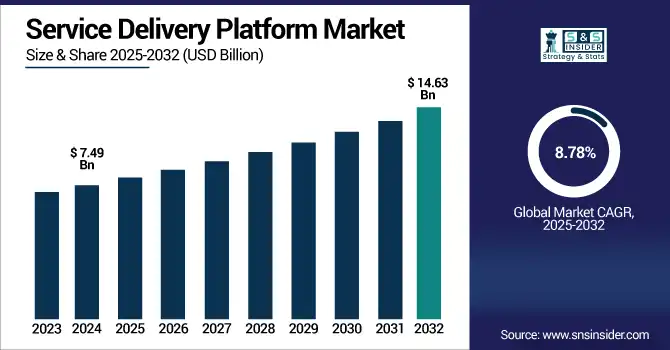
Service Delivery Platform Market was valued at USD 7.49 billion in 2024 and is expected to reach USD 14.63 billion by 2032, growing at a CAGR of 8.78% from 2025-2032. 

The growth of the Service Delivery Platform (SDP) market is driven by the rapid adoption of cloud-native technologies, rising demand for seamless digital service experiences, and increasing telecom operator focus on network function virtualization (NFV) and 5G integration.

  • According to the U.S. Department of Energy (via NCBI), Software-Defined Networking (SDN) and NFV in 5G operations can reduce total cost of ownership by approximately 25%, covering both RAN and core network infrastructure.

  • Additionally, a U.S. government-supported NTIA whitepaper highlights that cloud-native, containerized architectures such as those combining AWS with RIFT.ware enable rapid deployment, auto-scaling, and elasticity, further lowering operational costs compared to traditional hardware-centric approaches.

Enterprises are leveraging SDP to centralize service orchestration, enhance time-to-market, and reduce operational complexity. The surge in connected devices and IoT services is also boosting the need for scalable and flexible platforms. Furthermore, growing emphasis on customer-centric service models, AI-based automation, and the convergence of communication and content delivery services is accelerating the platform’s adoption across diverse end-user industries.

U.S. Service Delivery Platform Market was valued at USD 1.83 billion in 2024 and is expected to reach USD 3.54 billion by 2032, growing at a CAGR of 8.57% from 2025-2032. 

The U.S. Service Delivery Platform market is growing due to increased 5G deployment, rising demand for digital service integration, cloud migration, and telecom operators’ focus on virtualization and automation to streamline operations, enhance user experience, and support diverse service offerings.

Market Dynamics

Drivers

  • Surging popularity of cloud-native solutions is prompting investments in scalable and modular Service Delivery Platform frameworks.

Organizations are shifting from legacy systems to cloud-native architectures for better flexibility and scalability in delivering digital services. SDPs built on cloud-native infrastructure allow rapid deployment, dynamic resource allocation, and cost optimization. With digital transformation initiatives accelerating across telecom, media, and IT sectors, service providers increasingly rely on these platforms to ensure availability, high performance, and adaptability. Cloud-native SDPs also enhance automation and simplify orchestration across hybrid environments, further boosting adoption. Their role in enabling digital-first business models is a key driver of sustained market growth.

  • As reported in a Microsoft-led NTIA whitepaper, more than 100 mobile network operators use Microsoft’s virtualized packet core, and over 400 leverage their virtualized voice service infrastructure highlighting the shift away from hardware-centric systems.

Restraints

  • Substantial upfront investment costs and uncertain ROI discourage smaller operators from deploying Service Delivery Platforms.

Deploying an SDP often requires a considerable initial investment in hardware, software, skilled personnel, and systems integration. For small and mid-sized service providers, this can be a prohibitive barrier, especially when the return on investment remains uncertain due to rapidly evolving technologies and changing consumer preferences. The financial risks associated with large-scale deployment limit adoption in emerging markets where revenue streams are more volatile. These economic constraints hinder market expansion, particularly among telecom operators operating on tighter margins or those serving low-ARPU (average revenue per user) customer segments.

Opportunities

  • Expansion of IoT ecosystems creates a vast potential market for Service Delivery Platforms to manage diverse device-based services.

As IoT adoption accelerates across industries, there is a growing need for platforms that can seamlessly provision, monitor, and scale services across billions of connected devices. SDPs provide this functionality by enabling automated service management, authentication, and policy control for heterogeneous IoT environments. Their ability to handle real-time data flows and support open APIs positions them as foundational tools for smart home, industrial IoT, and connected mobility solutions. This surge in IoT deployments presents a long-term opportunity for SDP vendors to deliver integrated, secure, and flexible service frameworks.

  • Nearly 97% of enterprises report security challenges when deploying IoT, highlighting the importance of integrated SDP security layers. Microsoft also highlighted how billions of sensors are powering complex deployments from agriculture to smart cities while pointing out that about 40% of edge data is noisy, showcasing the need for robust SDP filtering and orchestration.

Challenges

  • Ensuring security and data privacy across distributed Service Delivery Platforms remains a major technical and regulatory hurdle.

With SDPs operating across multiple services and cloud environments, maintaining robust data security and user privacy becomes complex. They are frequent targets for cyberattacks due to their role in managing critical customer and business data. Moreover, differing international regulations like GDPR, HIPAA, or CCPA increase the compliance burden. Inadequate security frameworks or misconfigurations can result in breaches, service disruptions, and reputational damage. Balancing openness and integration capabilities with stringent security controls continues to challenge both platform developers and telecom operators in this evolving threat landscape.

  • 82% of data breaches involve cloud-stored data, primarily due to misconfiguration and human error underscoring how easily SDP environments can be compromised when not properly managed.

  • According to Check Point’s 2023 Cloud Security Report, 59% of security professionals cite misconfiguration as the top cloud threat, with 48% reporting a surge in cloud-based network attacks.

Segment Analysis

By Organization Size

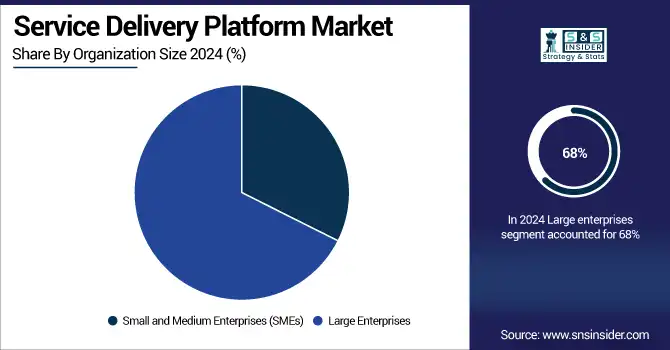
Large enterprises dominated the Service Delivery Platform Market in 2024, accounting for approximately 68% revenue share due to their ability to invest in scalable, integrated service frameworks. These organizations prioritize agility and customer experience, leveraging SDPs to streamline operations across diverse geographies and business units. Their need for managing large volumes of data and complex service ecosystems drives continued SDP adoption and high expenditure.

Small and Medium-sized Enterprises (SMEs) are projected to grow at the fastest CAGR of 10.39% from 2025 to 2032 due to increasing digitization and affordability of cloud-based SDPs. SMEs are leveraging these platforms to accelerate service innovation, reduce operational costs, and enhance customer engagement. As competition intensifies, SDPs offer them the agility and automation needed to scale efficiently without heavy infrastructure investments.

By End-User Industry

The IT and Telecom segment led the Service Delivery Platform Market in 2024 with a 28% revenue share, driven by rising demand for converged service management. Telecom operators increasingly rely on SDPs to unify billing, content delivery, and subscriber services. With the rollout of 5G, IoT, and edge services, these platforms have become critical to delivering high-performance, real-time digital experiences and optimizing network resources.

The healthcare segment is expected to grow at the fastest CAGR of 11.69% from 2025 to 2032 as providers adopt SDPs to enable telemedicine, patient engagement, and data interoperability. Increased focus on digital health transformation, remote monitoring, and compliance with data privacy regulations is pushing healthcare systems to modernize their IT infrastructure. SDPs help integrate diverse health services while ensuring scalability and patient-centric care delivery.

By Application

The Communication and Collaboration segment dominated the Service Delivery Platform Market in 2024 with a 30% revenue share, owing to widespread enterprise adoption of unified communication tools. SDPs support real-time messaging, video conferencing, and collaboration apps across distributed teams. The post-pandemic shift toward hybrid work environments has intensified the need for seamless, secure, and scalable service integration, making this segment a consistent revenue leader.

Enterprise Mobility and BYOD (Bring Your Own Device) is anticipated to grow at the fastest CAGR of 10.50% from 2025 to 2032 due to increasing workplace digitization and mobile workforce expansion. Organizations are turning to SDPs to ensure secure access, device management, and service consistency across user-owned devices. The flexibility and cost-efficiency of BYOD policies are driving higher platform adoption to support dynamic and remote work models.

By Telecom Service Sector

The mobile segment held the largest revenue share of approximately 48% in the Service Delivery Platform Market in 2024 and is projected to grow at the fastest CAGR of 9.66% from 2025 to 2032. This dominance and rapid growth are driven by the explosive increase in mobile subscribers, demand for real-time services, and widespread 4G/5G adoption. Mobile operators rely heavily on SDPs to deliver value-added services, personalized content, and seamless user experiences across devices. The growing consumption of mobile data and apps continues to fuel platform investments, especially in emerging digital economies.

Regional Analysis

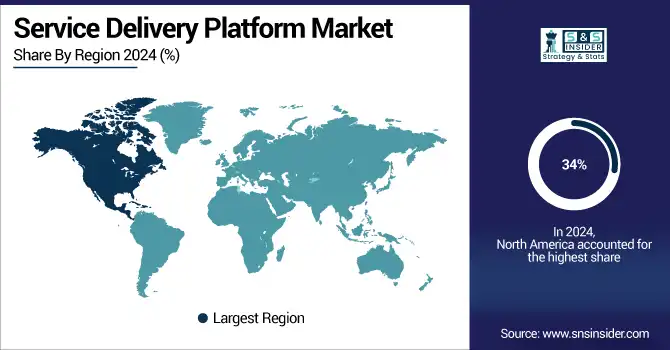
North America led the Service Delivery Platform Market in 2024 with a 34% revenue share due to its advanced digital infrastructure, early adoption of 5G, and high concentration of major telecom and IT firms. The region’s strong focus on customer experience, automation, and innovation drives continued investments in SDPs. Regulatory support and widespread enterprise digitization further strengthen North America’s leadership in platform deployment and scalability.

The United States is dominating the Service Delivery Platform Market due to its advanced telecom infrastructure, high digital adoption, and strong presence of leading technology providers.

Asia Pacific is projected to grow at the fastest CAGR of 10.43% from 2025 to 2032, driven by expanding mobile connectivity, rapid urbanization, and digital transformation across emerging economies like India and Southeast Asia. Increasing internet penetration, rising smartphone users, and government-backed digital initiatives are pushing enterprises and telecom operators to adopt SDPs. The region’s untapped potential makes it a major growth frontier.

China is dominating the Service Delivery Platform Market in Asia Pacific due to its massive mobile user base, rapid 5G rollout, and strong digital infrastructure.

Europe holds a significant share in the Service Delivery Platform Market due to growing investments in 5G, strong enterprise IT adoption, and supportive regulatory frameworks. Countries like Germany, the UK, and France lead with advanced telecom networks and digital transformation initiatives.

Germany is dominating the Service Delivery Platform Market in Europe, driven by its strong telecom sector, robust enterprise digitization, and early 5G and IoT adoption.

The Middle East & Africa and Latin America are emerging markets in the Service Delivery Platform space, driven by expanding telecom infrastructure, rising mobile penetration, and increasing digital service adoption, especially in urban centers and among younger populations.

Key Players

HCL Technologies, Fujitsu, SGK International, Cisco Systems, Accenture, Tech Mahindra, BMC Software, SAP, Accelerite, Amdocs, CA Technologies, Ericsson, HP, Huawei, IBM, Oracle, Microsoft, Nokia, Telenity, ZTE and others.

Recent Developments:

  • 2025 – HCLTech expands partnership with The Standard to accelerate AI‑led transformation and deliver digital‑first services at scale through GenAI‑led platform and cloud services.

  • 2024 – IBM and ServiceNow collaborate: ServiceNow’s Now Platform will integrate IBM watsonx.ai and IBM Granite models into Now Assist GenAI, enhancing enterprise workflow productivity.

Service Delivery Platform Market Report Scope:

Report Attributes Details
Market Size in 2024 USD 7.49 Billion 
Market Size by 2032 USD 14.63 Billion 
CAGR CAGR of 8.78% From 2025 to 2032
Base Year 2024
Forecast Period 2025-2032
Historical Data 2021-2023
Report Scope & Coverage Market Size, Segments Analysis, Competitive Landscape, Regional Analysis, DROC & SWOT Analysis, Forecast Outlook
Key Segments • By Organization Size (Small and Medium Enterprises (SMEs), Large Enterprises)
• By Telecom Service Sector (Mobile, PSTN (Public Switched Telephone Network), Business Data Services, Residential Broadband)
• By Application (Communication and Collaboration, Enterprise Mobility and BYOD (Bring Your Own Device), Unified Communications, Content Delivery)
• By End-User Industry (Healthcare, Banking, Financial Services, and Insurance (BFSI), Retail, IT and Telecom, Government, Energy and Utilities, Manufacturing)
Regional Analysis/Coverage North America (US, Canada), Europe (Germany, UK, France, Italy, Spain, Russia, Poland, Rest of Europe), Asia Pacific (China, India, Japan, South Korea, Australia, ASEAN Countries, Rest of Asia Pacific), Middle East & Africa (UAE, Saudi Arabia, Qatar, South Africa, Rest of Middle East & Africa), Latin America (Brazil, Argentina, Mexico, Colombia, Rest of Latin America).
Company Profiles HCL Technologies, Fujitsu, SGK International, Cisco Systems, Accenture, Tech Mahindra, BMC Software, SAP, Accelerite, Amdocs, CA Technologies, Ericsson, HP, Huawei, IBM, Oracle, Microsoft, Nokia, Telenity, ZTE

Frequently Asked Questions

Ans: The Service Delivery Platform Market is expected to grow at a CAGR of 8.78% from 2025 to 2032, reaching USD 14.63 billion by 2032.

Ans: In 2024, the Service Delivery Platform Market was valued at USD 7.49 billion, led by strong adoption across telecom, IT, and enterprise sectors.

Ans: Key growth drivers include cloud-native technology adoption, rising 5G deployment, and increasing demand for seamless digital service integration and automation.

Ans: The mobile segment dominated with 48% revenue share in 2024 and is projected to grow at a CAGR of 9.66% through 2032.

Ans: North America dominated the market with a 34% revenue share in 2024, driven by advanced digital infrastructure and high 5G adoption.

Table Of Contents

1. Introduction

1.1 Market Definition & Scope

 1.2 Research Assumptions & Abbreviations

 1.3 Research Methodology

2. Executive Summary

2.1 Market Snapshot

 2.2 Market Absolute $ Opportunity Assessment & Y-o-Y Analysis, 2021–2032

 2.3 Market Size & Forecast, By Segmentation, 2021–2032

  2.3.1 Market Size By Organization Size

  2.3.2 Market Size By Application

  2.3.1 Market Size By Telecom Service Sector

  2.3.2 Market Size By End-User Industry

 2.4 Market Share & Bps Analysis By Region, 2024

 2.5 Industry Growth Scenarios – Conservative, Likely & Optimistic

 2.6 Industry CxO’s Perspective

3. Market Overview

3.1 Market Dynamics

  3.1.1 Drivers

  3.1.2 Restraints

  3.1.3 Opportunities

  3.1.4 Key Market Trends

 3.2 Industry PESTLE Analysis

 3.3 Key Industry Forces (Porter’s) Impacting Market Growth

 3.4 Industry Supply Chain Analysis

  3.4.1 Raw Material Suppliers

  3.4.2 Manufacturers

  3.4.3 Distributors/Suppliers

  3.4.4 Customers/End-Users

 3.5 Industry Life Cycle Assessment

 3.6 Parent Market Overview

 3.7 Market Risk Assessment

4. Statistical Insights & Trends Reporting

4.1 Investment & Funding Trends

  4.1.1 Overview
  4.1.2 Annual Investments in SDP Startups and R&D, 2020–2024
  4.1.3 Notable Funding Rounds and Investors, 2021–2024
  4.1.4 M&A Activity Overview
  4.1.5 Number and Value of M&A Deals, 2020–2024
  4.1.6 Key Strategic Acquisitions by Major Players

4.2 Cost-Benefit Analysis Metrics

  4.2.1 Overview
  4.2.2 Average Return on Investment (ROI) from SDP Implementation, 2021–2024
  4.2.3 Cost Savings for Telecom Operators via Centralized Service Delivery, 2021–2024
  4.2.4 Case Studies of Cost Optimization through SDP

4.3 Vendor Benchmarking Statistics

  4.3.1 Overview
  4.3.2 Vendor Satisfaction Scores and Support Ratings, 2024
  4.3.3 Deployment Time Comparison by Key Vendors
  4.3.4 Time-to-Value (TTV) Analysis by Platform Type

4.4 Policy & Compliance Trends

  4.4.1 Overview
  4.4.2 Compliance Rate of SDP Platforms with Key Telecom Regulations (e.g., GDPR, HIPAA), 2024
  4.4.3 Impact of Telecom Regulatory Shifts on SDP Demand, 2020–2024
  4.4.4 Country-Wise Compliance and Regulatory Readiness

4.5 Technology Penetration

  4.5.1 Overview
  4.5.2 Integration Rate of SDPs with 5G, AI, NFV, and SDN Technologies, 2024
  4.5.3 Growth Rate of SDP-enabled IoT Services, 2020–2024
  4.5.4 Future Outlook of Technology-Converged SDP Architectures

4.6 Customer & Subscriber Metrics

  4.6.1 Overview
  4.6.2 Subscriber Base Supported by Major SDP Platforms, 2024
  4.6.3 Average Revenue per User (ARPU) Impact from SDP Deployment
  4.6.4 Case Examples: Operator-Specific ARPU Improvements

5. Service Delivery Platform Market Segmental Analysis & Forecast, By Organization Size, 2021 – 2032, Value (Usd Billion) & Volume (Number of Subscribers/Users)

5.1 Introduction

 5.2 Small and Medium Enterprises (SMEs)

  5.2.1 Key Trends

  5.2.2 Market Size & Forecast, 2021 – 2032

 5.3 Large Enterprises

  5.3.1 Key Trends

  5.3.2 Market Size & Forecast, 2021 – 2032

6. Service Delivery Platform Market Segmental Analysis & Forecast, By Application, 2021 – 2032, Value (Usd Billion) & Volume (Number of Subscribers/Users)

    6.1 Introduction

 6.2 Communication and Collaboration

  6.2.1 Key Trends

  6.2.2 Market Size & Forecast, 2021 – 2032

 6.3 Enterprise Mobility and BYOD (Bring Your Own Device)

  6.3.1 Key Trends

  6.3.2 Market Size & Forecast, 2021 – 2032

 6.4 Unified Communications

  6.4.1 Key Trends

  6.4.2 Market Size & Forecast, 2021 – 2032

 6.5 Content Delivery

  6.5.1 Key Trends

  6.5.2 Market Size & Forecast, 2021 – 2032

7. Service Delivery Platform Market Segmental Analysis & Forecast, By Telecom Service Sector, 2021 – 2032, Value (Usd Billion) & Volume (Number of Subscribers/Users)

    7.1 Introduction

 7.2 Mobile

  7.2.1 Key Trends

  7.2.2 Market Size & Forecast, 2021 – 2032

 7.3 PSTN (Public Switched Telephone Network)

  7.3.1 Key Trends

  7.3.2 Market Size & Forecast, 2021 – 2032

 7.4 Business Data Services

  7.4.1 Key Trends

  7.4.2 Market Size & Forecast, 2021 – 2032

 7.5 Residential Broadband

  7.5.1 Key Trends

  7.5.2 Market Size & Forecast, 2021 – 2032

8. Service Delivery Platform Market Segmental Analysis & Forecast, By End-User Industry, 2021 – 2032, Value (Usd Billion) & Volume (Number of Subscribers/Users)

    8.1 Introduction

 8.2 Healthcare

  8.2.1 Key Trends

  8.2.2 Market Size & Forecast, 2021 – 2032

 8.3 Banking, Financial Services, and Insurance (BFSI)

  8.3.1 Key Trends

  8.3.2 Market Size & Forecast, 2021 – 2032

 8.4 Retail

  8.4.1 Key Trends

  8.4.2 Market Size & Forecast, 2021 – 2032

 8.5 IT and Telecom

  8.5.1 Key Trends

  8.5.2 Market Size & Forecast, 2021 – 2032

 8.6 Government

  8.6.1 Key Trends

  8.6.2 Market Size & Forecast, 2021 – 2032

 8.7 Energy and Utilities

  8.7.1 Key Trends

  8.7.2 Market Size & Forecast, 2021 – 2032

 8.8 Manufacturing

  8.8.1 Key Trends

  8.8.2 Market Size & Forecast, 2021 – 2032

9. Service Delivery Platform Market Segmental Analysis & Forecast By Region, 2021 – 2025, Value (Usd Billion) & Volume (Number of Subscribers/Users)

9.1 Introduction

9.2 North America

 9.2.1 Key Trends

 9.2.2 Service Delivery Platform Market Size & Forecast, By Organization Size, 2021 – 2032

 9.2.3 Service Delivery Platform Market Size & Forecast, By Application, 2021 – 2032

 9.2.4 Service Delivery Platform Market Size & Forecast, By Telecom Service Sector, 2021 – 2032

 9.2.5 Service Delivery Platform Market Size & Forecast, By End-User Industry, 2021 – 2032

 9.2.6 Service Delivery Platform Market Size & Forecast, By Country, 2021 – 2032

  9.2.6.1 USA

   9.2.6.1.1 Service Delivery Platform Market Size & Forecast, By Organization Size, 2021 – 2032

   9.2.6.1.2 Service Delivery Platform Market Size & Forecast, By Application, 2021 – 2032

   9.2.6.1.3 Service Delivery Platform Market Size & Forecast, By Telecom Service Sector, 2021 – 2032

   9.2.6.1.4 Service Delivery Platform Market Size & Forecast, By End-User Industry, 2021 – 2032

  9.2.6.2 Canada

   9.2.6.2.1 Service Delivery Platform Market Size & Forecast, By Organization Size, 2021 – 2032

   9.2.6.2.2 Service Delivery Platform Market Size & Forecast, By Application, 2021 – 2032

   9.2.6.2.3 Service Delivery Platform Market Size & Forecast, By Telecom Service Sector, 2021 – 2032

   9.2.6.2.4 Service Delivery Platform Market Size & Forecast, By End-User Industry, 2021 – 2032

9.3 Europe

 9.3.1 Key Trends

 9.3.2 Service Delivery Platform Market Size & Forecast, By Organization Size, 2021 – 2032

 9.3.3 Service Delivery Platform Market Size & Forecast, By Application, 2021 – 2032

 9.3.4 Service Delivery Platform Market Size & Forecast, By Telecom Service Sector, 2021 – 2032

 9.3.5 Service Delivery Platform Market Size & Forecast, By End-User Industry, 2021 – 2032

 9.3.6 Service Delivery Platform Market Size & Forecast, By Country, 2021 – 2032

  9.3.6.1 Germany

   9.3.6.1.1 Service Delivery Platform Market Size & Forecast, By Organization Size, 2021 – 2032

   9.3.6.1.2 Service Delivery Platform Market Size & Forecast, By Application, 2021 – 2032

   9.3.6.1.3 Service Delivery Platform Market Size & Forecast, By Telecom Service Sector, 2021 – 2032

   9.3.6.1.4 Service Delivery Platform Market Size & Forecast, By End-User Industry, 2021 – 2032

  9.3.6.2 UK

   9.3.6.2.1 Service Delivery Platform Market Size & Forecast, By Organization Size, 2021 – 2032

   9.3.6.2.2 Service Delivery Platform Market Size & Forecast, By Application, 2021 – 2032

   9.3.6.2.3 Service Delivery Platform Market Size & Forecast, By Telecom Service Sector, 2021 – 2032

   9.3.6.2.4 Service Delivery Platform Market Size & Forecast, By End-User Industry, 2021 – 2032

  9.3.6.3 France

   9.3.6.3.1 Service Delivery Platform Market Size & Forecast, By Organization Size, 2021 – 2032

   9.3.6.3.2 Service Delivery Platform Market Size & Forecast, By Application, 2021 – 2032

   9.3.6.3.3 Service Delivery Platform Market Size & Forecast, By Telecom Service Sector, 2021 – 2032

   9.3.6.3.4 Service Delivery Platform Market Size & Forecast, By End-User Industry, 2021 – 2032

  9.3.6.4 Italy

   9.3.6.4.1 Service Delivery Platform Market Size & Forecast, By Organization Size, 2021 – 2032

   9.3.6.4.2 Service Delivery Platform Market Size & Forecast, By Application, 2021 – 2032

   9.3.6.4.3 Service Delivery Platform Market Size & Forecast, By Telecom Service Sector, 2021 – 2032

   9.3.6.4.4 Service Delivery Platform Market Size & Forecast, By End-User Industry, 2021 – 2032

  9.3.6.5 Spain

   9.3.6.5.1 Service Delivery Platform Market Size & Forecast, By Organization Size, 2021 – 2032

   9.3.6.5.2 Service Delivery Platform Market Size & Forecast, By Application, 2021 – 2032

   9.3.6.5.3 Service Delivery Platform Market Size & Forecast, By Telecom Service Sector, 2021 – 2032

   9.3.6.5.4 Service Delivery Platform Market Size & Forecast, By End-User Industry, 2021 – 2032

  9.3.6.6 Russia

   9.3.6.6.1 Service Delivery Platform Market Size & Forecast, By Organization Size, 2021 – 2032

   9.3.6.6.2 Service Delivery Platform Market Size & Forecast, By Application, 2021 – 2032

   9.3.6.6.3 Service Delivery Platform Market Size & Forecast, By Telecom Service Sector, 2021 – 2032

   9.3.6.6.4 Service Delivery Platform Market Size & Forecast, By End-User Industry, 2021 – 2032

  9.3.6.7 Poland

   9.3.6.7.1 Service Delivery Platform Market Size & Forecast, By Organization Size, 2021 – 2032

   9.3.6.7.2 Service Delivery Platform Market Size & Forecast, By Application, 2021 – 2032

   9.3.6.7.3 Service Delivery Platform Market Size & Forecast, By Telecom Service Sector, 2021 – 2032

   9.3.6.7.4 Service Delivery Platform Market Size & Forecast, By End-User Industry, 2021 – 2032

  9.3.6.8 Rest of Europe

   9.3.6.8.1 Service Delivery Platform Market Size & Forecast, By Organization Size, 2021 – 2032

   9.3.6.8.2 Service Delivery Platform Market Size & Forecast, By Application, 2021 – 2032

   9.3.6.8.3 Service Delivery Platform Market Size & Forecast, By Telecom Service Sector, 2021 – 2032

   9.3.6.8.4 Service Delivery Platform Market Size & Forecast, By End-User Industry, 2021 – 2032   

9.4 Asia-Pacific

 9.4.1 Key Trends

 9.4.2 Service Delivery Platform Market Size & Forecast, By Organization Size, 2021 – 2032

 9.4.3 Service Delivery Platform Market Size & Forecast, By Application, 2021 – 2032

 9.4.4 Service Delivery Platform Market Size & Forecast, By Telecom Service Sector, 2021 – 2032

 9.4.5 Service Delivery Platform Market Size & Forecast, By End-User Industry, 2021 – 2032

 9.4.6 Service Delivery Platform Market Size & Forecast, By Country, 2021 – 2032

  9.4.6.1 China

   9.4.6.1.1 Service Delivery Platform Market Size & Forecast, By Organization Size, 2021 – 2032

   9.4.6.1.2 Service Delivery Platform Market Size & Forecast, By Application, 2021 – 2032

   9.4.6.1.3 Service Delivery Platform Market Size & Forecast, By Telecom Service Sector, 2021 – 2032

   9.4.6.1.4 Service Delivery Platform Market Size & Forecast, By End-User Industry, 2021 – 2032

  9.4.6.2 India

   9.4.6.2.1 Service Delivery Platform Market Size & Forecast, By Organization Size, 2021 – 2032

   9.4.6.2.2 Service Delivery Platform Market Size & Forecast, By Application, 2021 – 2032

   9.4.6.2.3 Service Delivery Platform Market Size & Forecast, By Telecom Service Sector, 2021 – 2032

   9.4.6.2.4 Service Delivery Platform Market Size & Forecast, By End-User Industry, 2021 – 2032

  9.4.6.3 Japan

   9.4.6.3.1 Service Delivery Platform Market Size & Forecast, By Organization Size, 2021 – 2032

   9.4.6.3.2 Service Delivery Platform Market Size & Forecast, By Application, 2021 – 2032

   9.4.6.3.3 Service Delivery Platform Market Size & Forecast, By Telecom Service Sector, 2021 – 2032

   9.4.6.3.4 Service Delivery Platform Market Size & Forecast, By End-User Industry, 2021 – 2032

  9.4.6.4 South Korea

   9.4.6.4.1 Service Delivery Platform Market Size & Forecast, By Organization Size, 2021 – 2032

   9.4.6.4.2 Service Delivery Platform Market Size & Forecast, By Application, 2021 – 2032

   9.4.6.4.3 Service Delivery Platform Market Size & Forecast, By Telecom Service Sector, 2021 – 2032

   9.4.6.4.4 Service Delivery Platform Market Size & Forecast, By End-User Industry, 2021 – 2032

  9.4.6.5 Australia

   9.4.6.5.1 Service Delivery Platform Market Size & Forecast, By Organization Size, 2021 – 2032

   9.4.6.5.2 Service Delivery Platform Market Size & Forecast, By Application, 2021 – 2032

   9.4.6.5.3 Service Delivery Platform Market Size & Forecast, By Telecom Service Sector, 2021 – 2032

   9.4.6.5.4 Service Delivery Platform Market Size & Forecast, By End-User Industry, 2021 – 2032

  9.4.6.6 ASEAN Countries

   9.4.6.6.1 Service Delivery Platform Market Size & Forecast, By Organization Size, 2021 – 2032

   9.4.6.6.2 Service Delivery Platform Market Size & Forecast, By Application, 2021 – 2032

   9.4.6.6.3 Service Delivery Platform Market Size & Forecast, By Telecom Service Sector, 2021 – 2032

   9.4.6.6.4 Service Delivery Platform Market Size & Forecast, By End-User Industry, 2021 – 2032

  9.4.6.7 Rest of Asia-Pacific

   9.4.6.7.1 Service Delivery Platform Market Size & Forecast, By Organization Size, 2021 – 2032

   9.4.6.7.2 Service Delivery Platform Market Size & Forecast, By Application, 2021 – 2032

   9.4.6.7.3 Service Delivery Platform Market Size & Forecast, By Telecom Service Sector, 2021 – 2032

   9.4.6.7.4 Service Delivery Platform Market Size & Forecast, By End-User Industry, 2021 – 2032

9.5 Latin America

 9.5.1 Key Trends

 9.5.2 Service Delivery Platform Market Size & Forecast, By Organization Size, 2021 – 2032

 9.5.3 Service Delivery Platform Market Size & Forecast, By Application, 2021 – 2032

 9.5.4 Service Delivery Platform Market Size & Forecast, By Telecom Service Sector, 2021 – 2032

 9.5.5 Service Delivery Platform Market Size & Forecast, By End-User Industry, 2021 – 2032

 9.5.6 Service Delivery Platform Market Size & Forecast, By Country, 2021 – 2032

  9.5.6.1 Brazil

   9.5.6.1.1 Service Delivery Platform Market Size & Forecast, By Organization Size, 2021 – 2032

   9.5.6.1.2 Service Delivery Platform Market Size & Forecast, By Application, 2021 – 2032

   9.5.6.1.3 Service Delivery Platform Market Size & Forecast, By Telecom Service Sector, 2021 – 2032

   9.5.6.1.4 Service Delivery Platform Market Size & Forecast, By End-User Industry, 2021 – 2032

  9.5.6.2 Argentina

   9.5.6.2.1 Service Delivery Platform Market Size & Forecast, By Organization Size, 2021 – 2032

   9.5.6.2.2 Service Delivery Platform Market Size & Forecast, By Application, 2021 – 2032

   9.5.6.2.3 Service Delivery Platform Market Size & Forecast, By Telecom Service Sector, 2021 – 2032

   9.5.6.2.4 Service Delivery Platform Market Size & Forecast, By End-User Industry, 2021 – 2032

  9.5.6.3 Mexico

   9.5.6.3.1 Service Delivery Platform Market Size & Forecast, By Organization Size, 2021 – 2032

   9.5.6.3.2 Service Delivery Platform Market Size & Forecast, By Application, 2021 – 2032

   9.5.6.3.3 Service Delivery Platform Market Size & Forecast, By Telecom Service Sector, 2021 – 2032

   9.5.6.3.4 Service Delivery Platform Market Size & Forecast, By End-User Industry, 2021 – 2032

  9.5.6.4 Colombia

   9.5.6.4.1 Service Delivery Platform Market Size & Forecast, By Organization Size, 2021 – 2032

   9.5.6.4.2 Service Delivery Platform Market Size & Forecast, By Application, 2021 – 2032

   9.5.6.4.3 Service Delivery Platform Market Size & Forecast, By Telecom Service Sector, 2021 – 2032

   9.5.6.4.4 Service Delivery Platform Market Size & Forecast, By End-User Industry, 2021 – 2032

  9.5.6.5 Rest of Latin America

   9.5.6.5.1 Service Delivery Platform Market Size & Forecast, By Organization Size, 2021 – 2032

   9.5.6.5.2 Service Delivery Platform Market Size & Forecast, By Application, 2021 – 2032

   9.5.6.5.3 Service Delivery Platform Market Size & Forecast, By Telecom Service Sector, 2021 – 2032

   9.5.6.5.4 Service Delivery Platform Market Size & Forecast, By End-User Industry, 2021 – 2032

9.6 Middle East & Africa

 9.6.1 Key Trends

 9.6.2 Service Delivery Platform Market Size & Forecast, By Organization Size, 2021 – 2032

 9.6.3 Service Delivery Platform Market Size & Forecast, By Application, 2021 – 2032

 9.6.4 Service Delivery Platform Market Size & Forecast, By Telecom Service Sector, 2021 – 2032

 9.6.5 Service Delivery Platform Market Size & Forecast, By End-User Industry, 2021 – 2032

 9.6.6 Service Delivery Platform Market Size & Forecast, By Country, 2021 – 2032

  9.6.6.1 UAE

   9.6.6.1.1 Service Delivery Platform Market Size & Forecast, By Organization Size, 2021 – 2032

   9.6.6.1.2 Service Delivery Platform Market Size & Forecast, By Application, 2021 – 2032

   9.6.6.1.3 Service Delivery Platform Market Size & Forecast, By Telecom Service Sector, 2021 – 2032

   9.6.6.1.4 Service Delivery Platform Market Size & Forecast, By End-User Industry, 2021 – 2032

  9.6.6.2 Saudi Arabia

   9.6.6.2.1 Service Delivery Platform Market Size & Forecast, By Organization Size, 2021 – 2032

   9.6.6.2.2 Service Delivery Platform Market Size & Forecast, By Application, 2021 – 2032

   9.6.6.2.3 Service Delivery Platform Market Size & Forecast, By Telecom Service Sector, 2021 – 2032

   9.6.6.2.4 Service Delivery Platform Market Size & Forecast, By End-User Industry, 2021 – 2032

  9.6.6.3 Qatar

   9.6.6.3.1 Service Delivery Platform Market Size & Forecast, By Organization Size, 2021 – 2032

   9.6.6.3.2 Service Delivery Platform Market Size & Forecast, By Application, 2021 – 2032

   9.6.6.3.3 Service Delivery Platform Market Size & Forecast, By Telecom Service Sector, 2021 – 2032

   9.6.6.3.4 Service Delivery Platform Market Size & Forecast, By End-User Industry, 2021 – 2032

  9.6.6.4 Egypt

   9.6.6.4.1 Service Delivery Platform Market Size & Forecast, By Organization Size, 2021 – 2032

   9.6.6.4.2 Service Delivery Platform Market Size & Forecast, By Application, 2021 – 2032

   9.6.6.4.3 Service Delivery Platform Market Size & Forecast, By Telecom Service Sector, 2021 – 2032

   9.6.6.4.4 Service Delivery Platform Market Size & Forecast, By End-User Industry, 2021 – 2032

  9.6.6.5 South Africa

   9.6.6.5.1 Service Delivery Platform Market Size & Forecast, By Organization Size, 2021 – 2032

   9.6.6.5.2 Service Delivery Platform Market Size & Forecast, By Application, 2021 – 2032

   9.6.6.5.3 Service Delivery Platform Market Size & Forecast, By Telecom Service Sector, 2021 – 2032

   9.6.6.5.4 Service Delivery Platform Market Size & Forecast, By End-User Industry, 2021 – 2032

  9.6.6.6 Rest of Middle East & Africa

   9.6.6.6.1 Service Delivery Platform Market Size & Forecast, By Organization Size, 2021 – 2032

   9.6.6.6.2 Service Delivery Platform Market Size & Forecast, By Application, 2021 – 2032

   9.6.6.6.3 Service Delivery Platform Market Size & Forecast, By Telecom Service Sector, 2021 – 2032

   9.6.6.6.4 Service Delivery Platform Market Size & Forecast, By End-User Industry, 2021 – 2032

10. Competitive Landscape

 10.1 Key Players' Positioning

 10.2 Competitive Developments

  10.2.1 Key Strategies Adopted (%), By Key Players, 2024

  10.2.2 Year-Wise Strategies & Development, 2021 – 2025

  10.2.3 Number Of Strategies Adopted By Key Players, 2024

 10.3 Market Share Analysis, 2024

 10.4 Product/Service & Application Benchmarking

  10.4.1 Product/Service Specifications & Features By Key Players

  10.4.2 Product/Service Heatmap By Key Players

  10.4.3 Application Heatmap By Key Players

 10.5 Industry Start-Up & Innovation Landscape

 10.6 Key Company Profiles

10.6 Key Company Profiles

 10.6.1 HCL Technologies

  10.6.1.1 Company Overview & Snapshot

  10.6.1.2 Product/Service Portfolio

  10.6.1.3 Key Company Financials

  10.6.1.4 SWOT Analysis

 10.6.2 Fujitsu

  10.6.2.1 Company Overview & Snapshot

  10.6.2.2 Product/Service Portfolio

  10.6.2.3 Key Company Financials

  10.6.2.4 SWOT Analysis

 10.6.3 SGK International

  10.6.3.1 Company Overview & Snapshot

  10.6.3.2 Product/Service Portfolio

  10.6.3.3 Key Company Financials

  10.6.3.4 SWOT Analysis

 10.6.4 Cisco Systems

  10.6.4.1 Company Overview & Snapshot

  10.6.4.2 Product/Service Portfolio

  10.6.4.3 Key Company Financials

  10.6.4.4 SWOT Analysis

 10.6.5 Accenture

  10.6.5.1 Company Overview & Snapshot

  10.6.5.2 Product/Service Portfolio

  10.6.5.3 Key Company Financials

  10.6.5.4 SWOT Analysis

 10.6.6 Tech Mahindra

  10.6.6.1 Company Overview & Snapshot

  10.6.6.2 Product/Service Portfolio

  10.6.6.3 Key Company Financials

  10.6.6.4 SWOT Analysis

 10.6.7 BMC Software

  10.6.7.1 Company Overview & Snapshot

  10.6.7.2 Product/Service Portfolio

  10.6.7.3 Key Company Financials

  10.6.7.4 SWOT Analysis

 10.6.8 SAP

  10.6.8.1 Company Overview & Snapshot

  10.6.8.2 Product/Service Portfolio

  10.6.8.3 Key Company Financials

  10.6.8.4 SWOT Analysis

 10.6.9 Accelerite

  10.6.9.1 Company Overview & Snapshot

  10.6.9.2 Product/Service Portfolio

  10.6.9.3 Key Company Financials

  10.6.9.4 SWOT Analysis

 10.6.10 Amdocs

  10.6.10.1 Company Overview & Snapshot

  10.6.10.2 Product/Service Portfolio

  10.6.10.3 Key Company Financials

  10.6.10.4 SWOT Analysis

 10.6.11 CA Technologies

  10.6.11.1 Company Overview & Snapshot

  10.6.11.2 Product/Service Portfolio

  10.6.11.3 Key Company Financials

  10.6.11.4 SWOT Analysis

 10.6.12 Ericsson

  10.6.12.1 Company Overview & Snapshot

  10.6.12.2 Product/Service Portfolio

  10.6.12.3 Key Company Financials

  10.6.12.4 SWOT Analysis

 10.6.13 HP

  10.6.13.1 Company Overview & Snapshot

  10.6.13.2 Product/Service Portfolio

  10.6.13.3 Key Company Financials

  10.6.13.4 SWOT Analysis

 10.6.14 Huawei

  10.6.14.1 Company Overview & Snapshot

  10.6.14.2 Product/Service Portfolio

  10.6.14.3 Key Company Financials

  10.6.14.4 SWOT Analysis

 10.6.15 IBM

  10.6.15.1 Company Overview & Snapshot

  10.6.15.2 Product/Service Portfolio

  10.6.15.3 Key Company Financials

  10.6.15.4 SWOT Analysis

 10.6.16 Oracle

  10.6.16.1 Company Overview & Snapshot

  10.6.16.2 Product/Service Portfolio

  10.6.16.3 Key Company Financials

  10.6.16.4 SWOT Analysis

 10.6.17 Microsoft

  10.6.17.1 Company Overview & Snapshot

  10.6.17.2 Product/Service Portfolio

  10.6.17.3 Key Company Financials

  10.6.17.4 SWOT Analysis

 10.6.18 Nokia

  10.6.18.1 Company Overview & Snapshot

  10.6.18.2 Product/Service Portfolio

  10.6.18.3 Key Company Financials

  10.6.18.4 SWOT Analysis

 10.6.19 Telenity

  10.6.19.1 Company Overview & Snapshot

  10.6.19.2 Product/Service Portfolio

  10.6.19.3 Key Company Financials

  10.6.19.4 SWOT Analysis

 10.6.20 ZTE

  10.6.20.1 Company Overview & Snapshot

  10.6.20.2 Product/Service Portfolio

  10.6.20.3 Key Company Financials

  10.6.20.4 SWOT Analysis

11. Analyst Recommendations

 11.1 SNS Insider Opportunity Map

 11.2 Industry Low-Hanging Fruit Assessment

 11.3 Market Entry & Growth Strategy

 11.4 Analyst Viewpoint & Suggestions On Market Growth

12. Assumptions

13. Disclaimer

14. Appendix

 14.1 List Of Tables

 14.2 List Of Figures

An accurate research report requires proper strategizing as well as implementation. There are multiple factors involved in the completion of good and accurate research report and selecting the best methodology to compete the research is the toughest part. Since the research reports we provide play a crucial role in any company’s decision-making process, therefore we at SNS Insider always believe that we should choose the best method which gives us results closer to reality. This allows us to reach at a stage wherein we can provide our clients best and accurate investment to output ratio.

Each report that we prepare takes a timeframe of 350-400 business hours for production. Starting from the selection of titles through a couple of in-depth brain storming session to the final QC process before uploading our titles on our website we dedicate around 350 working hours. The titles are selected based on their current market cap and the foreseen CAGR and growth.


The 5 steps process:

Step 1: Secondary Research:

Secondary Research or Desk Research is as the name suggests is a research process wherein, we collect data through the readily available information. In this process we use various paid and unpaid databases which our team has access to and gather data through the same. This includes examining of listed companies’ annual reports, Journals, SEC filling etc. Apart from this our team has access to various associations across the globe across different industries. Lastly, we have exchange relationships with various university as well as individual libraries.

Secondary Research

Step 2: Primary Research

When we talk about primary research, it is a type of study in which the researchers collect relevant data samples directly, rather than relying on previously collected data.  This type of research is focused on gaining content specific facts that can be sued to solve specific problems. Since the collected data is fresh and first hand therefore it makes the study more accurate and genuine.

We at SNS Insider have divided Primary Research into 2 parts.

Part 1 wherein we interview the KOLs of major players as well as the upcoming ones across various geographic regions. This allows us to have their view over the market scenario and acts as an important tool to come closer to the accurate market numbers. As many as 45 paid and unpaid primary interviews are taken from both the demand and supply side of the industry to make sure we land at an accurate judgement and analysis of the market.

This step involves the triangulation of data wherein our team analyses the interview transcripts, online survey responses and observation of on filed participants. The below mentioned chart should give a better understanding of the part 1 of the primary interview.

Primary Research

Part 2: In this part of primary research the data collected via secondary research and the part 1 of the primary research is validated with the interviews from individual consultants and subject matter experts.

Consultants are those set of people who have at least 12 years of experience and expertise within the industry whereas Subject Matter Experts are those with at least 15 years of experience behind their back within the same space. The data with the help of two main processes i.e., FGDs (Focused Group Discussions) and IDs (Individual Discussions). This gives us a 3rd party nonbiased primary view of the market scenario making it a more dependable one while collation of the data pointers.

Step 3: Data Bank Validation

Once all the information is collected via primary and secondary sources, we run that information for data validation. At our intelligence centre our research heads track a lot of information related to the market which includes the quarterly reports, the daily stock prices, and other relevant information. Our data bank server gets updated every fortnight and that is how the information which we collected using our primary and secondary information is revalidated in real time.

Data Bank Validation

Step 4: QA/QC Process

After all the data collection and validation our team does a final level of quality check and quality assurance to get rid of any unwanted or undesired mistakes. This might include but not limited to getting rid of the any typos, duplication of numbers or missing of any important information. The people involved in this process include technical content writers, research heads and graphics people. Once this process is completed the title gets uploader on our platform for our clients to read it.

Step 5: Final QC/QA Process:

This is the last process and comes when the client has ordered the study. In this process a final QA/QC is done before the study is emailed to the client. Since we believe in giving our clients a good experience of our research studies, therefore, to make sure that we do not lack at our end in any way humanly possible we do a final round of quality check and then dispatch the study to the client.

Key Segments: 

By Organization Size

  • Small and Medium Enterprises (SMEs)

  • Large Enterprises

By Telecom Service Sector

  • Mobile

  • PSTN (Public Switched Telephone Network)

  • Business Data Services

  • Residential Broadband

By Application

  • Communication and Collaboration

  • Enterprise Mobility and BYOD (Bring Your Own Device)

  • Unified Communications

  • Content Delivery

By End-User Industry

  • Healthcare

  • Banking, Financial Services, and Insurance (BFSI)

  • Retail

  • IT and Telecom

  • Government

  • Energy and Utilities

  • Manufacturing

Request for Segment Customization as per your Business Requirement: Segment Customization Request

Regional Coverage: 

North America

  • US

  • Canada

Europe

  • Germany

  • France

  • UK

  • Italy

  • Spain

  • Poland

  • Russia

  • Rest of Europe

Asia Pacific

  • China

  • India

  • Japan

  • South Korea

  • Australia

  • ASEAN Countries

  • Rest of Asia Pacific

Middle East & Africa

  • UAE

  • Saudi Arabia

  • Qatar

  • South Africa

  • Rest of Middle East & Africa

Latin America

  • Brazil

  • Argentina

  • Mexico

  • Colombia

  • Rest of Latin America

Request for Country Level Research Report: Country Level Customization Request

Available Customization 

With the given market data, SNS Insider offers customization as per the company’s specific needs. The following customization options are available for the report: 

  • Detailed Volume Analysis 

  • Criss-Cross segment analysis (e.g. Product X Application) 

  • Competitive Product Benchmarking 

  • Geographic Analysis 

  • Additional countries in any of the regions 

  • Customized Data Representation 

  • Detailed analysis and profiling of additional market players

Explore Key Insights.


  • Analyzes market trends, forecasts, and regional dynamics
  • Covers core offerings, innovations, and industry use cases
  • Profiles major players, value chains, and strategic developments
  • Highlights innovation trends, regulatory impacts, and growth opportunities
Request an Analyst Call