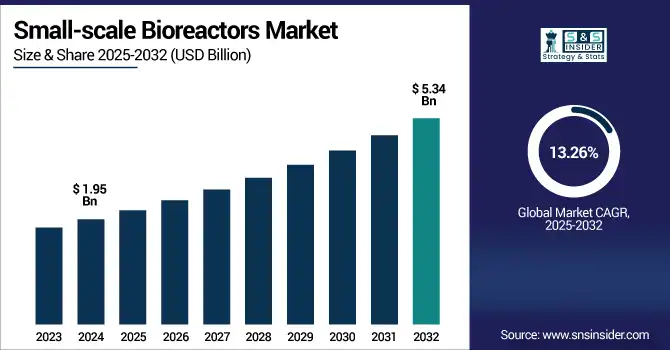
The small-scale bioreactors market size was valued at USD 1.95 billion in 2024 and is expected to reach USD 5.34 billion by 2032, growing at a CAGR of 13.26% over the forecast period of 2025-2032.
The global small-scale bioreactors market is anticipating a continuous growth with an increase in the demand for adjustable and scalable bioprocessing solutions for drug development, cell and gene therapy, and academic research. The growth of the market is attributed to factors such as growing acceptance for single-use systems, rising bioprocess automation, and an increasing number of biologics and biosimilars pipeline across the globe. An increase in R&D spending by pharmaceutical and biotech companies, paired with the emergence of contract research organizations (CROs) and contract manufacturing organizations (CMOs), has led to a demand for small bioreactors to expedite early-stage and pilot-scale bioproduction.
The U.S. small-scale bioreactors market size was valued at USD 0.64 billion in 2024 and is expected to reach USD 1.74 billion by 2032, growing at a CAGR of 13.17% over the forecast period of 2025-2032.
The U.S. leads the small-scale bioreactors market in North America, owing to the developed biotechnology industry and large number of leading pharmaceutical and bioprocessing companies located in this country, along with considerable investments for researchers. In addition, a high density of cell culture and biologics development, prominent academic and research institutes will positively impact the small-scale bioreactor market in the country.
Drivers
Expansion of the Market Owing to Rising Demand for Biologics and Biosimilars
One of the most important factors promoting the small-scale bioreactors market growth is the increasing global demand for biologics, such as monoclonal antibodies, vaccines, and recombinant proteins. The demand for accurate and regulated development processes for these intricate biological medications begins early on, first at small scales throughout R&D and preclinical stages. Bioreactor small-scale equipment permits preliminary experimentation to be carried out to evaluate diverse cell lines, various culture conditions, and process variables. Moreover, with the increasing adoption of biosimilars as an affordable replacement for branded biologics, the demand for robust and scalable development platforms is amplified, thus driving the growth of small-scale bioreactors in the biopharmaceutical pipeline.
Growing Number of CROs and CMOs Drives the Market Growth
Pharma and biotech companies are relying more on outsourcing study, development, and manufacturing tasks with the aid of contract research organizations (CROs) and contract manufacturing organizations (CMOs) to cut back run costs and speed up market access. Small-scale bioreactors are well used by the CROs, CMOs, and early-phase drug development, process optimization, and some pilot-scale studies before large-scale commercial production. Such organizations need adaptive, economical systems that can be customized as per various projects and clients quickly. With increasing global outsourcing, there is an ever-growing requirement for these small-scale bioreactor systems in these facilities.
According to McKinsey & Company, patient-centric trial models and advanced AI technologies are influencing CROs to develop new service offerings in the area of early-stage bioprocessing.
Restraint
Limited Commercial Manufacturing Scalability is Restraining the Market from Growing
Scalability is one of the prominent restraining factors for the small-scale bioreactors market trends. Small-scale bioreactors are commonly utilized for initial R&D (research and development), process development, and proof-of-concept studies, but are frequently not amenable to direct scale-up for commercial manufacturing due to different configurations, mixing dynamics, oxygen transfer rates, and shear conditions. Consequently, bioprocesses that have been optimised in small-scale (1–5 liters) volumes can differ when transferred to the larger-scale bioreactor used in manufacturing.
For instance, the misalignment causes more time and resources for process revalidation and optimization in scale-up, prolonging commercialisation timelines and increasing production costs. Also, discrepancies between small and large systems can impact product yield or quality, making technology transfer even more complex. Therefore, the small-scale systems cannot be scaled up easily, so it is a big challenge for firms to run R&D to mass production smoothly.
By Product
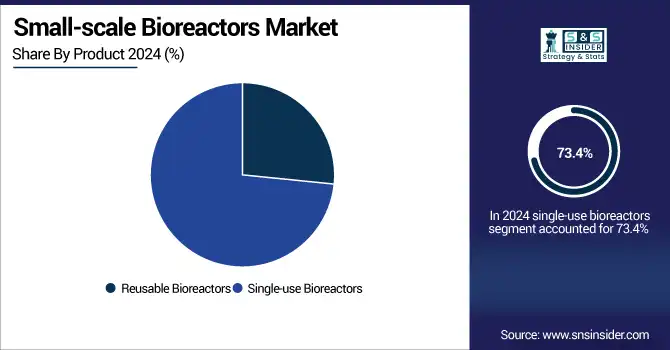
The single-use bioreactors segment dominated the small-scale bioreactors market share with a 73.4% in 2024, as it is one of the widely used types of bioreactors for research and process development for biologics, cell therapy, and gene therapy. Such systems can provide numerous advantages, such as lower cross-contamination risk, lower cleaning and validation costs, and quicker changeovers between batches. Plug-and-play design is perfect for academic institutions, biotech startups, and contract research organizations looking for speed and flexibility.
The reusable bioreactors segment is expected to experience significant growth in the forecast period due to their strength, scalability, and long-term cost management for consistent, repetitive research settings. A growing number of pharmaceutical and biopharmaceutical companies have begun the transition to scale-up production, or continuous- or high-throughput experiments, creating an increased need for reusable systems. They prove to be specifically useful in the setting in which process standardization and repeatability are required. Other technological advances, such as integrated automation or real-time monitoring, are making reusable systems even more attractive for biomanufacturing applications as they evolve.
By Capacity
The segment of 1L–3L dominated the small-scale bioreactors market share and accounted for 31.2% due to its favorable combination of volume and performance with regard to cost, which makes it suitable for early-stage research, process development, and optimization. This volume range is popular with academic research institutes, biotech, and pharmaceutical R&D labs due to it provides a significant enough volume to give a meaningful experimental output, but is still inexpensive and convenient to handle. The high level of adoption of 96-well plates across a variety of end users can be attributed to their compatibility with microbial and mammalian cell cultures and to the fact that these plates are often used in parallel bioreactor configurations.
The 3L–5L segment is projected to grow significantly during the forecast period as it serves the demand for a mid-sized system positioned between bench-scale and pilot-scale production phases. This capacity range caters to scale-up studies, high-end biologics research, and small-batch clinical manufacturing. As more organizations move toward biosimilars, cell and gene therapies, or personalized medicine, many are looking for bioreactors that can handle less simple, higher volume workflows. Scaling up to the 3L–5L range is gaining popularity across the board, from CMOs and CROs to mid-sized biopharma companies targeting efficiency, throughput, and scalability.
By End Use
The CROs & CMOs segment led the small-scale bioreactors market in 2024 with 68.04% market share, owing to the trend of increasing outsourcing of bioprocessing and drug development activities by pharmaceutical and biotech companies. Small-scale bioreactor systems within CROs and CMOs are seeing significant investments to support early-phase development, process optimization, and pilot-scale production. These facilities provide a low-cost, scalable bioprocessing solution and remain an attractive partner for new and seasoned drug developers alike. This capability of managing diverse client projects using flexible bioreactor systems has largely fueled demand in this end-use segment.
The academic & research institutes segment is anticipated to grow at the fastest CAGR as a result of increasing funding in the biotechnology research initiatives and increasing interest in biopharmaceutical innovation. There has been a marked increase in the use of small-scale bioreactors for cell biology, microbial fermentation, and process development method studies at both universities and public research institutions. Increased academic interest in early-stage R&D was encouraged by the growing emphasis on biosimilars, regenerative medicine, and personalized therapies. Furthermore, the presence of funding for research and collaborative academia and industry projects is also fostering bioreactor adoption in this segment.
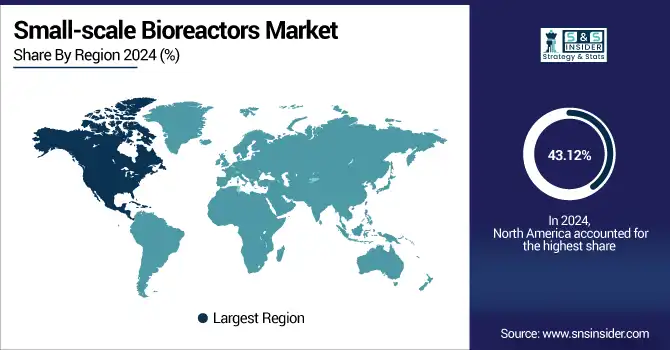
The small-scale bioreactors market dominated in North America with 43.12% market share in 2024, is driven by a strong presence of established biotechnology and pharmaceutical sectors that are significant end-users of advanced bioprocessing technologies. It has the major market players, research institutions, key academic institutions involved in this field, and a significant number of contract research and manufacturing organizations (CROs and CMOs). Moreover, significant government and private sector spending towards R&D, especially in biologics, biosimilars, and cell and gene therapies, has markedly increased demand for small-scale bioreactors for early-stage development and process development.
The small-scale bioreactors market analysis in Asia Pacific is estimated to grow at the fastest rate with a 13.96% CAGR over the forecast period, owing to the high biopharmaceutical manufacturing activity in the region, increasing government support for biopharmaceutical innovation, and the development of R&D infrastructures in developing countries such as China, India, South Korea, and Japan. Furthermore, the emergence of single-use disposable technologies, in addition to expanding local CROs/CMOs, is contributing to the expansion of market growth in the case of these biotechnology clusters. In addition, the growing demand for economical, across a wide scale of bioprocessing solutions for the bioproduction in academia and industry, is further stimulating the adoption of small-scale bioreactors across the region.
Europe exhibits significant growth over the forecast period due to the increasing adoption of advanced, flexible bioprocessing technologies, and expanding biopharmaceutical R&D activities are driving the growth of the small-scale bioreactors market. A robust presence of global market players, together with mature research infrastructure and increasing public and private sector support for biotechnology innovation, is stimulating growth in the region.
Moreover, growing adoption of single-use bioreactors, especially in the developmental phase and academic research, is expected to drive the market growth. Europe is gradually becoming a core regional growth segment of the global and small-scale bioreactors landscape owing to increasing investments in biomanufacturing capabilities amid the growth momentum in biosimilars and personalized medicine.
The steady growth of the Latin American small-scale bioreactors market is attributed to the rising implementation of bioprocessing technologies in the pharmaceutical, biotechnology, and food and beverage sectors. The country is directing funds toward research infrastructure and supporting the adoption of small bioreactor systems across university laboratories and new bioentreprises. An upsurge in indigenous CMOs and collaborations with global players is further helping the market grow throughout the region.
Gradual growth is found in the MEA region as well, with increasing life science investments steadily in countries such as the UAE and Saudi Arabia. With these countries improving their healthcare and biotech capacity, the bioreactors used for early-stage research and pilot-scale production are only going to rise. Although market penetration is still low when compared to the rest of the globe, the aspirational push for economic diversification & innovation in biomanufacturing is showing a modestly optimistic market trajectory for the region.
Small-scale bioreactor companies, Sartorius AG, Thermo Fisher Scientific Inc., Merck KGaA, GE Healthcare, Danaher Corporation, Eppendorf AG, Lonza Group AG, Miltenyi Biotec B.V. & Co. KG, Solaris Biotechnology Srl, Infors AG, and other players.
April 2025 – Thermo Fisher Scientific Inc., the global leader in science and laboratory solutions, is pleased to introduce its 5L DynaDrive Single-Use Bioreactor (S.U.B.) that meets the changing needs of contemporary bioprocessing. The new 5L model expands Thermo Fisher's full range of bioreactors to provide scalability from 1 to 5,000 liters to facilitate bench-scale process development.
Report Attributes | Details |
---|---|
Market Size in 2024 | USD 1.95 Billion |
Market Size by 2032 | USD 5.34 Billion |
CAGR | CAGR of 13.26% From 2025 to 2032 |
Base Year | 2024 |
Forecast Period | 2025-2032 |
Historical Data | 2021-2023 |
Report Scope & Coverage | Market Size, Segments Analysis, Competitive Landscape, Regional Analysis, DROC & SWOT Analysis, Forecast Outlook |
Key Segments | • By Product (Reusable Bioreactors, Single-use Bioreactors) • By Capacity (5 mL–100 mL, 100 mL–250 mL, 250 mL–500 mL, 500 mL–1 L, 1 L–3 L, 3 L–5 L) • By End Use (Pharmaceutical & Biopharmaceutical Companies, CROs & CMOs, Academic & Research Institutes) |
Regional Analysis/Coverage | North America (US, Canada, Mexico), Europe (Germany, France, UK, Italy, Spain, Poland, Turkey, Rest of Europe), Asia Pacific (China, India, Japan, South Korea, Singapore, Australia, Rest of Asia Pacific), Middle East & Africa (UAE, Saudi Arabia, Qatar, South Africa, Rest of Middle East & Africa), Latin America (Brazil, Argentina, Rest of Latin America) |
Company Profiles | Sartorius AG, Thermo Fisher Scientific Inc., Merck KGaA, GE Healthcare, Danaher Corporation, Eppendorf AG, Lonza Group AG, Miltenyi Biotec B.V. & Co. KG, Solaris Biotechnology Srl, Infors AG, and other players. |
Ans: The Small-scale Bioreactors Market is expected to grow at a CAGR of 13.26% from 2025 to 2032.
Ans: The Small-scale Bioreactors Market was USD 1.95 billion in 2024 and is expected to reach USD 5.34 billion by 2032.
Ans: Expansion of the market owing to rising demand for biologics and biosimilars.
Ans: Sartorius AG, Thermo Fisher Scientific Inc., Merck KGaA, GE Healthcare, Danaher Corporation, Eppendorf AG, Lonza Group AG, Miltenyi Biotec B.V. & Co. KG, Solaris Biotechnology Srl, Infors AG, and other players.
Ans: North America dominated the Small-scale Bioreactors Market in 2024.
Table of Contents
1. Introduction
1.1 Market Definition
1.2 Scope (Inclusion and Exclusions)
1.3 Research Assumptions
2. Executive Summary
2.1 Market Overview
2.2 Regional Synopsis
2.3 Competitive Summary
3. Research Methodology
3.1 Top-Down Approach
3.2 Bottom-up Approach
3.3. Data Validation
3.4 Primary Interviews
4. Market Dynamics Impact Analysis
4.1 Market Driving Factors Analysis
4.1.1 Drivers
4.1.2 Restraints
4.1.3 Opportunities
4.1.4 Challenges
4.2 PESTLE Analysis
4.3 Porter’s Five Forces Model
5. Statistical Insights and Trends Reporting
5.1 Adoption Rate by Application Type (2024)
5.2 Procurement Trends by Region (2024)
5.3 Procurement Trends by Region (2024)
5.4 Manufacturing Outsourcing Trends (2024–2032)
6. Competitive Landscape
6.1 List of Major Companies, By Region
6.2 Market Share Analysis, By Region
6.3 Product Benchmarking
6.3.1 Product specifications and features
6.3.2 Pricing
6.4 Strategic Initiatives
6.4.1 Marketing and promotional activities
6.4.2 Distribution and Supply Chain Strategies
6.4.3 Expansion plans and new Product launches
6.4.4 Strategic partnerships and collaborations
6.5 Technological Advancements
6.6 Market Positioning and Branding
7. Small-Scale Bioreactors Market Segmentation By Product
7.1 Chapter Overview
7.2 Reusable Bioreactors
7.2.1 Reusable Bioreactors Market Trends Analysis (2021-2032)
7.2.2 Reusable Bioreactors Market Size Estimates and Forecasts to 2032 (USD Billion)
7.3 Single-use Bioreactors
7.3.1 Single-use Bioreactors Market Trends Analysis (2021-2032)
7.3.2 Single-use Bioreactors Market Size Estimates and Forecasts to 2032 (USD Billion)
8. Small-Scale Bioreactors Market Segmentation By Capacity
8.1 Chapter Overview
8.2 5 ML- -100 ML
8.2.1 5 ML- -100 ML Market Trend Analysis (2021-2032)
8.2.2 5 ML- -100 ML Market Size Estimates and Forecasts to 2032 (USD Billion)
8.3 100 ML-250 ML
8.3.1 100 ML-250 ML Market Trends Analysis (2021-2032)
8.3.2 100 ML-250 ML Market Size Estimates and Forecasts to 2032 (USD Billion)
8.4 250 ML -500 ML
8.4.1 250 ML -500 ML Market Trends Analysis (2021-2032)
8.4.2 250 ML -500 ML Market Size Estimates and Forecasts to 2032 (USD Billion)
8.5 500 ML-1 L
8.5.1 500 ML-1 L Market Trends Analysis (2021-2032)
8.5.2 500 ML-1 L Market Size Estimates and Forecasts to 2032 (USD Billion)
8.6 1L-3L
8.6.1 1L-3L Market Trends Analysis (2021-2032)
8.6.2 1L-3L Market Size Estimates and Forecasts to 2032 (USD Billion)
8.7 3L-5L
8.7.1 3L-5L Market Trends Analysis (2021-2032)
8.7.2 3L-5L Market Size Estimates and Forecasts to 2032 (USD Billion)
9. Small-Scale Bioreactors Market Segmentation By End User
9.1 Chapter Overview
9.2 Pharmaceutical & Biopharmaceutical Companies
9.2.1 Pharmaceutical & Biopharmaceutical Companies Market Trends Analysis (2021-2032)
9.2.2 Pharmaceutical & Biopharmaceutical Companies Market Size Estimates and Forecasts to 2032 (USD Billion)
9.3 CROs & CMOs
9.3.1 CROs & CMOs Market Trends Analysis (2021-2032)
9.3.2 CROs & CMOs Market Size Estimates and Forecasts to 2032 (USD Billion)
9.4 Academic & Research Institutes
9.4.1 Academic & Research Institutes Market Trends Analysis (2021-2032)
9.4.2 Academic & Research Institutes Market Size Estimates and Forecasts to 2032 (USD Billion)
10. Regional Analysis
10.1 Chapter Overview
10.2 North America
10.2.1 Trends Analysis
10.2.2 North America Small-scale Bioreactors Market Estimates and Forecasts, by Country (2021-2032) (USD Billion)
10.2.3 North America Small-scale Bioreactors Market Estimates and Forecasts, By Product (2021-2032) (USD Billion)
10.2.4 North America Small-scale Bioreactors Market Estimates and Forecasts, By Capacity (2021-2032) (USD Billion)
10.2.5 North America Small-scale Bioreactors Market Estimates and Forecasts, By End User (2021-2032) (USD Billion)
10.2.6 USA
10.2.6.1 USA Small-scale Bioreactors Market Estimates and Forecasts, By Product (2021-2032) (USD Billion)
10.2.6.2 USA Small-scale Bioreactors Market Estimates and Forecasts, By Capacity (2021-2032) (USD Billion)
10.2.6.3 USA Small-scale Bioreactors Market Estimates and Forecasts, By End User (2021-2032) (USD Billion)
10.2.7 Canada
10.2.7.1 Canada Small-scale Bioreactors Market Estimates and Forecasts, By Product (2021-2032) (USD Billion)
10.2.7.2 Canada Small-scale Bioreactors Market Estimates and Forecasts, By Capacity (2021-2032) (USD Billion)
10.2.7.3 Canada Small-scale Bioreactors Market Estimates and Forecasts, By End User (2021-2032) (USD Billion)
10.2.8 Mexico
10.2.8.1 Mexico Small-scale Bioreactors Market Estimates and Forecasts, By Product (2021-2032) (USD Billion)
10.2.8.2 Mexico Small-scale Bioreactors Market Estimates and Forecasts, By Capacity (2021-2032) (USD Billion)
10.2.8.3 Mexico Small-scale Bioreactors Market Estimates and Forecasts, By End User (2021-2032) (USD Billion)
10.3 Europe
10.3.1 Trends Analysis
10.3.2 Europe Small-scale Bioreactors Market Estimates and Forecasts, by Country (2021-2032) (USD Billion)
10.3.3 Europe Small-scale Bioreactors Market Estimates and Forecasts, By Product (2021-2032) (USD Billion)
10.3.4 Europe Small-scale Bioreactors Market Estimates and Forecasts, By Capacity (2021-2032) (USD Billion)
10.3.5 Europe Small-scale Bioreactors Market Estimates and Forecasts, By End User(2021-2032) (USD Billion)
10.3.6 Germany
10.3.1.6.1 Germany Small-scale Bioreactors Market Estimates and Forecasts, By Product (2021-2032) (USD Billion)
10.3.1.6.2 Germany Small-scale Bioreactors Market Estimates and Forecasts, By Capacity (2021-2032) (USD Billion)
10.3.1.6.3 Germany Small-scale Bioreactors Market Estimates and Forecasts, By End User (2021-2032) (USD Billion)
10.3.7 France
10.3.7.1 France Small-scale Bioreactors Market Estimates and Forecasts, By Product (2021-2032) (USD Billion)
10.3.7.2 France a Small-scale Bioreactors Market Estimates and Forecasts, By Capacity (2021-2032) (USD Billion)
10.3.7.3 France Small-scale Bioreactors Market Estimates and Forecasts, By End User (2021-2032) (USD Billion)
10.3.8 UK
10.3.8.1 UK Small-scale Bioreactors Market Estimates and Forecasts, By Product (2021-2032) (USD Billion)
10.3.8.2 UK Small-scale Bioreactors Market Estimates and Forecasts, By Capacity (2021-2032) (USD Billion)
10.3.8.3 UK Small-scale Bioreactors Market Estimates and Forecasts, By End User (2021-2032) (USD Billion)
10.3.9 Italy
10.3.9.1 Italy Small-scale Bioreactors Market Estimates and Forecasts, By Product (2021-2032) (USD Billion)
10.3.9.2 Italy Small-scale Bioreactors Market Estimates and Forecasts, By Capacity (2021-2032) (USD Billion)
10.3.9.3 Italy Small-scale Bioreactors Market Estimates and Forecasts, By End User (2021-2032) (USD Billion)
10.3.10 Spain
10.3.10.1 Spain Small-scale Bioreactors Market Estimates and Forecasts, By Product (2021-2032) (USD Billion)
10.3.10.2 Spain Small-scale Bioreactors Market Estimates and Forecasts, By Capacity (2021-2032) (USD Billion)
10.3.10.3 Spain Small-scale Bioreactors Market Estimates and Forecasts, By End User (2021-2032) (USD Billion)
10.3.12 Poland
10.3.12.1 Poland Small-scale Bioreactors Market Estimates and Forecasts, by Country (2021-2032) (USD Billion)
10.3.12.1 Poland Small-scale Bioreactors Market Estimates and Forecasts, By Product (2021-2032) (USD Billion)
10.3.12.3 Poland Small-scale Bioreactors Market Estimates and Forecasts, By Capacity (2021-2032) (USD Billion)
10.3.12.3 Poland Small-scale Bioreactors Market Estimates and Forecasts, By End User (2021-2032) (USD Billion)
10.3.13 Turkey
10.3.13.1 Turkey Small-scale Bioreactors Market Estimates and Forecasts, By Product (2021-2032) (USD Billion)
10.3.13.2 Turkey Small-scale Bioreactors Market Estimates and Forecasts, By Capacity (2021-2032) (USD Billion)
10.3.13.3 Turkey Small-scale Bioreactors Market Estimates and Forecasts, By End User (2021-2032) (USD Billion)
10.3.14 Rest of Europe
10.3.14.1 Rest of Europe Small-scale Bioreactors Market Estimates and Forecasts, By Product (2021-2032) (USD Billion)
10.3.14.2 Rest of Europe Small-scale Bioreactors Market Estimates and Forecasts, By Capacity (2021-2032) (USD Billion)
10.3.14.3 Rest of Europe Small-scale Bioreactors Market Estimates and Forecasts, By End User(2021-2032) (USD Billion)
10.4 Asia-Pacific
10.4.1 Trends Analysis
10.4.2 Asia-Pacific Small-scale Bioreactors Market Estimates and Forecasts, by Country (2021-2032) (USD Billion)
10.4.3 Asia-Pacific Small-scale Bioreactors Market Estimates and Forecasts, By Product (2021-2032) (USD Billion)
10.4.4 Asia-Pacific Small-scale Bioreactors Market Estimates and Forecasts, By Capacity (2021-2032) (USD Billion)
10.4.5 Asia-Pacific Small-scale Bioreactors Market Estimates and Forecasts, By End User (2021-2032) (USD Billion)
10.4.6 China
10.4.6.1 China Small-scale Bioreactors Market Estimates and Forecasts, By Product (2021-2032) (USD Billion)
10.4.6.2 China Small-scale Bioreactors Market Estimates and Forecasts, By Capacity (2021-2032) (USD Billion)
10.4.6.3 China Small-scale Bioreactors Market Estimates and Forecasts, By End User (2021-2032) (USD Billion)
10.4.7 India
10.4.7.1 India Small-scale Bioreactors Market Estimates and Forecasts, By Product (2021-2032) (USD Billion)
10.4.7.2 India Small-scale Bioreactors Market Estimates and Forecasts, By Capacity (2021-2032) (USD Billion)
10.4.7.3 India Small-scale Bioreactors Market Estimates and Forecasts, By End User (2021-2032) (USD Billion)
10.4.8 Japan
10.4.8.1 Japan Small-scale Bioreactors Market Estimates and Forecasts, By Product (2021-2032) (USD Billion)
10.4.8.2 Japan Small-scale Bioreactors Market Estimates and Forecasts, By Capacity (2021-2032) (USD Billion)
10.4.8.3 Japan Small-scale Bioreactors Market Estimates and Forecasts, By End User (2021-2032) (USD Billion)
10.4.9 South Korea
10.4.9.1 South Korea Small-scale Bioreactors Market Estimates and Forecasts, By Product (2021-2032) (USD Billion)
10.4.9.2 South Korea Small-scale Bioreactors Market Estimates and Forecasts, By Capacity (2021-2032) (USD Billion)
10.4.9.3 South Korea Small-scale Bioreactors Market Estimates and Forecasts, By End User (2021-2032) (USD Billion)
10.4.10 Singapore
10.4.10.1 Singapore Small-scale Bioreactors Market Estimates and Forecasts, By Product (2021-2032) (USD Billion)
10.4.10.2 Singapore Small-scale Bioreactors Market Estimates and Forecasts, By Capacity (2021-2032) (USD Billion)
10.4.10.3 Singapore Small-scale Bioreactors Market Estimates and Forecasts, By End User (2021-2032) (USD Billion)
10.4.11 Australia
10.4.11.1 Australia Small-scale Bioreactors Market Estimates and Forecasts, By Product (2021-2032) (USD Billion)
10.4.11.2 Australia Small-scale Bioreactors Market Estimates and Forecasts, By Capacity (2021-2032) (USD Billion)
10.4.11.3 Australia Small-scale Bioreactors Market Estimates and Forecasts, By End User (2021-2032) (USD Billion)
10.4.12 Rest of Asia-Pacific
10.4.12.1 Rest of Asia-Pacific Small-scale Bioreactors Market Estimates and Forecasts, By Product (2021-2032) (USD Billion)
10.4.12.2 Rest of Asia-Pacific Small-scale Bioreactors Market Estimates and Forecasts, By Capacity (2021-2032) (USD Billion)
10.4.12.3 Rest of Asia-Pacific Small-scale Bioreactors Market Estimates and Forecasts, By End User (2021-2032) (USD Billion)
10.5 Middle East and Africa
10.5.1 Trends Analysis
10.5.2 Middle East and Africa East Small-scale Bioreactors Market Estimates and Forecasts, by Country (2021-2032) (USD Billion)
10.5.3Middle East and Africa Small-scale Bioreactors Market Estimates and Forecasts, By Product (2021-2032) (USD Billion)
10.5.4 Middle East and Africa Small-scale Bioreactors Market Estimates and Forecasts, By Capacity (2021-2032) (USD Billion)
10.5.5 Middle East and Africa Small-scale Bioreactors Market Estimates and Forecasts, By End User (2021-2032) (USD Billion)
10.5.6 UAE
10.5.6.1 UAE Small-scale Bioreactors Market Estimates and Forecasts, By Product (2021-2032) (USD Billion)
10.5.6.2 UAE Small-scale Bioreactors Market Estimates and Forecasts, By Capacity (2021-2032) (USD Billion)
10.5.6.3 UAE Small-scale Bioreactors Market Estimates and Forecasts, By End User (2021-2032) (USD Billion)
10.5.7 Saudi Arabia
10.5.7.1 Saudi Arabia Small-scale Bioreactors Market Estimates and Forecasts, By Product (2021-2032) (USD Billion)
10.5.7.2 Saudi Arabia Small-scale Bioreactors Market Estimates and Forecasts, By Capacity (2021-2032) (USD Billion)
10.5.7.3 Saudi Arabia Small-scale Bioreactors Market Estimates and Forecasts, By End User (2021-2032) (USD Billion)
10.5.8 Qatar
10.5.8.1 Qatar Small-scale Bioreactors Market Estimates and Forecasts, By Product (2021-2032) (USD Billion)
10.5.8.2 Qatar Small-scale Bioreactors Market Estimates and Forecasts, By Capacity (2021-2032) (USD Billion)
10.5.8.3 Qatar Small-scale Bioreactors Market Estimates and Forecasts, By End User (2021-2032) (USD Billion)
10.5.9 South Africa
10.5.9 1 South Africa Small-scale Bioreactors Market Estimates and Forecasts, By Product (2021-2032) (USD Billion)
10.5.9 2 South Africa Small-scale Bioreactors Market Estimates and Forecasts By Capacity (2021-2032) (USD Billion)
10.5.9 3 South Africa Small-scale Bioreactors Market Estimates and Forecasts, By End User (2021-2032) (USD Billion)
10.5.10 Rest of Middle East & Africa
10.5.10.1 Rest of Middle East & Africa Small-scale Bioreactors Market Estimates and Forecasts, By Product (2021-2032) (USD Billion)
10.5.10.2 Rest of Middle East & Africa Small-scale Bioreactors Market Estimates and Forecasts, By Capacity (2021-2032) (USD Billion)
10.5.10.3 Rest of Middle East & Africa Small-scale Bioreactors Market Estimates and Forecasts, By End User (2021-2032) (USD Billion)
10.6 Latin America
10.6.1 Trends Analysis
10.6.2 Latin America Small-scale Bioreactors Market Estimates and Forecasts, by Country (2021-2032) (USD Billion)
10.6.3 Latin America Small-scale Bioreactors Market Estimates and Forecasts, By Product (2021-2032) (USD Billion)
10.6.4 Latin America Small-scale Bioreactors Market Estimates and Forecasts, By Capacity (2021-2032) (USD Billion)
10.6.5 Latin America Small-scale Bioreactors Market Estimates and Forecasts, By End User (2021-2032) (USD Billion)
10.6.6 Brazil
10.6.6.1 Brazil Small-scale Bioreactors Market Estimates and Forecasts, By Product (2021-2032) (USD Billion)
10.6.6.2 Brazil Small-scale Bioreactors Market Estimates and Forecasts, By Capacity (2021-2032) (USD Billion)
10.6.6.3 Brazil Small-scale Bioreactors Market Estimates and Forecasts, By End User (2021-2032) (USD Billion)
10.6.7 Argentina
10.6.7.1 Argentina Small-scale Bioreactors Market Estimates and Forecasts, By Product (2021-2032) (USD Billion)
10.6.7.2 Argentina Small-scale Bioreactors Market Estimates and Forecasts, By Capacity (2021-2032) (USD Billion)
10.6.7.3 Argentina Small-scale Bioreactors Market Estimates and Forecasts, By End User (2021-2032) (USD Billion)
10.6.8 Rest of Latin America
10.6.8.1 Rest of Latin America Small-scale Bioreactors Market Estimates and Forecasts, By Product (2021-2032) (USD Billion)
10.6.8.2 Rest of Latin America Small-scale Bioreactors Market Estimates and Forecasts, By Capacity (2021-2032) (USD Billion)
10.6.8.3 Rest of Latin America Small-scale Bioreactors Market Estimates and Forecasts, By End User (2021-2032) (USD Billion)
12. Company Profiles
12.1 Sartorius AG
12.1.1 Company Overview
12.1.2 Financial
12.1.3 Products/ Services Offered
12.1.4 SWOT Analysis
12.2 Thermo Fisher Scientific Inc.
12.2.1 Company Overview
12.2.2 Financial
12.2.3 Products/ Services Offered
12.2.4 SWOT Analysis
12.3 Merck KGaA
12.3.1 Company Overview
12.3.2 Financial
12.3.3 Products/ Services Offered
12.3.4 SWOT Analysis
12.4 GE Healthcare
12.4.1 Company Overview
12.4.2 Financial
12.4.3 Products/ Services Offered
12.4.4 SWOT Analysis
12.5 Danaher Corporation
12.5.1 Company Overview
12.5.2 Financial
12.5.3 Products/ Services Offered
12.5.4 SWOT Analysis
12.6 Eppendorf AG
12.6.1 Company Overview
12.6.2 Financial
12.6.3 Products/ Services Offered
12.6.4 SWOT Analysis
12.7 Lonza Group AG
12.7.1 Company Overview
12.7.2 Financial
12.7.3 Products/ Services Offered
12.7.4 SWOT Analysis
12.8 Miltenyi Biotec B.V. & Co. KG
12.8.1 Company Overview
12.8.2 Financial
12.8.3 Products/ Services Offered
12.8.4 SWOT Analysis
12.9 Solaris Biotechnology Srl
12.9.1 Company Overview
12.9.2 Financial
12.9.3 Products/ Services Offered
12.9.4 SWOT Analysis
12.10 Infors AG,
12.10.1 Company Overview
12.10.2 Financial
12.10.3 Products/ Services Offered
12.10.4 SWOT Analysis
12. Use Cases and Best Practices
13. Conclusion
An accurate research report requires proper strategizing as well as implementation. There are multiple factors involved in the completion of good and accurate research report and selecting the best methodology to compete the research is the toughest part. Since the research reports we provide play a crucial role in any company’s decision-making process, therefore we at SNS Insider always believe that we should choose the best method which gives us results closer to reality. This allows us to reach at a stage wherein we can provide our clients best and accurate investment to output ratio.
Each report that we prepare takes a timeframe of 350-400 business hours for production. Starting from the selection of titles through a couple of in-depth brain storming session to the final QC process before uploading our titles on our website we dedicate around 350 working hours. The titles are selected based on their current market cap and the foreseen CAGR and growth.
The 5 steps process:
Step 1: Secondary Research:
Secondary Research or Desk Research is as the name suggests is a research process wherein, we collect data through the readily available information. In this process we use various paid and unpaid databases which our team has access to and gather data through the same. This includes examining of listed companies’ annual reports, Journals, SEC filling etc. Apart from this our team has access to various associations across the globe across different industries. Lastly, we have exchange relationships with various university as well as individual libraries.
Step 2: Primary Research
When we talk about primary research, it is a type of study in which the researchers collect relevant data samples directly, rather than relying on previously collected data. This type of research is focused on gaining content specific facts that can be sued to solve specific problems. Since the collected data is fresh and first hand therefore it makes the study more accurate and genuine.
We at SNS Insider have divided Primary Research into 2 parts.
Part 1 wherein we interview the KOLs of major players as well as the upcoming ones across various geographic regions. This allows us to have their view over the market scenario and acts as an important tool to come closer to the accurate market numbers. As many as 45 paid and unpaid primary interviews are taken from both the demand and supply side of the industry to make sure we land at an accurate judgement and analysis of the market.
This step involves the triangulation of data wherein our team analyses the interview transcripts, online survey responses and observation of on filed participants. The below mentioned chart should give a better understanding of the part 1 of the primary interview.
Part 2: In this part of primary research the data collected via secondary research and the part 1 of the primary research is validated with the interviews from individual consultants and subject matter experts.
Consultants are those set of people who have at least 12 years of experience and expertise within the industry whereas Subject Matter Experts are those with at least 15 years of experience behind their back within the same space. The data with the help of two main processes i.e., FGDs (Focused Group Discussions) and IDs (Individual Discussions). This gives us a 3rd party nonbiased primary view of the market scenario making it a more dependable one while collation of the data pointers.
Step 3: Data Bank Validation
Once all the information is collected via primary and secondary sources, we run that information for data validation. At our intelligence centre our research heads track a lot of information related to the market which includes the quarterly reports, the daily stock prices, and other relevant information. Our data bank server gets updated every fortnight and that is how the information which we collected using our primary and secondary information is revalidated in real time.
Step 4: QA/QC Process
After all the data collection and validation our team does a final level of quality check and quality assurance to get rid of any unwanted or undesired mistakes. This might include but not limited to getting rid of the any typos, duplication of numbers or missing of any important information. The people involved in this process include technical content writers, research heads and graphics people. Once this process is completed the title gets uploader on our platform for our clients to read it.
Step 5: Final QC/QA Process:
This is the last process and comes when the client has ordered the study. In this process a final QA/QC is done before the study is emailed to the client. Since we believe in giving our clients a good experience of our research studies, therefore, to make sure that we do not lack at our end in any way humanly possible we do a final round of quality check and then dispatch the study to the client.
Key Segments:
By Product
Reusable Bioreactors
Stainless Steel Bioreactors
Glass Bioreactors
Single-use Bioreactors
By Capacity
5 ML- -100 ML
100 ML-250 ML
250 ML -500 ML
500 ML-1 L
1L-3L
3L-5L
By End Use
Pharmaceutical & Biopharmaceutical Companies
CROs & CMOs
Academic & Research Institutes
Request for Segment Customization as per your Business Requirement: Segment Customization Request
Regional Coverage:
North America
US
Canada
Mexico
Europe
Germany
France
UK
Italy
Spain
Poland
Turkey
Rest of Europe
Asia Pacific
China
India
Japan
South Korea
Singapore
Australia
Rest of Asia Pacific
Middle East & Africa
UAE
Saudi Arabia
Qatar
South Africa
Rest of Middle East & Africa
Latin America
Brazil
Argentina
Rest of Latin America
Request for Country Level Research Report: Country Level Customization Request
Available Customization
With the given market data, SNS Insider offers customization as per the company’s specific needs. The following customization options are available for the report:
Detailed Volume Analysis
Criss-Cross segment analysis (e.g., Product X Application)
Competitive Product Benchmarking
Geographic Analysis
Additional countries in any of the regions
Customized Data Representation
Detailed analysis and profiling of additional market players