To get more information on Smart Factory Market - Request Free Sample Report
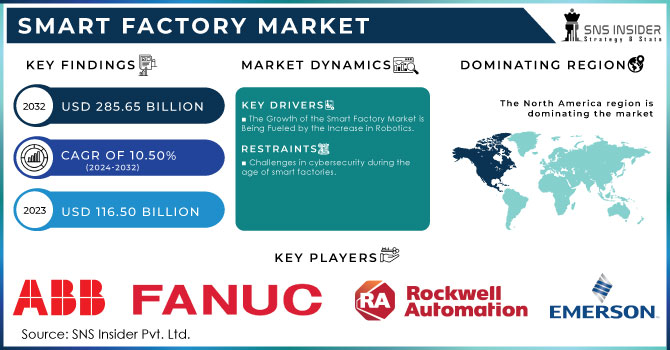
The Smart Factory Market size was valued at USD 116.50 Billion in 2023. It is expected to grow to USD 285.65 Billion by 2032 and grow at a CAGR of 10.50 % over the forecast period of 2024-2032.
The smart factory sector is projected to see significant expansion thanks to Industry 4.0 technologies transforming production methods and delivering noticeable benefits in efficiency and cost reduction. The core of this transformation involves the integration of the Internet of Things (IoT), connecting machines and devices to the Internet to quickly collect and analyze data. This connection, fueled by artificial intelligence and machine learning, offers valuable understanding of IoT data, enhancing operational efficiency. Anticipatory maintenance, automation of processes using robots, computing at the edge, and digital twins are crucial components of intelligent manufacturing. For example, digital twins in the aviation industry replicate actual systems and operations, improving safety, productivity, and environmental awareness. Implementing these technologies results in decreased downtime for machines, enhanced inventory usage, higher throughput, better forecasting accuracy, and improved efficiency of human workforce. The massive quantities of data produced by intelligent manufacturing need to be efficiently handled and incorporated to prevent issues related to isolated data systems. At present, 82% of CEOs in industries relying heavily on supply chain operations intend to boost digital expenditures, yet only 32% have synchronized their digital supply chain strategies with standard governance procedures and business objectives. By investing in smart technologies, manufacturers are able to access significant value throughout the supply chain, preparing themselves for future expansion in a data-focused industry.
The use of digital technology, especially with the Industrial Internet of Things (IIoT), is changing manufacturing by linking machines and allowing for the collection and analysis of data in real-time. The increase in manufacturing IoT connections is predicted to more than double between 2020 and 2025, showing a noticeable shift. In order to take advantage of these progressions, it is essential to democratize smart manufacturing, enabling small and medium-sized manufacturers (SMMs) to use these technologies for a competitive edge. Programs like Manufacturing USA are crucial in helping the U.S. maintain its global leadership in advanced manufacturing by promoting cooperation between industry, government, and academia. Consisting of 16 institutes supported by governmental organizations, this network has made significant advancements with more than 500 large-scale research initiatives and a financial commitment of USD 400 Billion in the year 2020. The emphasis is on developing vendor-neutral, easy-to-integrate solutions that streamline the implementation of smart manufacturing technologies. For example, simple IoT upgrades, such as converting air pressure systems to digital or adding sensors to old equipment, provide affordable options for manufacturers to begin their digital transformation process. These improvements are not just increasing productivity and cutting expenses, but also preparing the foundation for a manufacturing environment that is more interconnected and adaptable. The importance of ongoing innovation and investment in the smart factory market is highlighted by the dedication to overcoming obstacles and providing access to advanced technologies.
MARKET DYNAMICS:
Drivers
The Growth of the Smart Factory Market is Being Fueled by the Increase in Robotics.
The rapid growth and implementation of robotics technology are major factors in driving the smart factory market, as demonstrated by recent global robotics usage data. China, currently the biggest user of industrial robots globally, showcases how proactive policies and investments can reshape manufacturing environments. In 2021, China surpassed the United States by having 18% more robots per manufacturing worker installed, as part of a strategic effort to improve automation. China's utilization of robots in the manufacturing sector was 12 times greater than that of the United States, primarily due to government funding and policy decisions that promoted the widespread implementation of robotics as a crucial national goal. In contrast, the U.S. has fallen behind in production and export intensity, despite its innovation, only making up 5.4% of global robot exports in 2022. Japan led the worldwide robotics production with a 46% share and had a robot export intensity 20 times higher than the U.S. This difference highlights the importance of investing more in robotics and automation to stay competitive in the smart factory market. While smart factories use advanced technologies to improve efficiency, boost productivity, and cut costs, the global shift towards greater use of robotics is still influencing the market. According to the IFR's data, Korea has the highest density of robots with more than 1,000 robots for every 10,000 manufacturing employees, with Singapore and Japan following closely behind, while the U.S. and China have 285 and 392 robots per 10,000 workers respectively. These numbers demonstrate the increasing worldwide focus on robotics as a fundamental part of intelligent manufacturing, fueling market expansion and causing widespread changes within industries towards automated, productive systems.
The increase in interest in robotics plays a major role in the progression of smart factories. With the growth of global robotics manufacturing, leading Western robot producers have set up production plants in strategic locations. ABB and Fanuc, for example, have constructed the most advanced and largest robot manufacturing plants in Shanghai. Yaskawa Electric Corporation from Japan has also played a part by establishing three factories in China, capable of producing 18,000 robots each year. The increase in foreign investment not only supports local manufacturing but also enables the transfer of technology, helping domestic companies reduce the innovation gap through spillover effects, even with measures in place to prevent intellectual property theft.
Furthermore, the field of robotics is also thriving with local participants alongside international ones. Starting from 2017, more than 3,400 robotics start-ups have appeared, with a specific focus on autonomous mobile robots (AMRs) under the "100 Billion Robot Program." This increase emphasizes the quick progress of robotic businesses and emphasizes their ability to innovate, with numerous new companies gaining venture capital from other areas. There is a significant dependence on foreign technology, with 71% of new robots being imported and key parts like harmonic gear reducers coming mainly from Japanese and other international companies. This reliance is also evident in the 2022 data from China, indicating that the value of imported robotics exceeded exports by 64%.This trend in the smart factory market shows an increasing combination of advanced robotics technologies, influenced by both domestic innovation and foreign impact. Utilizing advanced robotics and AMRs is crucial in smart factories to improve operational efficiency and meet automation objectives.
Restraints
Challenges in cybersecurity during the age of smart factories.
The digital and physical integration in cyber-physical systems (CPS) has revolutionized manufacturing, resulting in smart factories that boast unmatched productivity and adaptability. Nevertheless, this incorporation also makes manufacturers vulnerable to notable cybersecurity threats. By incorporating robotics, AI, big data, and virtual reality, CPS technology introduces fresh weaknesses that cybercriminals can take advantage of. Cyber-attacks targeting CPS have the potential to interrupt production, jeopardize confidential information, and result in significant monetary damages. Despite the advancements, the growing complexity and interconnected nature of CPS necessitate strong cybersecurity measures to defend against changing threats. Ensuring stringent access controls, consistent updates, and ongoing monitoring are crucial to protect these vital systems and uphold the integrity of manufacturing operations.
By Component
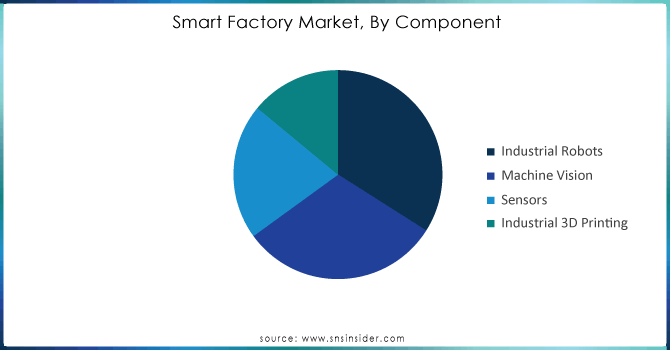
Based on Component, Industrial Robots is capturing the largest share revenue in Smart Factory Market with 34% of share in 2023 This substantial market presence emphasizes the crucial role industrial robots have in contemporary manufacturing settings, where emphasis is on automation, precision, and efficiency. The industrial sensor market, closely associated with the performance of industrial robots, has also experienced significant worldwide expansion, fueled by the rising need for automation and data-based decision-making in different sectors like manufacturing, healthcare, and energy. These sectors are increasingly integrating sensor technologies in order to boost operational effectiveness, minimize downtime, and enhance product quality. The rapid utilization of sensors in smart factories is being further expedited by the advancements in technology, especially with the incorporation of Internet of Things (IoT) and Artificial Intelligence (AI). ABB, Siemens, and Honeywell are at the forefront of creating and implementing cutting-edge sensors and robotics technology crucial for the operation of intelligent manufacturing facilities. For example, ABB's industrial robots come with sensors for real-time data monitoring, enabling predictive maintenance and reducing the chances of operational failures. Likewise, Siemens’ sensors with IoT capabilities offer in-depth data analysis, enabling manufacturers to make well-informed choices that improve efficiency. The global industrial sensor market is expanding widely due to the growing acknowledgment of the advantages of real-time data monitoring and analytics. This trend is vital in smart factories, where the smooth merging of sensors and robots is necessary to achieve a completely automated and optimized production process. With the increasing realization of the importance of data-driven insights for improving operational efficiency, the need for industrial sensors and robots in smart factories is forecasted to keep rising, strengthening their role as vital elements of the Industry 4.0 evolution.
Need any customization research on Smart Factory Market - Enquiry Now
By Industry
Based on Industry, Discrete Industries is capturing the largest share in smart factory market with 58% of share in 2023. Industries like automotive, electronics, aerospace, and machinery manufacturing are known for producing specific items such as cars, computers, and aircraft. These sectors are more and more utilizing smart factory technologies to improve efficiency, accuracy, and adaptability in their production methods. The incorporation of cutting-edge technologies like industrial robots, IoT, AI, and industrial sensors has played a crucial role in turning conventional factories into intelligent, interconnected settings. For example, major car manufacturers such as BMW and Tesla are utilizing smart factory technology, incorporating robotics and IoT-driven automation to improve production efficiency, minimize mistakes, and speed up product development. Siemens, an important participant in the smart factory environment, provides its Digital Enterprise package, allowing discrete manufacturers to generate digital replicas of their factories for real-time monitoring, simulation, and optimization of production processes. Likewise, Bosch has integrated Industry 4.0 technologies in its production facilities, employing IoT sensors and AI-powered analysis to improve operational effectiveness and preemptive maintenance. The implementation of smart factory technologies in discrete sectors is motivated by the necessity to fulfill increasing consumer requests for personalized items, quicker manufacturing times, and elevated quality benchmarks. In these industries, being able to easily adjust to shifts in production needs and effectively handle intricate manufacturing operations has now become a key factor for gaining a competitive edge.
REGIONAL ANALYSIS:
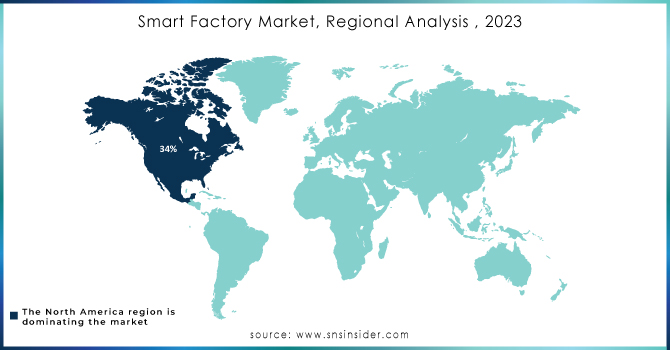
North America dominate the smart factory market with 34% of share in 2023. The global smart factory marketplace's leadership in the region is mainly due to the early utilization of advanced manufacturing technologies, a high number of important industry participants, and substantial funding in Industry 4.0 projects. In the US, the manufacturing industry is more and more incorporating IoT, AI, and cloud computing technologies to tackle issues like labor shortages and the demand for increased efficiency. The federal government and private sector have been making significant investments in smart manufacturing solutions to enhance the competitiveness of U.S. industries worldwide. For example, General Electric (GE) has been leading the way in embracing smart factory technologies, utilizing its Prefix platform to enhance operations with real-time data analysis and predictive maintenance. Likewise, Rockwell Automation, an important participant in the realm of smart manufacturing, has been broadening its range of advanced IoT solutions to improve production efficiency and flexibility in different industries. The car manufacturing sector, with companies such as Ford and General Motors at the helm, has adopted smart factory technologies as well, incorporating sophisticated robotics and automated systems to improve efficiency and lower expenses. Furthermore, Canada is making notable progress in advanced manufacturing, as shown by Magna International's investment in IoT and AI technologies to enhance efficiency and quality of products. The quick progress in cloud manufacturing technologies, especially in the United States, is also influencing the growth of smart factories. Companies like Microsoft and Amazon Web Services (AWS) offer cloud-based platforms that allow manufacturers to expand their operations, improve supply chains, and incorporate data-driven decision-making procedures. With North America taking the lead in smart factory adoption, the region is ready to keep its strong position in the global market thanks to constant technological advancements and strategic investments from government and industry leaders.
In the year 2023, Asia Pacific had become an important participant in the worldwide Smart Factory Market, capturing a 23% market share. The strong expansion in this area is fueled by the rising use of Industry 4.0 technologies. government programs, and the participation of top manufacturing companies making significant investments in smart manufacturing solutions. In the Asia Pacific region, China, Japan, and South Korea are at the forefront. China, specifically, has heavily invested in smart factories as part of the "Made in China 2025" plan, with the goal of shifting from a major manufacturing player to a pioneer in advanced manufacturing technologies. Huawei and Ten cent are at the forefront of creating industrial IoT platforms that allow manufacturers to incorporate automation, data sharing, and live monitoring into their production processes. Moreover, Mitsubishi Electric in Japan is utilizing its e-F@ctory concept to boost efficiency and cut expenses in different sectors, strengthening the area's leadership in intelligent production.
KEY PLAYERS:
The Major key players are ABB Limited, Emerson Electric Co., Fanuc Corporation, General Electric Company, Honeywell International, Johnson Control International Plc, Mitsubishi Electric Corporation, Rockwell Automation, Schneider Electric, Yokogawa Electric and Other Players.
Recent Development:
In July 2023, First Mode is constructing a smart manufacturing plant in Seattle, USA, to manufacture zero-emission powerplants and related ground infrastructure for its nuGen transportation solutions. The establishment will allow simultaneous creation and manufacturing of various nuGen engine designs and will transform and streamline processes for a more intelligent, secure, and effective plant.
In June 2023, Palantir and Panasonic Energy collaborated to provide a smart factory solution that combines edge sensors, introduces automated efficiencies, and allows operational users to utilize connected operations. The system will be implemented in all of PENA's facilities in Nevada and Kansas to assist in making operational decisions and enhance the quantity and quality of production results.
In November 2023, Siemens is constructing a $150 Billion smart factory in Dallas-Fort Worth, USA, to manufacture electrical equipment for data centers and critical infrastructure. The factory plans to enhance efficiency and sustainability by implementing Siemens' Xcelerator portfolio of Industry 4.0 solutions, which includes IoT, AI, and digital twin technology. The factory is projected to generate 700 fresh employment opportunities and commence operations in 2025.
In October 2023, Beverston Engineering spent £173,000 on sensor technology and software to link its 20 machines and establish a smart factory. This has led to a 20% boost in productivity, higher profits, new clients, and a 10% decrease in carbon emissions. Made Smarter also gave assistance to Beverston Engineering in the recruitment of new talent, including Oliver Miller, who is working as an Industry 4.0 Project Manager.
Report Attributes | Details |
---|---|
Market Size in 2023 | USD 116.50 Billion |
Market Size by 2032 | USD 285.65 Billion |
CAGR | CAGR 10.50% From 2024 to 2032 |
Base Year | 2023 |
Forecast Period | 2024-2032 |
Historical Data | 2020-2022 |
Report Scope & Coverage | Market Size, Segments Analysis, Competitive Landscape, Regional Analysis, DROC & SWOT Analysis, Forecast Outlook |
Key Segments | • by Component (Industrial Robots, Machine Vision, Sensors, Industrial 3D Printing) • By Solution (SCADA, PLC, DCS, MES, PLM, ERP, HMI, PAM) • By Industry (Process Industries and Discrete Industries) |
Regional Analysis/Coverage | North America (US, Canada, Mexico), Europe (Eastern Europe [Poland, Romania, Hungary, Turkey, Rest of Eastern Europe] Western Europe] Germany, France, UK, Italy, Spain, Netherlands, Switzerland, Austria, Rest of Western Europe]), Asia Pacific (China, India, Japan, South Korea, Vietnam, Singapore, Australia, Rest of Asia Pacific), Middle East & Africa (Middle East [UAE, Egypt, Saudi Arabia, Qatar, Rest of Middle East], Africa [Nigeria, South Africa, Rest of Africa], Latin America (Brazil, Argentina, Colombia, Rest of Latin America) |
Company Profiles | ABB Limited, Emerson Electric Co., Fanuc Corporation, General Electric Company, Honeywell International, Johnson Control International Plc, Mitsubishi Electric Corporation, Rockwell Automation, Schneider Electric, Yokogawa Electric. |
Key Drivers | • The Growth of the Smart Factory Market is Being Fueled by the Increase in Robotics. |
Restraints | • Challenges in cybersecurity during the age of smart factories. |
Ans Expected to grow at a CAGR of 10.50 % over the forecast period of 2024-2032.
Ans: The Smart Factory Market size was valued at USD 116.50 Billion in 2023. It is expected to grow to USD 285.65 Billion by 2031 and grow at a CAGR of 10.50 % over the forecast period of 2024-2032.
Ans: The major growth factor of the Smart Factory Market is the increasing adoption of Industry 4.0 technologies, including advanced robotics, IoT, and AI-driven automation, to enhance manufacturing efficiency and productivity.
Ans: The Industrial Robots segment dominated the Smart Factory Market.
Ans: North America dominated the Smart Factory Market in 2023.
1. Introduction
1.1 Market Definition
1.2 Scope (Inclusion and Exclusions)
1.3 Research Assumptions
2. Executive Summary
2.1 Market Overview
2.2 Regional Synopsis
2.3 Competitive Summary
3. Research Methodology
3.1 Top-Down Approach
3.2 Bottom-up Approach
3.3. Data Validation
3.4 Primary Interviews
4. Market Dynamics Impact Analysis
4.1 Market Driving Factors Analysis
4.1.1 Drivers
4.1.2 Restraints
4.1.3 Opportunities
4.1.4 Challenges
4.2 PESTLE Analysis
4.3 Porter’s Five Forces Model
5. Statistical Insights and Trends Reporting
5.1Manufacturing Output, by Region, (2020-2023)
5.2 Utilization Rates, by Region, (2020-2023)
5.3 Maintenance and Downtime Metrix
5.4 Technological Adoption Rates, by Region
5.5 Export/Import Data, by Region (2023)
6. Competitive Landscape
6.1 List of Major Companies, By Region
6.2 Market Share Analysis, By Region
6.3 Product Benchmarking
6.3.1 Product specifications and features
6.3.2 Pricing
6.4 Strategic Initiatives
6.4.1 Marketing and promotional activities
6.4.2 Distribution and supply chain strategies
6.4.3 Expansion plans and new product launches
6.4.4 Strategic partnerships and collaborations
6.5 Technological Advancements
6.6 Market Positioning and Branding
7. Smart Factory Market Segmentation, by Component
7.1 Chapter Overview
7.2 Industrial Robots
7.2.1 Industrial Robots Market Trends Analysis (2020-2032)
7.2.2 Industrial Robots Market Size Estimates and Forecasts to 2032 (USD Billion)
7.3 Machine Vision
7.3.1 Machine Vision Market Trends Analysis (2020-2032)
7.3.2 Machine Vision Market Size Estimates and Forecasts to 2032 (USD Billion)
7.4 Sensors
7.4.1 Sensors Market Trends Analysis (2020-2032)
7.4.2 Sensors Market Size Estimates and Forecasts to 2032 (USD Billion)
7.5 Industrial 3D Printing
7.5.1 Industrial 3D Printing Market Trends Analysis (2020-2032)
7.5.2 Industrial 3D Printing Market Size Estimates and Forecasts to 2032 (USD Billion)
8. Smart Factory Market Segmentation, by Solution
8.1 Chapter Overview
8.2 SCADA (Supervisory Control and Data Acquisition)
8.2.1 SCADA (Supervisory Control and Data Acquisition) Market Trends Analysis (2020-2032)
8.2.2 SCADA (Supervisory Control and Data Acquisition) Market Size Estimates and Forecasts to 2032 (USD Billion)
8.3 PLC (Programmable Logic Controller)
8.3.1 PLC (Programmable Logic Controller) Market Trends Analysis (2020-2032)
8.3.2 PLC (Programmable Logic Controller) Market Size Estimates and Forecasts to 2032 (USD Billion)
8.4 MES (Manufacturing Execution System)
8.4.1 MES (Manufacturing Execution System) Market Trends Analysis (2020-2032)
8.4.2 MES (Manufacturing Execution System) Market Size Estimates and Forecasts to 2032 (USD Billion)
8.5 PLM (Product Life Cycle Management)
8.5.1 PLM (Product Life Cycle Management) Market Trends Analysis (2020-2032)
8.5.2 PLM (Product Life Cycle Management) Market Size Estimates and Forecasts to 2032 (USD Billion)
8.6 ERP (Enterprise Resource Planning)
8.6.1 ERP (Enterprise Resource Planning) Market Trends Analysis (2020-2032)
8.6.2 ERP (Enterprise Resource Planning) Market Size Estimates and Forecasts to 2032 (USD Billion)
8.7 HMI (Human–Machine Interface)
8.7.1 HMI (Human–Machine Interface) Market Trends Analysis (2020-2032)
8.7.2 HMI (Human–Machine Interface) Market Size Estimates and Forecasts to 2032 (USD Billion)
8.8 PAM (Plant Asset Management)
8.8.1 PAM (Plant Asset Management) Market Trends Analysis (2020-2032)
8.8.2 PAM (Plant Asset Management) Market Size Estimates and Forecasts to 2032 (USD Billion)
9. Smart Factory Market Segmentation, by Industry
9.1 Chapter Overview
9.2 Process Industries
9.2.1 Process Industries Market Trends Analysis (2020-2032)
9.2.2 Process Industries Market Size Estimates and Forecasts to 2032 (USD Billion)
9.2.1 Oil & Gas
9.2.1.1Oil & Gas Market Trends Analysis (2020-2032)
9.2.1.2 Oil & Gas Market Size Estimates and Forecasts to 2032 (USD Billion)
9.2.2 Chemicals
9.2.2.1 Chemicals Market Trends Analysis (2020-2032)
9.2.2.2 Chemicals Market Size Estimates and Forecasts to 2032 (USD Billion)
9.2.3 Pharmaceuticals
9.2.3.1Oil & Gas Market Trends Analysis (2020-2032)
9.2.3.2 Oil & Gas Market Size Estimates and Forecasts to 2032 (USD Billion)
9.2.4 Energy & Power
9.2.4.1 Energy & Power Market Trends Analysis (2020-2032)
9.2.4.2 Energy & Power Market Size Estimates and Forecasts to 2032 (USD Billion)
9.2.5 Metals & Mining
9.2.5.1 Metals & Mining Market Trends Analysis (2020-2032)
9.2.5.2 Metals & Mining Market Size Estimates and Forecasts to 2032 (USD Billion)
9.2.6Pulp & Paper
9.2.6.1 Pulp & Paper Market Trends Analysis (2020-2032)
9.2.6.2 Pulp & Paper Market Size Estimates and Forecasts to 2032 (USD Billion)
9.2.7 Food & Beverages
9.2.7.1 Food & Beverages Market Trends Analysis (2020-2032)
9.2.7.2 Food & Beverages Market Size Estimates and Forecasts to 2032 (USD Billion)
9.2.8 Others
9.2.8.1 Others Market Trends Analysis (2020-2032)
9.2.8.2 Others Market Size Estimates and Forecasts to 2032 (USD Billion)
9.3 Discrete Industries
9.3.1 Discrete Industries Market Trends Analysis (2020-2032)
9.3.2 Discrete Industries Market Size Estimates and Forecasts to 2032 (USD Billion)
9.3.1 Automotive
9.3.1.1Automotive Market Trends Analysis (2020-2032)
9.3.1.2 Automotive Market Size Estimates and Forecasts to 2032 (USD Billion)
9.3.2 Aerospace & Defense
9.3.2.1 Aerospace & Defense Market Trends Analysis (2020-2032)
9.3.2.2 Aerospace & Defense Market Size Estimates and Forecasts to 2032 (USD Billion)
9.3.3 Semiconductor & Electronics
9.3.3.1 Semiconductor & Electronics Market Trends Analysis (2020-2032)
9.3.3.2 Semiconductor & Electronics Market Size Estimates and Forecasts to 2032 (USD Billion)
9.3.4 Machine Manufacturing
9.3.4.1 Machine Manufacturing Market Trends Analysis (2020-2032)
9.3.4.2 Machine Manufacturing Market Size Estimates and Forecasts to 2032 (USD Billion)
9.3.5 Medical Devices
9.3.5.1 Medical Devices Market Trends Analysis (2020-2032)
9.3.5.2 Medical Devices Market Size Estimates and Forecasts to 2032 (USD Billion)
9.3.6 Others
9.3.6.1 Others Market Trends Analysis (2020-2032)
9.3.6.2 Others Market Size Estimates and Forecasts to 2032 (USD Billion)
10. Regional Analysis
10.1 Chapter Overview
10.2 North America
10.2.1 Trends Analysis
10.2.2 North America Smart Factory Market Estimates and Forecasts, by Country (2020-2032) (USD Billion)
10.2.3 North America Smart Factory Market Estimates and Forecasts, by Component (2020-2032) (USD Billion)
10.2.4 North America Smart Factory Market Estimates and Forecasts, by Solution (2020-2032) (USD Billion)
10.2.5 North America Smart Factory Market Estimates and Forecasts, by Industry (2020-2032) (USD Billion)
10.2.6 USA
10.2.6.1 USA Smart Factory Market Estimates and Forecasts, by Component (2020-2032) (USD Billion)
10.2.6.2 USA Smart Factory Market Estimates and Forecasts, by Solution (2020-2032) (USD Billion)
10.2.6.3 USA Smart Factory Market Estimates and Forecasts, by Industry (2020-2032) (USD Billion)
10.2.7 Canada
10.2.7.1 Canada Smart Factory Market Estimates and Forecasts, by Component (2020-2032) (USD Billion)
10.2.7.2 Canada Smart Factory Market Estimates and Forecasts, by Solution (2020-2032) (USD Billion)
10.2.7.3 Canada Smart Factory Market Estimates and Forecasts, by Industry (2020-2032) (USD Billion)
10.2.8 Mexico
10.2.8.1 Mexico Smart Factory Market Estimates and Forecasts, by Component (2020-2032) (USD Billion)
10.2.8.2 Mexico Smart Factory Market Estimates and Forecasts, by Solution (2020-2032) (USD Billion)
10.2.8.3 Mexico Smart Factory Market Estimates and Forecasts, by Industry (2020-2032) (USD Billion)
10.3 Europe
10.3.1 Eastern Europe
10.3.1.1 Trends Analysis
10.3.1.2 Eastern Europe Smart Factory Market Estimates and Forecasts, by Country (2020-2032) (USD Billion)
10.3.1.3 Eastern Europe Smart Factory Market Estimates and Forecasts, by Component (2020-2032) (USD Billion)
10.3.1.4 Eastern Europe Smart Factory Market Estimates and Forecasts, by Solution (2020-2032) (USD Billion)
10.3.1.5 Eastern Europe Smart Factory Market Estimates and Forecasts, by Industry (2020-2032) (USD Billion)
10.3.1.6 Poland
10.3.1.6.1 Poland Smart Factory Market Estimates and Forecasts, by Component (2020-2032) (USD Billion)
10.3.1.6.2 Poland Smart Factory Market Estimates and Forecasts, by Solution (2020-2032) (USD Billion)
10.3.1.6.3 Poland Smart Factory Market Estimates and Forecasts, by Industry (2020-2032) (USD Billion)
10.3.1.7 Romania
10.3.1.7.1 Romania Smart Factory Market Estimates and Forecasts, by Component (2020-2032) (USD Billion)
10.3.1.7.2 Romania Smart Factory Market Estimates and Forecasts, by Solution (2020-2032) (USD Billion)
10.3.1.7.3 Romania Smart Factory Market Estimates and Forecasts, by Industry (2020-2032) (USD Billion)
10.3.1.8 Hungary
10.3.1.8.1 Hungary Smart Factory Market Estimates and Forecasts, by Component (2020-2032) (USD Billion)
10.3.1.8.2 Hungary Smart Factory Market Estimates and Forecasts, by Solution (2020-2032) (USD Billion)
10.3.1.8.3 Hungary Smart Factory Market Estimates and Forecasts, by Industry (2020-2032) (USD Billion)
10.3.1.9 Turkey
10.3.1.9.1 Turkey Smart Factory Market Estimates and Forecasts, by Component (2020-2032) (USD Billion)
10.3.1.9.2 Turkey Smart Factory Market Estimates and Forecasts, by Solution (2020-2032) (USD Billion)
10.3.1.9.3 Turkey Smart Factory Market Estimates and Forecasts, by Industry (2020-2032) (USD Billion)
10.3.1.10 Rest of Eastern Europe
10.3.1.10.1 Rest of Eastern Europe Smart Factory Market Estimates and Forecasts, by Component (2020-2032) (USD Billion)
10.3.1.10.2 Rest of Eastern Europe Smart Factory Market Estimates and Forecasts, by Solution (2020-2032) (USD Billion)
10.3.1.10.3 Rest of Eastern Europe Smart Factory Market Estimates and Forecasts, by Industry (2020-2032) (USD Billion)
10.3.2 Western Europe
10.3.2.1 Trends Analysis
10.3.2.2 Western Europe Smart Factory Market Estimates and Forecasts, by Country (2020-2032) (USD Billion)
10.3.2.3 Western Europe Smart Factory Market Estimates and Forecasts, by Component (2020-2032) (USD Billion)
10.3.2.4 Western Europe Smart Factory Market Estimates and Forecasts, by Solution (2020-2032) (USD Billion)
10.3.2.5 Western Europe Smart Factory Market Estimates and Forecasts, by Industry (2020-2032) (USD Billion)
10.3.2.6 Germany
10.3.2.6.1 Germany Smart Factory Market Estimates and Forecasts, by Component (2020-2032) (USD Billion)
10.3.2.6.2 Germany Smart Factory Market Estimates and Forecasts, by Solution (2020-2032) (USD Billion)
10.3.2.6.3 Germany Smart Factory Market Estimates and Forecasts, by Industry (2020-2032) (USD Billion)
10.3.2.7 France
10.3.2.7.1 France Smart Factory Market Estimates and Forecasts, by Component (2020-2032) (USD Billion)
10.3.2.7.2 France Smart Factory Market Estimates and Forecasts, by Solution (2020-2032) (USD Billion)
10.3.2.7.3 France Smart Factory Market Estimates and Forecasts, by Industry (2020-2032) (USD Billion)
10.3.2.8 UK
10.3.2.8.1 UK Smart Factory Market Estimates and Forecasts, by Component (2020-2032) (USD Billion)
10.3.2.8.2 UK Smart Factory Market Estimates and Forecasts, by Solution (2020-2032) (USD Billion)
10.3.2.8.3 UK Smart Factory Market Estimates and Forecasts, by Industry (2020-2032) (USD Billion)
10.3.2.9 Italy
10.3.2.9.1 Italy Smart Factory Market Estimates and Forecasts, by Component (2020-2032) (USD Billion)
10.3.2.9.2 Italy Smart Factory Market Estimates and Forecasts, by Solution (2020-2032) (USD Billion)
10.3.2.9.3 Italy Smart Factory Market Estimates and Forecasts, by Industry (2020-2032) (USD Billion)
10.3.2.10 Spain
10.3.2.10.1 Spain Smart Factory Market Estimates and Forecasts, by Component (2020-2032) (USD Billion)
10.3.2.10.2 Spain Smart Factory Market Estimates and Forecasts, by Solution (2020-2032) (USD Billion)
10.3.2.10.3 Spain Smart Factory Market Estimates and Forecasts, by Industry (2020-2032) (USD Billion)
10.3.2.11 Netherlands
10.3.2.11.1 Netherlands Smart Factory Market Estimates and Forecasts, by Component (2020-2032) (USD Billion)
10.3.2.11.2 Netherlands Smart Factory Market Estimates and Forecasts, by Solution (2020-2032) (USD Billion)
10.3.2.11.3 Netherlands Smart Factory Market Estimates and Forecasts, by Industry (2020-2032) (USD Billion)
10.3.2.12 Switzerland
10.3.2.12.1 Switzerland Smart Factory Market Estimates and Forecasts, by Component (2020-2032) (USD Billion)
10.3.2.12.2 Switzerland Smart Factory Market Estimates and Forecasts, by Solution (2020-2032) (USD Billion)
10.3.2.12.3 Switzerland Smart Factory Market Estimates and Forecasts, by Industry (2020-2032) (USD Billion)
10.3.2.13 Austria
10.3.2.13.1 Austria Smart Factory Market Estimates and Forecasts, by Component (2020-2032) (USD Billion)
10.3.2.13.2 Austria Smart Factory Market Estimates and Forecasts, by Solution (2020-2032) (USD Billion)
10.3.2.13.3 Austria Smart Factory Market Estimates and Forecasts, by Industry (2020-2032) (USD Billion)
10.3.2.14 Rest of Western Europe
10.3.2.14.1 Rest of Western Europe Smart Factory Market Estimates and Forecasts, by Component (2020-2032) (USD Billion)
10.3.2.14.2 Rest of Western Europe Smart Factory Market Estimates and Forecasts, by Solution (2020-2032) (USD Billion)
10.3.2.14.3 Rest of Western Europe Smart Factory Market Estimates and Forecasts, by Industry (2020-2032) (USD Billion)
10.4 Asia Pacific
10.4.1 Trends Analysis
10.4.2 Asia Pacific Smart Factory Market Estimates and Forecasts, by Country (2020-2032) (USD Billion)
10.4.3 Asia Pacific Smart Factory Market Estimates and Forecasts, by Component (2020-2032) (USD Billion)
10.4.4 Asia Pacific Smart Factory Market Estimates and Forecasts, by Solution (2020-2032) (USD Billion)
10.4.5 Asia Pacific Smart Factory Market Estimates and Forecasts, by Industry (2020-2032) (USD Billion)
10.4.6 China
10.4.6.1 China Smart Factory Market Estimates and Forecasts, by Component (2020-2032) (USD Billion)
10.4.6.2 China Smart Factory Market Estimates and Forecasts, by Solution (2020-2032) (USD Billion)
10.4.6.3 China Smart Factory Market Estimates and Forecasts, by Industry (2020-2032) (USD Billion)
10.4.7 India
10.4.7.1 India Smart Factory Market Estimates and Forecasts, by Component (2020-2032) (USD Billion)
10.4.7.2 India Smart Factory Market Estimates and Forecasts, by Solution (2020-2032) (USD Billion)
10.4.7.3 India Smart Factory Market Estimates and Forecasts, by Industry (2020-2032) (USD Billion)
10.4.8 Japan
10.4.8.1 Japan Smart Factory Market Estimates and Forecasts, by Component (2020-2032) (USD Billion)
10.4.8.2 Japan Smart Factory Market Estimates and Forecasts, by Solution (2020-2032) (USD Billion)
10.4.8.3 Japan Smart Factory Market Estimates and Forecasts, by Industry (2020-2032) (USD Billion)
10.4.9 South Korea
10.4.9.1 South Korea Smart Factory Market Estimates and Forecasts, by Component (2020-2032) (USD Billion)
10.4.9.2 South Korea Smart Factory Market Estimates and Forecasts, by Solution (2020-2032) (USD Billion)
10.4.9.3 South Korea Smart Factory Market Estimates and Forecasts, by Industry (2020-2032) (USD Billion)
10.4.10 Vietnam
10.4.10.1 Vietnam Smart Factory Market Estimates and Forecasts, by Component (2020-2032) (USD Billion)
10.4.10.2 Vietnam Smart Factory Market Estimates and Forecasts, by Solution (2020-2032) (USD Billion)
10.4.10.3 Vietnam Smart Factory Market Estimates and Forecasts, by Industry (2020-2032) (USD Billion)
10.4.11 Singapore
10.4.11.1 Singapore Smart Factory Market Estimates and Forecasts, by Component (2020-2032) (USD Billion)
10.4.11.2 Singapore Smart Factory Market Estimates and Forecasts, by Solution (2020-2032) (USD Billion)
10.4.11.3 Singapore Smart Factory Market Estimates and Forecasts, by Industry (2020-2032) (USD Billion)
10.4.12 Australia
10.4.12.1 Australia Smart Factory Market Estimates and Forecasts, by Component (2020-2032) (USD Billion)
10.4.12.2 Australia Smart Factory Market Estimates and Forecasts, by Solution (2020-2032) (USD Billion)
10.4.12.3 Australia Smart Factory Market Estimates and Forecasts, by Industry (2020-2032) (USD Billion)
10.4.13 Rest of Asia Pacific
10.4.13.1 Rest of Asia Pacific Smart Factory Market Estimates and Forecasts, by Component (2020-2032) (USD Billion)
10.4.13.2 Rest of Asia Pacific Smart Factory Market Estimates and Forecasts, by Solution (2020-2032) (USD Billion)
10.4.13.3 Rest of Asia Pacific Smart Factory Market Estimates and Forecasts, by Industry (2020-2032) (USD Billion)
10.5 Middle East and Africa
10.5.1 Middle East
10.5.1.1 Trends Analysis
10.5.1.2 Middle East Smart Factory Market Estimates and Forecasts, by Country (2020-2032) (USD Billion)
10.5.1.3 Middle East Smart Factory Market Estimates and Forecasts, by Component (2020-2032) (USD Billion)
10.5.1.4 Middle East Smart Factory Market Estimates and Forecasts, by Solution (2020-2032) (USD Billion)
10.5.1.5 Middle East Smart Factory Market Estimates and Forecasts, by Industry (2020-2032) (USD Billion)
10.5.1.6 UAE
10.5.1.6.1 UAE Smart Factory Market Estimates and Forecasts, by Component (2020-2032) (USD Billion)
10.5.1.6.2 UAE Smart Factory Market Estimates and Forecasts, by Solution (2020-2032) (USD Billion)
10.5.1.6.3 UAE Smart Factory Market Estimates and Forecasts, by Industry (2020-2032) (USD Billion)
10.5.1.7 Egypt
10.5.1.7.1 Egypt Smart Factory Market Estimates and Forecasts, by Component (2020-2032) (USD Billion)
10.5.1.7.2 Egypt Smart Factory Market Estimates and Forecasts, by Solution (2020-2032) (USD Billion)
10.5.1.7.3 Egypt Smart Factory Market Estimates and Forecasts, by Industry (2020-2032) (USD Billion)
10.5.1.8 Saudi Arabia
10.5.1.8.1 Saudi Arabia Smart Factory Market Estimates and Forecasts, by Component (2020-2032) (USD Billion)
10.5.1.8.2 Saudi Arabia Smart Factory Market Estimates and Forecasts, by Solution (2020-2032) (USD Billion)
10.5.1.8.3 Saudi Arabia Smart Factory Market Estimates and Forecasts, by Industry (2020-2032) (USD Billion)
10.5.1.9 Qatar
10.5.1.9.1 Qatar Smart Factory Market Estimates and Forecasts, by Component (2020-2032) (USD Billion)
10.5.1.9.2 Qatar Smart Factory Market Estimates and Forecasts, by Solution (2020-2032) (USD Billion)
10.5.1.9.3 Qatar Smart Factory Market Estimates and Forecasts, by Industry (2020-2032) (USD Billion)
10.5.1.10 Rest of Middle East
10.5.1.10.1 Rest of Middle East Smart Factory Market Estimates and Forecasts, by Component (2020-2032) (USD Billion)
10.5.1.10.2 Rest of Middle East Smart Factory Market Estimates and Forecasts, by Solution (2020-2032) (USD Billion)
10.5.1.10.3 Rest of Middle East Smart Factory Market Estimates and Forecasts, by Industry (2020-2032) (USD Billion)
10.5.2 Africa
10.5.2.1 Trends Analysis
10.5.2.2 Africa Smart Factory Market Estimates and Forecasts, by Country (2020-2032) (USD Billion)
10.5.2.3 Africa Smart Factory Market Estimates and Forecasts, by Component (2020-2032) (USD Billion)
10.5.2.4 Africa Smart Factory Market Estimates and Forecasts, by Solution (2020-2032) (USD Billion)
10.5.2.5 Africa Smart Factory Market Estimates and Forecasts, by Industry (2020-2032) (USD Billion)
10.5.2.6 South Africa
10.5.2.6.1 South Africa Smart Factory Market Estimates and Forecasts, by Component (2020-2032) (USD Billion)
10.5.2.6.2 South Africa Smart Factory Market Estimates and Forecasts, by Solution (2020-2032) (USD Billion)
10.5.2.6.3 South Africa Smart Factory Market Estimates and Forecasts, by Industry (2020-2032) (USD Billion)
10.5.2.7 Nigeria
10.5.2.7.1 Nigeria Smart Factory Market Estimates and Forecasts, by Component (2020-2032) (USD Billion)
10.5.2.7.2 Nigeria Smart Factory Market Estimates and Forecasts, by Solution (2020-2032) (USD Billion)
10.5.2.7.3 Nigeria Smart Factory Market Estimates and Forecasts, by Industry (2020-2032) (USD Billion)
10.5.2.8 Rest of Africa
10.5.2.8.1 Rest of Africa Smart Factory Market Estimates and Forecasts, by Component (2020-2032) (USD Billion)
10.5.2.8.2 Rest of Africa Smart Factory Market Estimates and Forecasts, by Solution (2020-2032) (USD Billion)
10.5.2.8.3 Rest of Africa Smart Factory Market Estimates and Forecasts, by Industry (2020-2032) (USD Billion)
10.6 Latin America
10.6.1 Trends Analysis
10.6.2 Latin America Smart Factory Market Estimates and Forecasts, by Country (2020-2032) (USD Billion)
10.6.3 Latin America Smart Factory Market Estimates and Forecasts, by Component (2020-2032) (USD Billion)
10.6.4 Latin America Smart Factory Market Estimates and Forecasts, by Solution (2020-2032) (USD Billion)
10.6.5 Latin America Smart Factory Market Estimates and Forecasts, by Industry (2020-2032) (USD Billion)
10.6.6 Brazil
10.6.6.1 Brazil Smart Factory Market Estimates and Forecasts, by Component (2020-2032) (USD Billion)
10.6.6.2 Brazil Smart Factory Market Estimates and Forecasts, by Solution (2020-2032) (USD Billion)
10.6.6.3 Brazil Smart Factory Market Estimates and Forecasts, by Industry (2020-2032) (USD Billion)
10.6.7 Argentina
10.6.7.1 Argentina Smart Factory Market Estimates and Forecasts, by Component (2020-2032) (USD Billion)
10.6.7.2 Argentina Smart Factory Market Estimates and Forecasts, by Solution (2020-2032) (USD Billion)
10.6.7.3 Argentina Smart Factory Market Estimates and Forecasts, by Industry (2020-2032) (USD Billion)
10.6.8 Colombia
10.6.8.1 Colombia Smart Factory Market Estimates and Forecasts, by Component (2020-2032) (USD Billion)
10.6.8.2 Colombia Smart Factory Market Estimates and Forecasts, by Solution (2020-2032) (USD Billion)
10.6.8.3 Colombia Smart Factory Market Estimates and Forecasts, by Industry (2020-2032) (USD Billion)
10.6.9 Rest of Latin America
10.6.9.1 Rest of Latin America Smart Factory Market Estimates and Forecasts, by Component (2020-2032) (USD Billion)
10.6.9.2 Rest of Latin America Smart Factory Market Estimates and Forecasts, by Solution (2020-2032) (USD Billion)
10.6.9.3 Rest of Latin America Smart Factory Market Estimates and Forecasts, by Industry (2020-2032) (USD Billion)
11. Company Profiles
11.1 ABB Limited
11.1.1 Company Overview
11.1.2 Financial
11.1.3 Products/ Services Offered
11.1.4 SWOT Analysis
11.2 Emerson Electric Co.
11.2.1 Company Overview
11.2.2 Financial
11.2.3 Products/ Services Offered
11.2.4 SWOT Analysis
11.3 Fanuc Corporation
11.3.1 Company Overview
11.3.2 Financial
11.3.3 Products/ Services Offered
11.3.4 SWOT Analysis
11.4 General Electric Company
11.4.1 Company Overview
11.4.2 Financial
11.4.3 Products/ Services Offered
11.4.4 SWOT Analysis
11.5 Honeywell International
11.5.1 Company Overview
11.5.2 Financial
11.5.3 Products/ Services Offered
11.5.4 SWOT Analysis
11.6 Johnson Control International Plc
11.6.1 Company Overview
11.6.2 Financial
11.6.3 Products/ Services Offered
11.6.4 SWOT Analysis
11.7 Mitsubishi Electric Corporation
11.7.1 Company Overview
11.7.2 Financial
11.7.3 Products/ Services Offered
11.7.4 SWOT Analysis
11.8 Rockwell Automation
11.8.1 Company Overview
11.8.2 Financial
11.8.3 Products/ Services Offered
11.8.4 SWOT Analysis
11.9 Schneider Electric
11.9.1 Company Overview
11.9.2 Financial
11.9.3 Products/ Services Offered
11.9.4 SWOT Analysis
11.10 Yokogawa Electric
11.10.1 Company Overview
11.10.2 Financial
11.10.3 Products/ Services Offered
11.10.4 SWOT Analysis
12. Use Cases and Best Practices
13. Conclusion
An accurate research report requires proper strategizing as well as implementation. There are multiple factors involved in the completion of good and accurate research report and selecting the best methodology to compete the research is the toughest part. Since the research reports we provide play a crucial role in any company’s decision-making process, therefore we at SNS Insider always believe that we should choose the best method which gives us results closer to reality. This allows us to reach at a stage wherein we can provide our clients best and accurate investment to output ratio.
Each report that we prepare takes a timeframe of 350-400 business hours for production. Starting from the selection of titles through a couple of in-depth brain storming session to the final QC process before uploading our titles on our website we dedicate around 350 working hours. The titles are selected based on their current market cap and the foreseen CAGR and growth.
The 5 steps process:
Step 1: Secondary Research:
Secondary Research or Desk Research is as the name suggests is a research process wherein, we collect data through the readily available information. In this process we use various paid and unpaid databases which our team has access to and gather data through the same. This includes examining of listed companies’ annual reports, Journals, SEC filling etc. Apart from this our team has access to various associations across the globe across different industries. Lastly, we have exchange relationships with various university as well as individual libraries.
Step 2: Primary Research
When we talk about primary research, it is a type of study in which the researchers collect relevant data samples directly, rather than relying on previously collected data. This type of research is focused on gaining content specific facts that can be sued to solve specific problems. Since the collected data is fresh and first hand therefore it makes the study more accurate and genuine.
We at SNS Insider have divided Primary Research into 2 parts.
Part 1 wherein we interview the KOLs of major players as well as the upcoming ones across various geographic regions. This allows us to have their view over the market scenario and acts as an important tool to come closer to the accurate market numbers. As many as 45 paid and unpaid primary interviews are taken from both the demand and supply side of the industry to make sure we land at an accurate judgement and analysis of the market.
This step involves the triangulation of data wherein our team analyses the interview transcripts, online survey responses and observation of on filed participants. The below mentioned chart should give a better understanding of the part 1 of the primary interview.
Part 2: In this part of primary research the data collected via secondary research and the part 1 of the primary research is validated with the interviews from individual consultants and subject matter experts.
Consultants are those set of people who have at least 12 years of experience and expertise within the industry whereas Subject Matter Experts are those with at least 15 years of experience behind their back within the same space. The data with the help of two main processes i.e., FGDs (Focused Group Discussions) and IDs (Individual Discussions). This gives us a 3rd party nonbiased primary view of the market scenario making it a more dependable one while collation of the data pointers.
Step 3: Data Bank Validation
Once all the information is collected via primary and secondary sources, we run that information for data validation. At our intelligence centre our research heads track a lot of information related to the market which includes the quarterly reports, the daily stock prices, and other relevant information. Our data bank server gets updated every fortnight and that is how the information which we collected using our primary and secondary information is revalidated in real time.
Step 4: QA/QC Process
After all the data collection and validation our team does a final level of quality check and quality assurance to get rid of any unwanted or undesired mistakes. This might include but not limited to getting rid of the any typos, duplication of numbers or missing of any important information. The people involved in this process include technical content writers, research heads and graphics people. Once this process is completed the title gets uploader on our platform for our clients to read it.
Step 5: Final QC/QA Process:
This is the last process and comes when the client has ordered the study. In this process a final QA/QC is done before the study is emailed to the client. Since we believe in giving our clients a good experience of our research studies, therefore, to make sure that we do not lack at our end in any way humanly possible we do a final round of quality check and then dispatch the study to the client.
Key Market Segmentation:
By Component
By Solution
By Industry
Request for Segment Customization as per your Business Requirement: Segment Customization Request
REGIONAL COVERAGE:
North America
Europe
Asia Pacific
Middle East & Africa
Latin America
Request for Country Level Research Report: Country Level Customization Request
Available Customization
With the given market data, SNS Insider offers customization as per the company’s specific needs. The following customization options are available for the report:
The Renting & Leasing Test and Measurement Equipment Market develop at a CAGR of 4.57% over the forecast period 2024-2031.
The Process Analyzer Market size was estimated at USD 6.90 billion in 2023 and is expected to reach USD 11.90 billion by 2032 at a CAGR of 5.67 % during the forecast period of 2024-2032.
The Mining Drill Bits Market Size was valued at USD 1.76 Bn in 2023 and is expected to reach USD 2.86 Bn by 2032 with a growing CAGR of 5.56 % over the forecast period 2024-2032.
The Air Traffic Control Equipment Market was valued at USD 9.56 billion in 2023, and it is expected to reach USD 17.73 billion by 2032, registering a CAGR of 7.10% from 2024 to 2032.
The Industrial Robotics Market Size was valued at USD 17.3 billion in 2023 and is expected to reach USD 47.64 billion by 2032 and grow at a CAGR of 13.5% over the forecast period 2024-2032.
The Power Tools Market size was valued at USD 38.42 Billion in 2023 and is expected to reach USD 50.93 Billion by 2032 and grow at a CAGR of 2.86 % over the forecast period 2024-2032.
Hi! Click one of our member below to chat on Phone