Oil Free Air Compressor Market Report Scope & Overview:
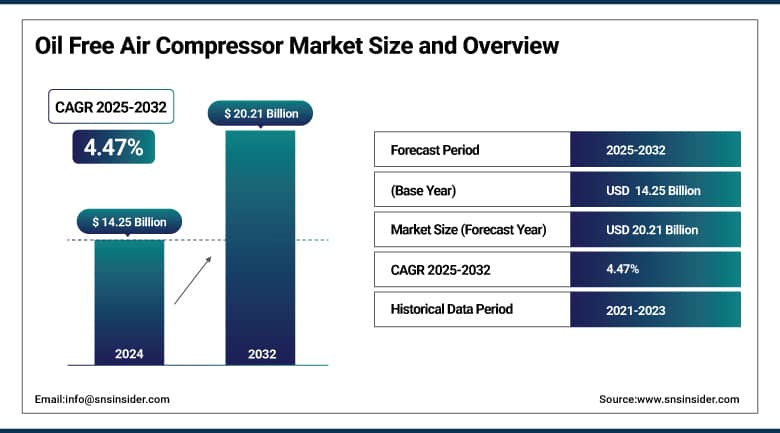
The Oil Free Air Compressor Market size was valued at USD 14.25 billion in 2024 and is expected to reach USD 20.21 billion by 2032, growing at a CAGR of 4.47% over the forecast period of 2025-2032.
The oil-free air compressor market is growing rapidly, as it is essential in industries where the need for contaminant-free air is sacrosanct, such as pharmaceuticals, food & beverage, electronics, and healthcare. These compressors work in the compression chamber in a non-oiled form, finding no possibility of getting the air contaminated and matching the most stringent safety and quality standards. One of the biggest subsegments, the oil-free screw compressor market, is increasingly adopted because of its energy-efficient, noiseless, and continuous industrial applications. One of the most important trends being witnessed in the global market is the transition of end-users to low-maintenance compressor systems that help reduce downtime, lower operational costs, and enhance reliability.
The industrial oil-free compressor industry is witnessing a rapid evolution in terms of compactness, efficiency, and greenness due to technological developments in smart control systems, energy-efficient motors, and oil-free compression technologies. Moreover, the increasing focus on sustainability, increasing emission & energy regulations is another factor that functions in accelerating the oil free air compressor market growth. As a result, manufacturers are responding with application-based sustainability, durability, energy efficiency/savings, and simplified maintenance solutions. Innovation and automation will further pave the path towards efficiency, which will continue expanding the market gradually, while changing oil free air compressor market trends are expected to reshape the landscape on the basis of end-use sectors.
In November 2024: CompAir launched its DX90–160 (RS) oil-free rotary screw air compressors with up to 14% energy efficiency and 8% more airflow. These Class Zero compressors (90–160 kW) offer fixed and variable-speed models with advanced UltraCoat protection, IE5 hybrid motors, and smart controls like Delcos i10 and iConn 4.0. Designed for easy maintenance and high-ambient conditions, they deliver reliable, low-maintenance performance for industrial use.
To Get More Information On Oil Free Air Compressor Market - Request Free Sample Report
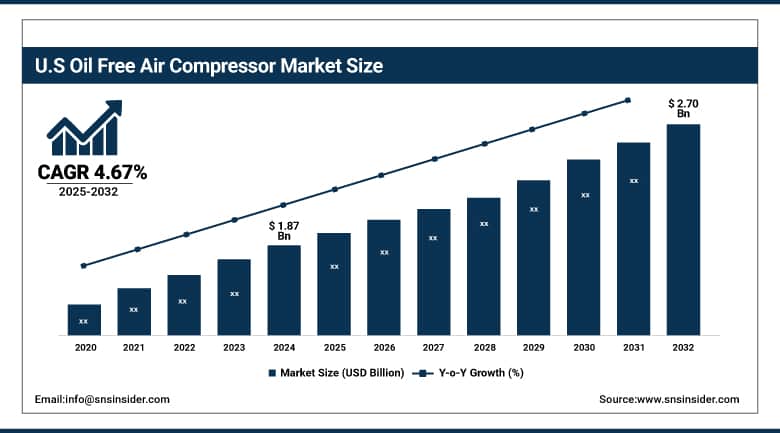
The U.S. Oil-Free Air Compressor Market is projected to grow from USD 1.87 billion in 2024 to USD 2.70 billion by 2032, with a CAGR of 4.67%. The growth of this segment can be attributed to the rising demand for contamination-free compressed air and growing environmental regulations. Growing advancements in energy-efficient technology and minimal upkeep further enhance market growth.
Oil Free Air Compressor Market Dynamics
Drivers
-
Industry 4.0 and IoT innovations are boosting oil-free air compressors' efficiency, reliability, and sustainability through smart monitoring and predictive maintenance.
Improvements in oil-free air compressors rest upon advancements in technology and integration with Industry 4.0. Internet of Things (IoT) sensors enable nonstop real-time monitoring of key elements like pressure, temperature, and vibration. Such data underpins predictive maintenance, allowing for the early detection of potential issues and leading to decreased unscheduled downtime. Aquant, for instance, uses AI-driven algorithms that analyze sensor data to identify problems before failure. This method optimizes maintenance schedules and reduces expenditure. Additionally, Compressor manufacturers with Variable Speed Drive (VSD) technology that adapts operating speed to meet actual demand at any given time track the speed percentage of saturation/actual requirement, thus saving significant power and reducing operating cost. Together, these transitions improve system reliability and make strides towards sustainable energy by lowering both use and emissions, a double win for contemporary environmental objectives and industrial productivity.
In May 2025, AI and robotics are revolutionizing predictive maintenance in manufacturing. Companies like Aquant use AI to analyze sensor data, helping clients such as Coca-Cola and Siemens Energy reduce downtime and optimize maintenance. Gecko Robotics employs ultrasonic sensor-equipped robots to inspect infrastructure in real time. Despite challenges like high costs and integration issues, AI-driven predictive maintenance is rapidly gaining adoption across industries.
Restraint
-
Oil-free air compressors have higher upfront costs than oil-lubricated ones, creating financial challenges for SMEs but delivering long-term efficiency and maintenance savings.
Oil-free air compressors need more initial capital than oil-lubricated air compressors. This price difference can be attributed to oil-free compressors have been built to eliminate oil contamination from compressed air systems, involving more advanced technology and materials. Industrial oil-free compressors, for example, can cost anywhere from USD 2,000 to more than USD 50,000, based on their horsepower and use. While oil-lubricated compressors usually have lower initial costs, they might require oil filtration and maintenance costs in the long run. Oil-free compressors generally cost more to begin with, which makes them a somewhat costly option for the average small- to medium-sized enterprise (SME) operator. Nonetheless, they can be more expensive in the short term, although having fewer maintenance and energy costs, so they tend to be the best choice at the industrial level where clean compressed air is needed.
Oil Free Air Compressor Market Segmentation Analysis
By Product
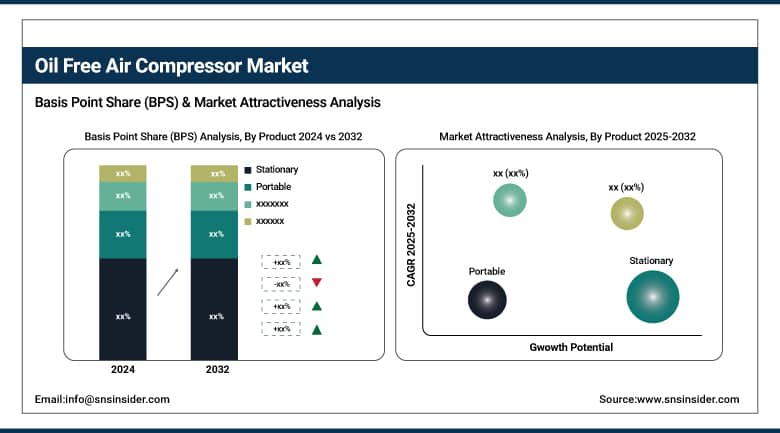
The stationary segment dominated the market and accounted for 58% of the oil free air compressor market share. Due to their steady and continuous performance, these compressors have been broadly adapted in industrial and manufacturing areas, making them a perfect asset for fixed installations. Structures are tougher and they have a greater capacity than portable items, which is why they are recommended in areas where a continuous air quality is critical. Such dominance can be attributed to its performance in high-demand applications that require reliable, oil-free compressed air, critical for processes such as pharmaceutical, food and beverage, and electronics manufacturing.
Portable oil-free air compressors are the fastest-growing segment in the market. They are growing faster because more industries require convenience, accessibility, and flexibility in terms of mobility. Portable units remain very popular in areas like construction, automotive repair, and emergency services, which require compressed air on-site. Due to advanced technologies, these are more efficient, compact, battery-operated, and can serve remote or off-grid locations. The high penetration of small and medium-scale enterprises, along with the increasing demand for servo mounts, is driving the adoption of portable oil-free compressors in the global market.
By Technology
Rotary or screw segments dominated with a market share of over 48% share in 2024. With characteristics like energy efficiency, reliability, and low maintenance in comparison with a reciprocating model, these are established compressors. Compared to other types of compressors, rotary screw compressors are less pulsatile and less vibratory, producing relatively consistent continuous airflow, critical for sensitive applications including electronics and pharma. Thus, the capacity to handle high volumes of air and work continuously makes a rotary screw air compressor the first choice for industries, where a consistent and high volume of compressed air supply is required.
Centrifugal oil-free compressors are the fastest-growing technology segment. Their Usability for High-Capacity and High-Pressure Industrial Applications is expected to Drive Growth in the Coming Years. With the smallest risk of contamination, these compressors utilize high-speed rotating impellers to provide compressed air. Low vibration, low noise, and high-efficiency operation are their benefits, driving their use in sectors such as semiconductor manufacturing and power generation. This exponential growth of centrifugal compressors in the market is due to rapid industrial growth and demand for eco-friendly and oil-free air compression solutions.
By Power Rating
The 15-55 kW power rating segment dominated with a market share of over 42% in 2024. This range of power is perfect for addressing mid-range applications that need to balance between high performance and power efficiency. The compressor in this power range is often required for food processing, pharmaceuticals, electronics, etc., industries to meet the production demand without burning a hole in the pocket for the energy. The segment is further expected to hold its strongest contribution towards this application, owing to the multi-purpose and accommodating capacity of these compressors for different commercial and industrial applications, making it a multi-market fit on a global scale.
Compressors with power ratings above 160 kW are the fastest-growing segment, due to increased capacity and larger scale of air compression applications in heavy industries. This high-performance unit type serves automotive manufacturing plants, petrochemical plants, and large semiconductor fabs needing continuous, high-volume oil-free air. This growth is primarily driven by advancements in compressor design and efficiency, combined with the growing need to replace aging infrastructure with energy saving and environmentally responsible systems that can comply with ever-increasing environmental regulations.
By Application
The automotive segment dominated the oil-free air compressor market with a 32% share in 2024. It is due to the prevalent application of oil-free compressed air in painting, assembly lines, and pneumatic tool operation in the automotive manufacturing plant. For high-quality surface finishes and operational reliability, contamination-free air is critical. Oil-free compressors guarantee this. This is followed by automotive applications based on the continual growth of the automotive industry, as well as rising acceptance for automated and electric vehicles, which keeps the need for oil-free air compressors for automotive applications.
The semiconductor and electronics segment is the fastest-growing application area in the oil-free air compressor market. The growth of this sector is attributed to its strict air purity standards, as even a tiny amount of oil contamination can harm sensitive devices and lower yield. Worldwide demand for consumer electronics, IoT devices, and 5G technology is driving growth in global semiconductor manufacturing capacity, increasing the need for high-quality, oil-free compressed air. Moreover, the rapid growth of this segment is also attributed to the advancements in technology and the increase in regulations regarding the ambient air quality.
Oil Free Air Compressor Market Regional Outlook
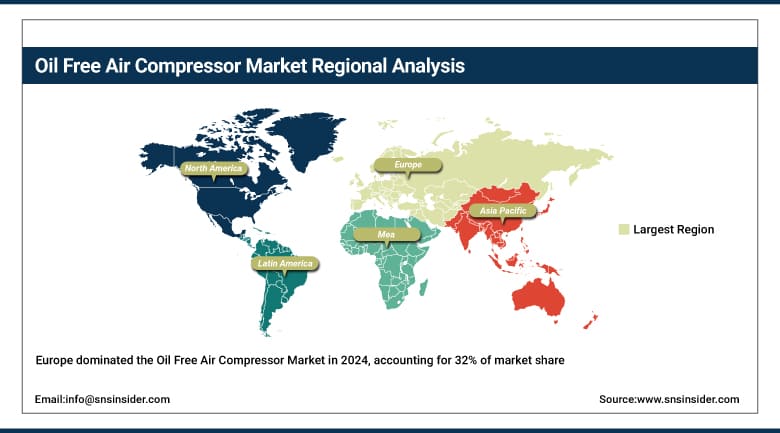
Europe held a dominant position in the oil-free air compressor market, accounting for around 32% of the market share in 2024. The region has a strong industrial base and stringent environmental regulations, which drive the demand for clean and contaminant-free compressed air, thereby pushing for leadership in this field by a group of companies serving the pharmaceutical, food & beverage, and electronics sectors. This, in turn, has driven European manufacturers to invest heavily in advanced oil-free compressor technologies to satisfy the standards, leading to further demand and market growth. The presence of a few key players in the market with established compressed air systems infrastructure also reinforces the growth of this market segment in Europe.
Get Customized Report as Per Your Business Requirement - Enquiry Now
Germany leads the European oil-free air compressor market due to its strong industrial base, especially in the automotive sector. Oil-free compressors have gained widespread traction, helping manufacturers to pass stringent environmental regulations and government energy efficiency initiatives whilst ensuring the air quality in the production process remains unpolluted.
The Asia-Pacific region is recognized as the fastest-growing market for oil-free air compressors. The main growth drivers are swift industrialization, growing manufacturing activities, and increasing investments in infrastructure development. This trend is based on the adoption of oil-free compressors in China, India, and Japan to align with quality standards across various applications of healthcare, food processing, and semiconductor industries. Moreover, stringent emission norms and rising environmental concerns are also contributing to the oil-free technology transition. Asia-Pacific is the new hot spot for the future, owing to the competitive cost of manufacturing, coupled with the advancing technological edge, to expand the markets at a rapid pace.
North America holds a significant share in the oil-free air compressor market due to its advanced industrial landscape and stringent regulatory framework. While the U.S. and Canada also demand energy-efficient and environmentally sound technologies, the area is encouraging the adoption of alternative oil-free compressors. Pharmaceuticals, healthcare, electronics, and automotive are also some of the key industries that need high-purity compressed air, which is provided by oil-free compressors. The application of technological innovations and continuous activities in the region augments product performance and reliability, thereby ensuring steady demand for the market. North America remains a significant market, backed by a strong industrial infrastructure and the presence of leading manufacturers.
Key Players:
-
ELGi
-
Hanwha Power Systems CO., LTD.
-
CIASONS Industrial Inc.
-
FS Elliot Co.
-
Aerzen
-
ANEST IWATA Corporation
-
Sullivan-Palatek Inc.
-
Kaeser Kompressoren SE.
Recent Development
-
In March 2025, Atlas Copco reinforced its leadership in the oil-free air compressor market by promoting its Class Zero compressors as the global benchmark for air purity. Certified under ISO 8573-1 Class 0, these compressors eliminate any risk of oil contamination, making them ideal for sensitive industries. They also reduce energy use, maintenance, and environmental impact.
-
In May 2024, Atlas Copco launched its next-gen ZT 15–22 oil-free rotary tooth compressors with 10% better energy efficiency and 5% more airflow. Featuring advanced VSD technology and Class Zero air purity, they're ideal for industries needing contaminant-free air. The design includes compact build, integrated dryers, and extended service life for lower maintenance and emissions.
| Report Attributes | Details |
|---|---|
| Market Size in 2024 | USD 14.25 Billion |
| Market Size by 2032 | USD 20.21 Billion |
| CAGR | CAGR of 4.47% From 2025 to 2032 |
| Base Year | 2024 |
| Forecast Period | 2025-2032 |
| Historical Data | 2021-2023 |
| Report Scope & Coverage | Market Size, Segments Analysis, Competitive Landscape, Regional Analysis, DROC & SWOT Analysis, Forecast Outlook |
| Key Segments | • By Product (Stationary, Portable) • By Technology (Reciprocating, Rotary/Screw, Centrifugal) • By Power Rating (Below 15kW, 15–55kW, 55–160kW, Above 160kW) • By Application (Food & Beverage, Pharmaceutical, Semiconductor & Electronics, Chemical, Oil & Gas, Automotive, Others) |
| Regional Analysis/Coverage | North America (US, Canada, Mexico), Europe (Germany, France, UK, Italy, Spain, Poland, Turkey, Rest of Europe), Asia Pacific (China, India, Japan, South Korea, Singapore, Australia, Rest of Asia Pacific), Middle East & Africa (UAE, Saudi Arabia, Qatar, South Africa, Rest of Middle East & Africa), Latin America (Brazil, Argentina, Rest of Latin America) |
| Company Profiles | Ingersoll Rand, ELGi, Hanwha Power Systems CO., LTD., CIASONS Industrial Inc., FS Elliot Co., LLC, Atlas Copco AB, Aerzen, ANEST IWATA Corporation, Sullivan-Palatek Inc., Kaeser Kompressoren SE. |
Frequently Asked Questions
Ans: The “stationary” segment dominated the Oil Free Air Compressor market
Ans: The Oil Free Air Compressor market was USD 14.25 billion in 2024 and is expected to reach USD 20.21 billion by 2032.
Ans: The Oil Free Air Compressor market is expected to grow at a CAGR of 4.47% from 2025-2032.
Ans: Industry 4.0 and IoT innovations are boosting oil-free air compressors' efficiency, reliability, and sustainability through smart monitoring and predictive maintenance.
Ans: The Europe region dominated the Oil Free Air Compressor market in 2024.
Get in Touch
