Smart Pole Market Size & Growth:
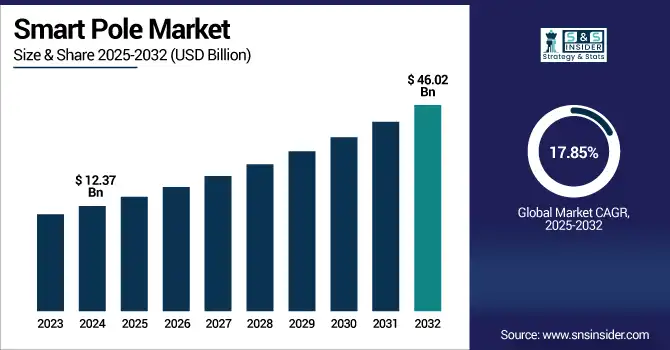
The Smart Pole Market size was valued at USD 12.37 Billion in 2024 and is projected to reach USD 46.02 Billion by 2032, growing at a CAGR of 17.85% during 2025-2032.
The Smart Pole market is experiencing strong growth, driven by increasing investments in smart city infrastructure and the rising need for intelligent urban solutions. Smart poles integrate multiple technologies such as energy-efficient LED lighting, surveillance cameras, environmental sensors, public Wi-Fi, 5G connectivity, and EV charging capabilities. These multifunctional systems help cities enhance public safety, optimize traffic flow, improve energy management, and support real-time data collection. Demand is particularly high in densely populated urban areas seeking scalable and sustainable infrastructure. Technological advancements, along with government-led urban modernization programs and widespread IoT adoption, are further accelerating market expansion. As cities worldwide move toward digital transformation, smart poles are becoming essential components of next-generation urban planning.
To Get more information on Smart Pole Market - Request Free Sample Report
Chunghwa Telecom has announced a smart pole solutions designed for integrated smart city sectors in Southeast Asian markets that combines lighting, surveillance and data-driven services within the same pole.
The U.S Smart Pole Market size was valued at USD 2.21 Billion in 2024 and is projected to reach USD 8.63 Billion by 2032, growing at a CAGR of 18.54% during 2025-2032. This Smart Pole Market growth driven by the increased number of smart city deployments, modernizing infrastructure, and the ever-expanding use of technologies, such as 5G, IoT, and AI, in cities. Smart poles are multifunctional poles that integrate lighting, surveillance, communication, and environmental monitoring capabilities, which provide a solution to cities for energy savings, safety, and connectivity. Smart poles are set to become an important pillar of the future of U.S., driven by government initiatives, sustainability mandates, and rising demand for real-time urban data, increasing the adoption rate. urban development.
The Smart Pole market trends include the rapid integration of 5G infrastructure, increasing adoption of AI-powered surveillance systems, and growing deployment of EV charging-enabled poles. Cities are prioritizing energy-efficient LED lighting and real-time data analytics for traffic, pollution, and pedestrian monitoring. Modular and upgradable pole designs are gaining traction, allowing for scalable smart city expansion. Public-private partnerships are accelerating installations, while demand for cybersecurity in connected infrastructure is rising. The use of solar-powered smart poles is also expanding to support sustainability goals. These trends collectively reflect a shift toward connected, adaptive, and eco-friendly urban ecosystems.
Smart Pole Market Dynamics:
Drivers:
-
Digital Exclusion Drives Smart Pole Adoption in Rural Infrastructure
The growing digital divide in rural and underserved areas is a major catalyst for smart pole deployment. Millions of homes and businesses still lack dependable high-speed internet, limiting access to vital services like remote education, telehealth, and digital workspaces. In response, governments are initiating large-scale broadband equity programs and offering financial support through grants and partnerships. Smart poles—equipped with Wi-Fi, broadband, and smart sensors—are emerging as efficient, scalable solutions to deliver connectivity across dispersed regions. This push for digital inclusion is accelerating market demand, positioning smart poles as essential infrastructure for modernizing communication networks and ensuring nationwide access to digital services.
Kansas Smart Pole Installs100-Mile Radius of Free Internet | Kansas – The Last Refuge The initiative will aid underserved communities via telehealth, education, and digital equity, supported by a USD450M state grant program.
Restraints:
-
High Deployment Costs and System Complexity Hinder Smart Pole Scalability
Despite strong demand, the smart pole market faces significant restraints due to high capital investment requirements and complex integration needs. The deployment of smart poles involves costly hardware, advanced connectivity modules, and specialized installation, which can strain municipal budgets especially in smaller cities or rural regions. Additionally, integrating multiple systems like lighting, surveillance, 5G, and EV charging into a unified platform demands technical expertise and coordination among diverse vendors. This complexity often leads to longer implementation timelines and higher maintenance costs. As a result, these financial and technical barriers slow down market penetration and limit the scalability of smart pole projects across broader geographies.
Opportunities:
-
Smart Urbanization Unlocks New Opportunities in the Smart Pole Market
The smart pole market is experiencing strong growth opportunities as cities worldwide accelerate their shift toward smart urban infrastructure. Driven by the need for energy-efficient lighting, real-time surveillance, environmental monitoring, and public connectivity, smart poles are emerging as multifunctional assets that support urban resilience and digital transformation. The convergence of 5G, IoT, and edge computing is further enhancing the capabilities of smart poles, enabling them to act as critical nodes in intelligent transportation, public safety, and data-driven city management. As governments and municipalities invest in smart city projects, demand for scalable, future-ready pole infrastructure is rising, creating expansive opportunities for solution providers and integrators in the global smart pole market.
Expansion of autonomous-driving zones and infrastructure in cities, including Beijing, Shanghai and Shenyang, is helping to boost the growth of robotaxis in China. Chinese companies are making strides towards global dominance in autonomous mobility with a market size greater than USD 100 billion.
Challenges:
-
Integration Complexity and Urban Constraints Challenge Smart Pole Deployment
The smart pole market faces critical challenges stemming from integration complexity, regulatory hurdles, and urban deployment limitations. The coordination required for combining diverse technologies such as lighting, surveillance, 5G, EV charging, and sensors into a single pole results in high interoperability, leading multiple vendors to experience technical delays and cost overruns. Due to aesthetic issues, grey infrastructure, and high density in the urban areas, the installation are not as easy. Also, permitting processes and specific regulations by city can delay deployment time. Such impediments are exacerbated through cybersecurity threats to connected infrastructure. However, these challenges can create major roadblocks to scaling projects and accelerating adoption in cities all over the world despite a strong demand for smart urban solutions.
Smart Pole Market Segmentation Analysis:
By Component
In 2024, the hardware segment held the largest share of the personal Smart Pole market at approximately 60%, owing to the high demand for hardware infrastructure including smart lighting units, sensors, cameras, and pole-mounted devices. Smart city use cases are a strong driver of this dominance, as cities are focused on fundamental building blocks to support connected services in early phases of deployment. Hardware usage is further driven by investments in long-lasting and weather-proof materials and the use of integrated platforms. Moreover, the deployment of 5G and IoT networks has created a growing demand for smart poles that can accommodate high-tech devices. The hardware segment remains the backbone of scalable smart pole deployments as cities move forward with digital transformation and urban modernization efforts.
The services segment is projected to witness the fastest growth in the personal Smart Pole market during 2025–2032, with a robust CAGR of 19.23%. The accelerated expansion is driving demand for comprehensive installation, system integration, remote monitoring & maintenance, data analytics & cyber security services. In this context, smart poles enable cities to operate more efficiently and remain connected. Subsequently driving demand for service providers that will ensure optimal deployment and optimum performance and longevity of smart poles. Instead, the move to service-based models—subscription-based management, predictive maintenance—provides municipalities with affordable and scalable solutions. This trend reflects the shift from capital selling to selling years of operational excellence and lifecycle value.
By Hardware
In 2024, the Controller segment held the largest share of the personal Smart Pole market at approximately 37%, driven by its critical role in managing and automating smart pole functions. Controllers serve as the central processing units, coordinating data from sensors, cameras, lighting systems, and communication modules. The growing need for real-time decision-making, adaptive lighting control, and efficient energy usage has significantly boosted demand for advanced controllers. Integration with AI, edge computing, and IoT platforms has further enhanced controller functionality, enabling smart poles to operate autonomously and respond to changing environmental or traffic conditions. As smart cities scale, controllers remain essential for ensuring seamless, intelligent, and connected urban infrastructure operations.
The Communication Device segment is projected to witness the fastest growth in the personal Smart Pole market during 2025–2032, with a robust CAGR of 27.42%. The demand is fueled by rising demand for real-time data transmission, remote monitoring as well as seamless connectivity amongst smart city infrastructure. With smart poles evolving into a versatile communication node, 5G modules, Wi-Fi routers, and V2X (vehicle-to-everything) interfaces are being quickly adopted as components. Segment growth is also being driven by the delivery of next-generation wireless networks and the need for constant connectivity in applications such as surveillance, public Wi-Fi and traffic management. Communication devices are essential for enabling dynamic urban ecosystems with data-driven urban solutions and integrated smart pole networks.
By Installation Type
In 2024, the Retrofit Installation segment held the largest share of the personal Smart Pole market at approximately 60%, driven by the widespread upgrade of existing streetlight infrastructure. Cities are increasingly opting to retrofit conventional poles with smart components—such as LED lighting, sensors, and communication modules—to reduce costs and accelerate deployment timelines. This approach allows municipalities to modernize urban infrastructure without full replacement, making it both cost-effective and sustainable. Retrofitting also supports quick integration with smart city platforms, enabling real-time monitoring, adaptive lighting, and enhanced public safety. As governments prioritize efficient urban upgrades, the retrofit model continues to dominate due to its scalability and lower capital investment requirements.
The New Installation segment is projected to witness the fastest growth in the personal Smart Pole market during 2025–2032, with a robust CAGR of 18.90%, This is driven by increased smart city projects and urban expansions, allowing for the deployment of fully integrated, advanced smart poles featuring 5G, AI sensors, and renewable energy, enabling future-ready and scalable urban infrastructure solutions.
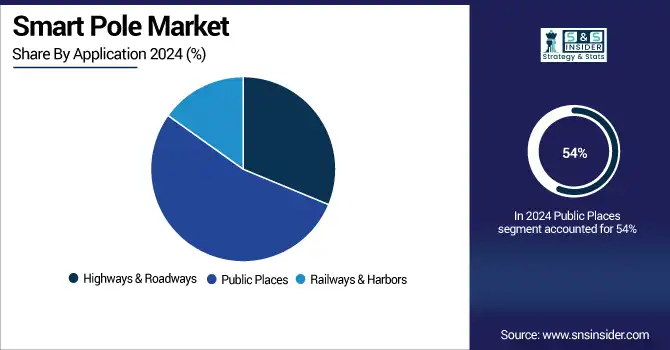
By Application
In 2024, the Public Places segment held the largest share of the personal Smart Pole market at approximately 54%, as it can be seen to be extensively used and deployed in parks, plazas, and pedestrian areas. Such areas are served by smart poles that increase safety through video surveillance, energy-efficient lit-up, and public Wi-Fi internet access. This is creating demand for integrated smart pole solutions in these locations due to increased urban foot traffic and government initiatives to modernize public spaces.
The Highways & Roadways segment is projected to witness the fastest growth in the personal Smart Pole market during 2025–2032, with a robust CAGR of 21.02%, owing to the rising investments in smart transportation infrastructure to enhance the road safety, traffic management, and connected infrastructure. Highway smart poles: Highway smart poles can make real time monitoring, adaptive lighting and communication between vehicles and infrastructure possible to support autonomous driving and reduce accidents. The segment is gaining traction due to the increasing initiatives taken by governments for upgrading road networks using IoT-enabled solutions.
Smart Pole Market Regional Outlook:
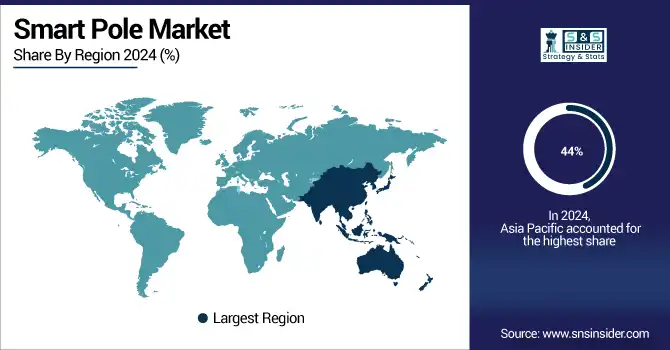
In 2024 Asia-Pacific dominated the Smart Pole market and accounted for 44% of revenue share. This leadership is driven by rapid urbanization, extensive smart city initiatives, and strong government support for digital infrastructure across countries like China, India, Japan, and South Korea. The region’s growing demand for energy-efficient lighting, advanced surveillance, and 5G connectivity solutions is accelerating smart pole adoption, making it a key growth hub globally.
North America is expected to witness the fastest growth in the Smart Pole market over 2025-2032, with a projected CAGR of 19.69%, owing to growing investments to modernize smart cities, infrastructure development, and implementation of 5G nodes across the region. The adoption of the global smart pole market is accelerating in cities across the U.S. and Canada due to strong government support for energy-efficient and integrated smart city infrastructure, domestic demand for energy-efficient lighting, and favorable government regulations to increase both IoT technologies and AI technologies in urban management. Further, increasing focus on sustainability and safety of public is also stimulating growth of the market in the region.
In 2024, Europe emerged as a promising region in the Smart Pole market, owing to the robust government initiatives towards Smart City and sustainability in 2024. Massive investments are being made in the region in energy-efficient LED lighting, IoT, and 5G infrastructure to improve the level of urban connectivity and to lower carbon emissions. Market growth is also supported by the rising adoption of advanced surveillance and traffic management systems. Expansion of Smart Pole in Europe Driven by the Regulatory Environment and Green Technology-Focused Approach.
LATAM and MEA are experiencing steady growth in the Smart Pole market, due to rapid urbanization, increasing government funding for smart city infrastructure, and growing demand to enhance urban public safety and connectivity. These areas are boasting the latest in energy-efficient lighting and the smartened technologies enabled by IoT to revamp their cities. Corporate and infrastructure enterprises across regions will also play a decisive role in the development of the market – smart poles are forming a basis in the evolution of digital transformation programs heavily driven by expanding 4G/5G footprints & public-private partnerships.
Get Customized Report as per Your Business Requirement - Enquiry Now
Smart Pole Companies are:
The Key Players in Smart Pole Market are Cree, Inc., Eaton, Echelon, General Electric (GE), Siemens, Signify Holding, Silver Spring Networks, Inc., Telensa, Wipro Limited, Zumtobel Group, Schneider Electric, Cisco Systems, Osram Licht AG, ABB Ltd., Honeywell International Inc., Trilliant Holdings Inc., Acuity Brands, Landis+Gyr, Itron Inc., Panasonic Corporation. and Others.
Recent Developments:
-
In Feb 2025, Eaton is investing USD340M to expand U.S. transformer production amid rising demand from utilities and data centers, with operations set to begin in 2027.The move is part of over USD1B in North American manufacturing investments since 2023, including facility upgrades and workforce development.
| Report Attributes | Details |
| Market Size in 2024 | USD 12.37 Billion |
| Market Size by 2032 | USD 46.02 Billion |
| CAGR | CAGR of 17.85% From 2024 to 2032 |
| Base Year | 2024 |
| Forecast Period | 2025-2032 |
| Historical Data | 2021-2023 |
| Report Scope & Coverage | Market Size, Segments Analysis, Competitive Landscape, Regional Analysis, DROC & SWOT Analysis, Forecast Outlook |
| Key Segments | • By Component(Hardware, Software and Service) • By Hardware(Lighting Lamp, Pole Bracket & Pole Body, Communication Device, Controller and Others) • By Installation Type(New Installation and Retrofit Installation) • By Application(Highways & Roadways, Public Places and Railways & Harbors) |
| Regional Analysis/Coverage | North America (US, Canada), Europe (Germany, UK, France, Italy, Spain, Russia, Poland, Rest of Europe), Asia Pacific (China, India, Japan, South Korea, Australia, ASEAN Countries, Rest of Asia Pacific), Middle East & Africa (UAE, Saudi Arabia, Qatar, South Africa, Rest of Middle East & Africa), Latin America (Brazil, Argentina, Mexico, Colombia, Rest of Latin America). |
| Company Profiles | The Smart Pole market companies are Cree, Inc., Eaton, Echelon, General Electric (GE), Siemens, Signify Holding, Silver Spring Networks, Inc., Telensa, Wipro Limited, Zumtobel Group, Schneider Electric, Cisco Systems, Osram Licht AG, ABB Ltd., Honeywell International Inc., Trilliant Holdings Inc., Acuity Brands, Landis+Gyr, Itron Inc., Panasonic Corporation. and Others |
Frequently Asked Questions
Asia-Pacific dominated the Smart Pole Market in 2024.
The “Hardware” segment dominated the Smart Pole Market
Rising smart city initiatives, demand for energy-efficient lighting, and growing adoption of IoT-based infrastructure.
The Smart Pole Market size was valued at USD 12.37 Billion in 2024 and is projected to reach USD 46.02 Billion by 2032
The Smart Pole Market is expected to grow at a CAGR of 17.85% during 2025-2032.
Get in Touch
