Smart Sensors Market Report Scope & Overview:
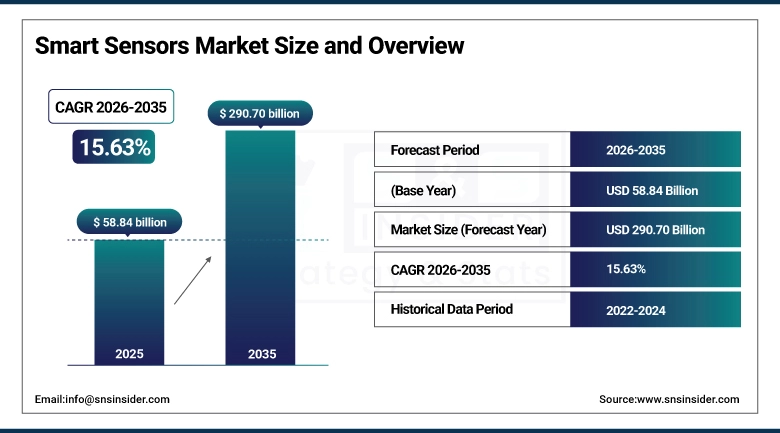
The Smart Sensors Market size was valued at USD 58.84 Billion in 2025 and is projected to reach USD 290.70 Billion by 2035, growing at a CAGR of 15.63% during 2026–2035.
The factors driving the Smart Sensors Market are the rise in the adoption of IoT technology, the rate of automation, and the demand for real-time monitoring. Advancements in MEMS technology, such as AI and edge computing, are also driving the Smart Sensors Market. Smart sensors are used for various applications in the automotive sector, such as ADAS, as well as wearables in the healthcare sector. This also drives the Smart Sensors Market. Smart cities and energy management also drive the Smart Sensors Market. The low cost of sensors and increased connectivity also drive the Smart Sensors Market.
Smart Sensors Market Size and Growth Forecast:
-
Market Size in 2025: USD 58.84 Billion
-
Market Size by 2035: USD 290.70 Billion
-
CAGR: 15.63% during 2026–2035
-
Base Year: 2025
-
Forecast Period: 2026–2035
-
Historical Data: 2022–2024
To Get more information on Smart Sensors Market - Request Free Sample Report
Smart Sensors Market Key Trends:
-
Predictive Maintenance Adoption: Smart sensors enable real-time monitoring of machinery, reducing unplanned downtime by 30–50%, lowering maintenance costs by 20–30%, and enhancing reliability by up to 40%.
-
Industry 4.0 Integration: Smart sensors are essential in automating production processes, improving throughput, efficiency, and operational safety across manufacturing, energy, and transportation sectors
-
Environmental Monitoring & Sustainability: Smart sensors support air and water quality monitoring, waste management, and optimization of renewable energy, driving sustainable development and efficiency improvements.
-
Energy Efficiency Improvements: Smart grids and sensors in solar panels and wind turbines can increase energy output efficiency by up to 30% and reduce urban energy use by 10–20%.
-
Market Penetration Trends: Over 50% of industrial plants and smart towns are expected to implement AI-powered or environmental smart sensors by 2024–2025, expanding market growth.
-
Integration & Data Security Challenges: Compatibility with legacy systems, data privacy concerns, and adherence to regulations like GDPR and HIPAA remain significant barriers to adoption.
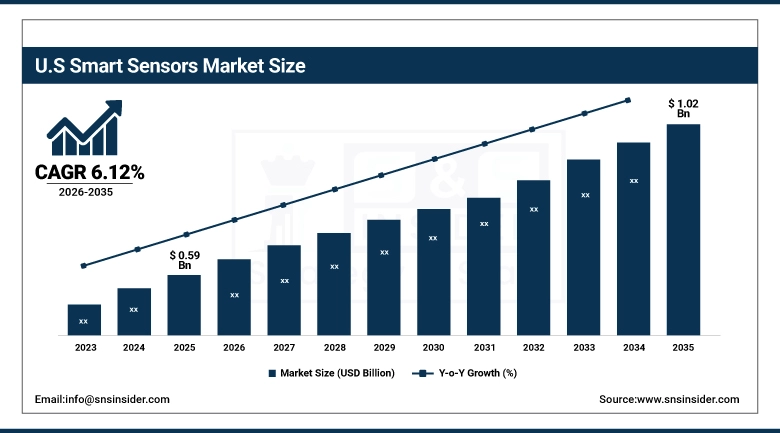
U.S. Smart Sensors Market Size Outlook:
The U.S. Smart Sensors Market size was valued at USD 0.59 Billion in 2025 and is projected to reach USD 1.02 Billion by 2035, growing at a CAGR of 6.12% during 2026–2035, The Smart Sensors Market in the U.S. is driven by the rising demand for industrial automation, strong demand for IoT-based smart devices, and rising adoption of smart sensors in the automotive and healthcare industries. The efficiency of smart sensors is improving with the development of AI and Edge computing technologies.
Smart Sensors Market Key Drivers:
-
Rising Adoption of IoT and Advancements in AI and Edge Computing are Driving the Smart Sensors Market Growth
The smart sensors are changing industries with their ability to monitor, automate, and make intelligent decisions in real-time. About 70% of connected devices are using smart sensing techniques to gather information. There is also improvement in terms of precision and efficiency through advancements in MEMS technology and artificial intelligence integration. Additionally, edge computing is being utilized in more than 50% of industries to improve processing capabilities. These improvements are leading to revolutions in automotive safety, industry automation, and healthcare monitoring, thereby creating opportunities to create smarter and more efficient solutions.
Smart Sensors Market Key Restraints:
-
High Costs and Integration Challenges Limit Growth in the Smart Sensors Market
However, the high costs associated with smart sensor system implementation and integration complexities with existing infrastructure act as significant restraints in this market. The implementation requires advanced hardware, connectivity solutions, as well as data processing capabilities, thereby calling for significant capital costs. In addition, concerns regarding data privacy and cybersecurity add to the difficulties faced by small and medium-sized enterprises, as well as those in developing countries.
Smart Sensors Market Key Opportunities:
-
Expansion of Smart Cities and Industrial IoT Creates Growth Opportunities for Smart Sensors
The rapid growth of smart cities and the increasing use of Industrial IoT (IIoT) are providing significant opportunities for the growth of smart sensors. Unlike traditional solutions, smart sensors allow users to manage their energy consumption, perform predictive maintenance, and monitor their infrastructure in an intelligent manner. With increasing investments in smart infrastructure and digitalization in general, smart sensing is expected to grow in the coming years.
Smart Sensors Market Segments:
-
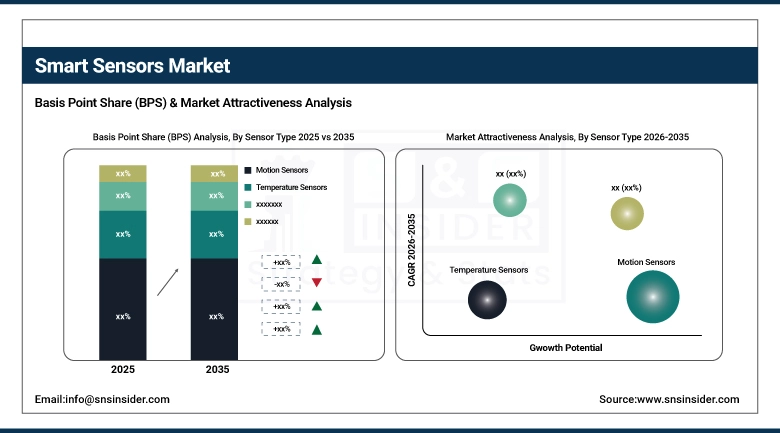
By Sensor Type: In 2025, Motion Sensors dominated with 30% share; Image Sensors fastest growing segment during 2026–2035
-
By Technology Type: In 2025, MEMS-based Smart Sensors dominated with 55% share; CMOS-based Smart Sensors fastest growing segment during 2026–2035
-
By Component: In 2025, Microcontrollers dominated with 35% share; Analog-to-Digital Converters (ADC) fastest growing segment during 2026–2035
-
By End Use: In 2025, Consumer Electronics dominated with 33% share; Healthcare fastest growing segment during 2026–2035
By Sensor Type, Motion Sensors Dominate the Market:
The Motion Sensors segment has the largest market share in the Smart Sensors Market, owing to the wide applicability of these sensors in consumer electronics, automobiles, as well as industrial automation. These sensors find wide acceptance in applications like smartphones, gaming consoles, security systems, as well as advanced driver assistance systems. Even though temperature sensors, pressure sensors, as well as image sensors, are experiencing high demand, the wide applicability of motion sensors across industries is keeping this segment at the forefront.
By Technology Type, MEMS-based Smart Sensors Dominate the Market:
Smart sensors based on MEMS technology are at the forefront of the market in terms of their compact size, low power consumption, and efficiency. These smart sensors are used in smartphone and wearable device applications, as well as in the automotive industry. They are highly cost-effective because of their ability to provide multiple sensing capabilities on a single chip. Although CMOS technology is emerging in smart sensors, especially in imaging, MEMS technology is leading in smart sensor applications.
By Component, Microcontrollers Dominate While ADCs Grow Rapidly:
Microcontrollers have the largest market share due to their role as the central processing unit in smart sensors, which enables the processing, controlling, and communication of data. This integration improves the functionality of the smart sensors. Analog-to-Digital Converters (ADC) are the fastest-growing segment due to their importance in converting analog signals from the real world to digital data that can be processed.
By End Use, Consumer Electronics Dominate While Healthcare Grows Rapidly:
Consumer Electronics has the largest market share in the Smart Sensors Market, as the smart sensors market has a high adoption rate in consumer electronics, such as smartphones, wearables, and smart homes. The key driver of the Smart Sensors Market is the increasing demand for end-user experience and connectivity. On the other hand, the Healthcare segment is the fastest-growing segment due to the increased adoption of smart sensors in remote patient monitoring, wearable healthcare devices, and sophisticated diagnostic tools with the rising trend of digital healthcare and personalized medicine.
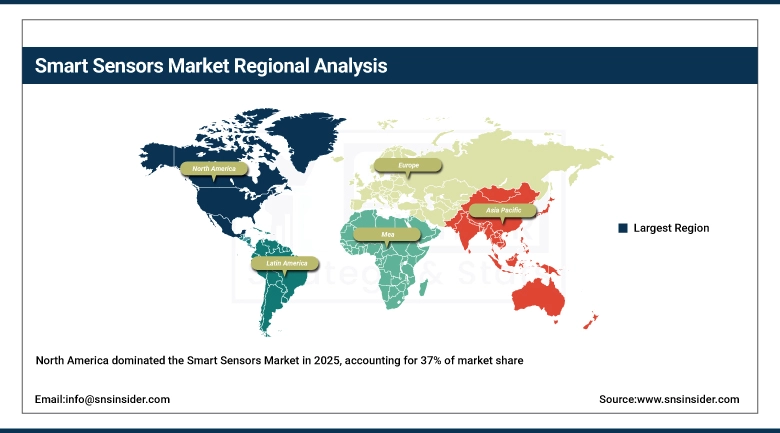
Smart Sensors Market Regional Analysis:
North America Smart Sensors Market Insights:
The largest market share in the world of smart sensors in the year 2025 in North America accounted for 37% of the market share because of the high adoption rate of technology and the amount of investment in IoT technology infrastructure. An example is the healthcare industry, which uses smart sensors in wearable technology such as Fitbit and Apple Watch, which provide real-time statistics on heart rate, oxygen levels, and activities. Companies such as Texas Instruments, Analog Devices, and STMicroelectronics are at the helm of developing smart sensor technology for industrial automation and automotive applications. Smart sensors are also highly prevalent in industrial environments for predictive maintenance and optimization purposes.
Get Customized Report as per Your Business Requirement - Enquiry Now
Asia-Pacific Smart Sensors Market Insights:
The Asia Pacific region is likely to witness the fastest growth with CAGR of 15.28% until the year 2035 due to the increased rate of industrial activity, high demand for conventional consumer electronics, and the development of smart cities. Some countries are contributing to this rapid development, such as China, India, and Japan. If we consider the country of China as an example, the country is home to technology majors such as Huawei and Xiaomi, which are incorporating the latest smart sensors in smartphones and wearables. Japan, which is known for its automotive prowess, is also using smart sensors to make vehicles safer and more efficient with the development of autonomous and electric vehicles. Digital India and smart manufacturing initiatives in China are also encouraging the adoption of smart sensor technology.
Europe Smart Sensors Market Insights:
The market share of smart sensors in Europe is sizeable, driven by the growth of the automotive, aerospace, and industrial automation sectors. The key countries in this segment are Germany, France, and the UK, with smart manufacturing and Industry 4.0 initiatives underway. Companies like Bosch, STMicroelectronics, and Infineon are some of the key players in the market.
Latin America Smart Sensors Market Insights:
Latin America’s growth is driven by the modernization of the industrial sector, transportation infrastructure, and the adoption of energy sector technology. Brazil and Mexico are at the epicenter of this expansion, especially with regards to automotive sensors. Smart city projects are also boosting the market.
Middle East & Africa (MEA) Smart Sensors Market Insights:
MEA market growth depends on energy management, smart city development, and industrial automation. The key markets are the UAE, Saudi Arabia, and South Africa, with applications in the utility sector, transportation sector, and industrial IoT segment. Proactive smart city development by governments also drives the market.
Smart Sensors Market Competitive Landscape:
STMicroelectronics was founded in 1987 and is based in Geneva, Switzerland. The company is a global leader in providing semiconductor solutions. STMicroelectronics specializes in designing, developing, and manufacturing integrated circuits and sensors for automotive, industrial, and consumer applications. STMicroelectronics emphasizes innovation, energy efficiency, and enabling smart and connected devices globally.
-
In October 2024, STMicroelectronics unveiled the ST1VAFE3BX, a groundbreaking bio-sensing chip for healthcare wearables like smartwatches and fitness bands, combining biopotential sensing with AI-powered activity detection for improved efficiency and lower power consumption.
Bosch Sensortec: Founded in 2005 with headquarters in Germany. The company is part of the Bosch Group. The company develops MEMS sensors. It offers advanced solutions for consumer electronics, IoT devices, and industrial applications. The company focuses on precision and efficient energy to empower the world with smart connected devices today and later on.
-
In January 2024, Bosch Sensortec used CES 2024 to launch a smart connected sensors platform for full body motion tracking, plus what it claims is the world’s smallest MEMS accelerometers for wearables and wearables.
OmniVision Technologies, established in 1995 and based in California (USA), is a global leader at the forefront of advanced digital imaging solutions. The company specializes on high performance imaging sensors and camera solutions for smartphone, automotive, security and AR |VR applications, and is driven by a mission of innovation in image quality, enhancing the way in which we connect to one another through smarter visual experiences all around the world.
-
In August 2024, OMNIVISION launched the OV50M40, a 50-megapixel CMOS image sensor with advanced HDR capabilities and low-light performance, designed for smartphone front, main, ultra-wide, and telephoto cameras.
Smart Sensors Companies are:
-
Honeywell International
-
STMicroelectronics
-
Analog Devices Inc.
-
Infineon Technologies
-
TE Connectivity
-
ABB Ltd.
-
NXP Semiconductors
-
DENSO Corporation
-
Eaton Corporation
-
Emerson Electric Co.
-
Vishay Intertechnology
-
Legrand
-
AMETEK Inc.
-
Microchip Technology Inc.
-
Balluff GmbH
-
Siemens AG
-
Texas Instruments
-
Alpha MOS
| Report Attributes | Details |
|---|---|
| Market Size in 2025 | USD 58.84 Billion |
| Market Size by 2035 | USD 290.70 Billion |
| CAGR | CAGR of 15.63% From 2026 to 2035 |
| Base Year | 2025 |
| Forecast Period | 2026-2035 |
| Historical Data | 2022-2024 |
| Report Scope & Coverage | Market Size, Segments Analysis, Competitive Landscape, Regional Analysis, DROC & SWOT Analysis, Forecast Outlook |
| Key Segments | • By Sensor Type (Motion Sensors, Temperature Sensors, Pressure Sensors, Image Sensors, Touch Sensors, Position Sensors, Others) • By Technology Type (MEMS-based Smart Sensors, CMOS-based Smart Sensors, Others) • By Component (Analog-to-Digital Converters (ADC), Digital-to-Analog Converters (DAC), Amplifiers, Microcontrollers, Others) • By End Use (Healthcare, Automotive, Infrastructure, Industrial, Consumer Electronics, Others) |
| Regional Analysis/Coverage | North America (US, Canada), Europe (Germany, UK, France, Italy, Spain, Russia, Poland, Rest of Europe), Asia Pacific (China, India, Japan, South Korea, Australia, ASEAN Countries, Rest of Asia Pacific), Middle East & Africa (UAE, Saudi Arabia, Qatar, South Africa, Rest of Middle East & Africa), Latin America (Brazil, Argentina, Mexico, Colombia, Rest of Latin America). |
| Company Profiles | Honeywell International, Bosch Sensortec, STMicroelectronics, Analog Devices Inc., Infineon Technologies, TE Connectivity, ABB Ltd., OmniVision Technologies, NXP Semiconductors, DENSO Corporation, Eaton Corporation, Emerson Electric Co., Vishay Intertechnology, Legrand, AMETEK Inc., Microchip Technology Inc., Balluff GmbH, Siemens AG, Texas Instruments, Alpha MOS. |
Frequently Asked Questions
The Smart Sensors Market is expected to grow at a CAGR of 15.63% during 2026-2035.
The market was valued at USD 58.84 Billion in 2025 and is projected to reach USD 290.70 Billion by 2035.
The key drivers include rising adoption of IoT devices, increasing industrial automation, and growing demand for real-time monitoring across industries.
The motion sensors segment dominated the Smart Sensors Market due to its widespread use in consumer electronics, automotive systems, and industrial applications.
North America dominated the Smart Sensors Market in 2025.
Get in Touch
