Smart Wearables Market Size & Trends:
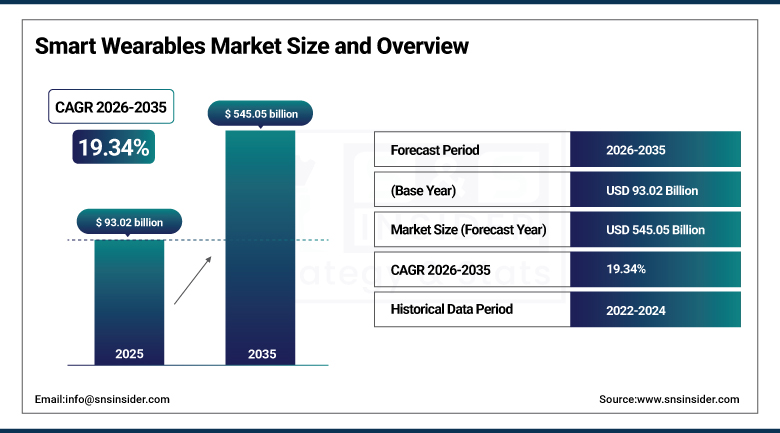
The Smart Wearables Market size was valued at USD 93.02 billion in 2025 and is expected to grow at a CAGR of 19.34% to reach USD 545.05 billion by 2035.
Smart Wearables market trends are driven by increasing consumer demand for health monitoring, fitness tracking, and connected lifestyles. Advancements in sensors, AI, and 5G are accelerating adoption across multiple sectors.
The Smart Wearables market continues to grow on the back of increasing adoption of remote work and virtual collaboration, an uptick in interest in gamified wellness solutions, and an increase in integration into smart home ecosystems. Increasing applications such as contactless payments, personalized coaching, and digital identity verification are also stirring the pot for demand. Furthermore, new monetization opportunities provide an avenue through partnerships between tech firms and insurance providers.
-
In 2024, over 45% of global companies implemented hybrid or fully remote work models, increasing demand for wearables that support virtual meetings, productivity tracking, and noise-cancellation via smart hearables.
Smart Wearables Market Size and Growth Projection:
-
Market Size in 2025 USD 93.02 Billion
-
Market Size by 2035 USD 545.05 Billion
-
CAGR of 19.34% From 2026 to 2035
-
Base Year 2025
-
Forecast Period 2026-2035
-
Historical Data 2025-2024
To Get More Information On Smart Wearables Market - Request Free Sample Report
Smart Wearables Market Trends Highlights:
-
AI-powered health monitoring and advanced sensors like ECG, SpO2, and sleep trackers are enhancing wearable capabilities and driving adoption.
-
Continuous growth in fitness tracking, chronic disease management, and remote patient monitoring is expanding the global smart wearables market.
-
Rising smartphone penetration, disposable incomes, and digital literacy in emerging regions are accelerating consumer adoption.
-
Expanding use cases beyond fitness, including elder care, healthcare diagnostics, and workplace productivity, are creating new market opportunities.
-
Integration of emerging technologies like 5G, AR/VR wearables, and smart fabrics is enabling innovative applications in immersive and industrial environments.
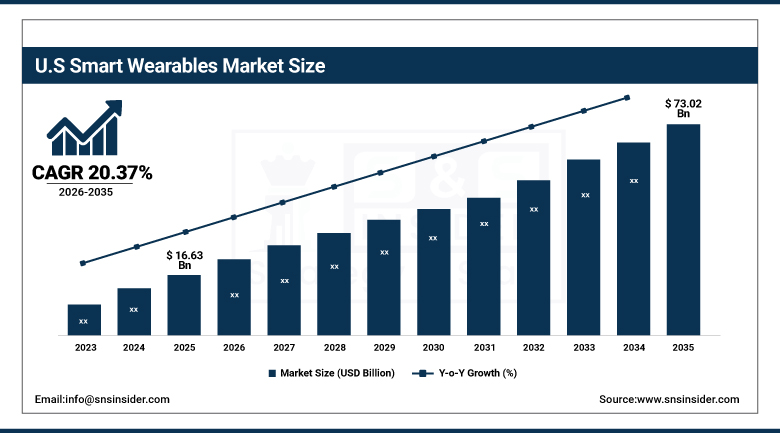
U.S. Smart Wearables Market Size Outlook
The U.S. Smart Wearables Market size was valued at USD 16.63 billion in 2025 and is projected to grow at a CAGR of 20.37%, reaching USD 73.02 billion by 2035. U.S. Smart Wearables market growth factor are rising health awareness, increasing demand for real-time health tracking, and integration with digital health platforms. Expanding use in insurance and enterprise sectors further boosts adoption.
Smart Wearables Market Growth Drivers:
-
AI Driven Health Monitoring and Sensor Advancements Accelerate Global Adoption of Smart Wearables Technology
Growing continuous health monitoring, fitness tracking, and chronic disease management is anticipated to fuel the growth of global Smart wearables market. Multiple advanced sensors including ECG, SpO2, sleep trackers combined with supportive analytics powered by AI technology are increasing the capabilities and consumer base of devices. Meanwhile, across much of the emerging world, increasing smartphone penetration, rising disposable incomes, and a more technologically literate population are increasing adoption.
-
Southeast Asia saw a 43% YoY increase in wearables shipments in early 2025 due to rising digital literacy and youth-driven tech adoption.
-
The WHO reported a surge in remote chronic care adoption, with smartwatches and patches contributing to over 20% of remote patient monitoring (RPM) setups in developed nations.
Smart Wearables Market Restraints:
-
Data Privacy and Regulatory Gaps Remain Major Barriers to Global Expansion of Smart Wearables Market
Smart wearables market is facing a serious challenge in terms of data privacy and security and this is one of the biggest restraint in this industry. Even though a large portion of the population is aware of the state-of-the-art technology that offers devices to make this possible, a huge group of the population is still unwilling to share personal information due to the ease with which sensitive health and location data can be collected by a device that you keep on your person all the time. The inconsistencies of global regulatory frameworks around data protection also become a hindrance to international expansion for many brands of wearables.
Smart Wearables Market Opportunities:
-
Expanding Use Cases and Emerging Technologies Unlock New Growth Opportunities in Global Smart Wearables Market
There are great growth opportunities in expanding use cases outside of fitness, including healthcare diagnostics, elder care, and workplace productivity. Together with healthcare providers, insurers, or enterprise platforms, wearable manufacturers are developing new monetization models via partnerships. Additionally, 5G, AR/VR wearables and smart fabrics can lead to more innovative opportunities in the immersive and industrial space.
-
Over 15 million elderly individuals worldwide used smartwatches or medical-grade patches in 2024–2025 for fall detection, medication reminders, and vitals monitoring.
Smart Wearables Market Segment Analysis:
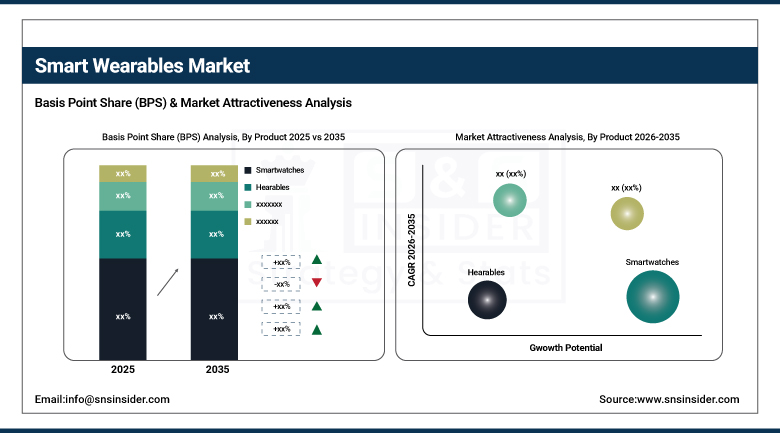
By Product
Smart wearables were primarily led by smartwatches, which accounted for 31.6% of the total market in 2025 due to being multifunctional, having health-monitoring features and also its ability to sync with smartphones. These consumers have made these watches a hit due to key features like ECG, SpO2, sleep tracking, and fitness analytics. Leading tech brands are not stopping with innovation, and the watches are no longer just health and wellness devices but productivity and connectivity instruments likely to shine brightly as hybrid work takes off. Due to increasing utilization for audio streaming, voice assistance, and continuous language translation, hearables are projected to grow fastest at a CAGR between 2026 and 2035. As it is lightweight designs, it can be used hands-free, and companies are integrating AI-based applications into these systems, broadening their commercial usage beyond entertainment to enterprise, education, and healthcare sectors.
By Component
The global smart wearables market was dominated by hardware with a 63.5% share in 2025, on account of hardware being the basic tier of the ecosystem comprising of physical devices, which include smartwatches, fitness trackers, hearables, and smart glasses. The need for new hardware devices with next-gen sensors (for example, ECG, SpO2, temperature) in addition to high durability is enhancing the sales volume. The hardware has solidified its place through ongoing product launches, upgrades to wearables, and brand fidelity. During 2026 to 2035, the highest CAGR growth is forecasted for services and subscriptions, due to the increasing adoption of view premium health analytics, personalized coaching, and cloud data platforms. Brands such as Fitbit, WHOOP, Apple are using subscription-based models to create more value, improve user stickiness and long term engagement.
By Connectivity Technology
In 2025, Bluetooth/BLE held a 43.6% of the smart wearables market share, due to its ubiquitous standards, low power requirements, and low cost. An ideal one that continues to reign for effortless short-range communication between wearables and smartphones, particularly fitness trackers, smartwatches and hearables. The interoperability across various devices/operating systems has made it a large pillar in consumer and health-related wearables. Due to its ultra–low latency, high bandwidth and support for real–time data transmission, the 5G Stand–Alone segment is expected to grow at the fasted CAGR from 2026 to 2035. Specifically within millimeter-wave mobility, this is beneficial for demanding applications like AR/VR wearables, including remote diagnostics and industrial monitoring, where performance and safety rely on zero latency.
By Application
The Consumer Electronics and Lifestyle segments together drove a 40.4% share of the smart wearables market in 2025, posting major growth as smart watches, hearables and fashion wearables mature into everyday personal-use devices. These devices are increasingly used by consumers for fitness tracking, notifications, entertainment, and integration with smartphones and smart home eco-systems. Interest in lifestyle-centric features including contactless payments, voice assistants and customizable watch faces contribute to the demand. The Healthcare and Medical segment is anticipated to grow at the highest CAGR between 2026 to 2035 on account of increasing demand for remote patient monitoring, remote monitoring for chronic disease management, and remote preventive care. Growth is driven by rising uptake of medical-grade wearables, insights powered by AI and interoperability with digital health platforms.
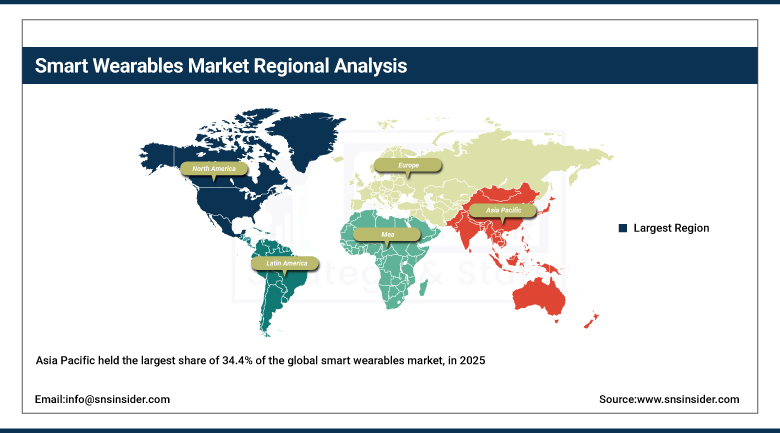
Smart Wearables Market Regional Analysis:
Asia Pacific Smart Wearables Market Insights
The Asia Pacific held the largest share of 34.4% of the global smart wearables market, in 2025 on account of rapid urbanization & rising digital literacy, along with a strong demand for health and lifestyle-related technologies. Demand for cheap wearables has skyrocketed in the region, underpinned by manufacturing capabilities, a burgeoning tech-savvy middle class along with improving internet and smartphone penetration. Motivated by regional brands through aggressive marketing and growth of e-commerce channels, adoption had increased rapidly across various demographics. The increase in integration with multiple telehealth ecosystems, fitness, and entertainment ecosystems further facilitating growth across consumer and enterprise verticals, have also made Asia Pacific, a crucial engine of innovation and scalability in wearables
China pulled ahead in Asia Pacific, with its thriving domestic production, large consumer appetite, and a fast pace of hardware and AI-driven health platform innovations driven by local tech giants.
Get Customized Report as Per Your Business Requirement - Enquiry Now
North America Smart Wearables Market Insights
Smart wearables market in North America growth is anticipated to grow at the fastest CAGR of 20.05% during the forecast period, from 2026 to 2035 due to high consumer awareness, improved healthcare infrastructure, and adoption of health and fitness technologies. Usage of wearables in remote patient monitoring, personalized wellness, and enterprise productivity is on the rise in the region. There is an increase in revenues through digital health platform integration, insurance incentives, and subscription-based services. The pace of innovation harnessing AI, biosensors, and seamless connectivity features to engage users continues to ramp up across the industry. In addition, high penetration of smartphones and continuing expansion across a variety of user segments backed by robust retail presence.
North America was led by the U.S., which offered a strong healthcare ecosystem, innovation leadership, and a high consumer willingness to adopt premium wearable technologies within the lifestyle and medical segments.
Europe Smart Wearables Market Insights
Europe is witnessing a steady growth trajectory for the smart wearables market over the coming years, owing to the growing concern regarding health amidst the aged population and favorable regulations & supportive framework around digital health. Wearables used for fitness tracking, chronic disease management, and preventive care consumer adoption has also continued to grow. The focus of the region on data privacy and compliance with laws such as GDPR cultivates trust in wearables health technology. In addition, the use cases are increasing through government-supported public health programs and alliances of healthcare providers and wearable makers. Also, high smartphone penetration, better Connectively and increasing usage of subscription-based wellness platforms also add fuel to the growth.
Latin America (LATAM) and Middle East & Africa (MEA) Smart Wearables Market Insights
The smart wearables market in Middle East & Africa & Latin America is growing, due to increasing digital penetration, gradually improving healthcare infrastructure, and rising awareness of personal wellness. According to third-party estimates, increasing penetration of smartphones and urbanization are paving the way for fitness and health-based wearables. Enterprises like government-driven health programs and access to increased e-commerce is aiding entry into the market, alongside low-cost products from local and international brands are aiding the adoption of this skin care among the middle-income demographics.
Smart Wearables Companies are:
-
Apple Inc.
-
Samsung Electronics Co., Ltd.
-
Xiaomi Corporation, Garmin Ltd.
-
Alphabet Inc.
-
Sony Corporation
-
Fitbit LLC
-
Amazfit (Zepp Health Corporation)
-
Oppo
-
Noise
-
boAt
-
Realme
-
Polar Electro Oy
-
Suunto Oy
-
Mobvoi Inc.
-
Fossil Group, Inc.
-
BBK Electronics Corporation
-
Honor Device Co., Ltd.
Competitive Landscape for Smart Wearables Market:
Apple Inc. is a global technology leader and a key player in the smart wearables market, offering devices such as the Apple Watch and AirPods. The company integrates advanced sensors, AI-driven health monitoring, and fitness tracking features, driving adoption for wellness, chronic disease management, and lifestyle applications worldwide.
-
In July 2025, Apple Watch Series 11 and Ultra 3 expected to feature energy scores, Action buttons, and blood-oxygen sensors.
Google is a leading technology company actively participating in the smart wearables market through devices like Fitbit and Google Pixel Watch. Leveraging AI, advanced health sensors, and fitness tracking capabilities, Google enables continuous health monitoring, wellness management, and personalized insights, fostering adoption across healthcare, fitness, and lifestyle applications globally.
-
In May 2025, Google Gemini AI assistant officially coming to Galaxy Watch and Galaxy Buds, marking Galaxy AI’s debut in wearables.
Huawei Technologies Co., Ltd. is a major global technology company active in the smart wearables market, offering products like the Huawei Watch series. The company integrates advanced sensors, AI-driven health and fitness monitoring, and connectivity features, supporting wellness tracking, chronic disease management, and lifestyle applications, driving adoption across global consumer and healthcare segments.
-
In August 2024, Huawei unveils the TruSense System, a health‑tracking platform measuring over 60 vital indicators for higher accuracy and speed across its wearable lineup.
| Report Attributes | Details |
|---|---|
| Market Size in 2025 | USD 93.02 Billion |
| Market Size by 2035 | USD 545.05 Billion |
| CAGR | CAGR of 19.34% From 2026 to 2035 |
| Base Year | 2025 |
| Forecast Period | 2026-2035 |
| Historical Data | 2022-2024 |
| Report Scope & Coverage | Market Size, Segments Analysis, Competitive Landscape, Regional Analysis, DROC & SWOT Analysis, Forecast Outlook |
| Key Segments | • By Product (Smartwatches, Hearables (Ear-Worn/Smart Earbuds), Fitness and Activity Trackers, Head-Mounted Displays (AR/VR/MR), Smart Clothing and Textiles, Body-worn Cameras, Smart Rings and Jewelry, Medical Wearable Patches and Biosensors, Powered Exoskeletons and Others) • By Component (Hardware, Software and Apps and Services and Subscriptions) • By Connectivity Technology (Bluetooth/BLE, Cellular (3G/4G/LTE-M), 5G Stand-Alone, NFC/RFID, Wi-Fi/WLAN and Others (UWB, ANT+)) • By Application (Consumer Electronics and Lifestyle, Healthcare and Medical, Fitness and Sports, Industrial and Enterprise Safety, and Military and Defense) |
| Regional Analysis/Coverage | North America (US, Canada), Europe (Germany, UK, France, Italy, Spain, Russia, Poland, Rest of Europe), Asia Pacific (China, India, Japan, South Korea, Australia, ASEAN Countries, Rest of Asia Pacific), Middle East & Africa (UAE, Saudi Arabia, Qatar, South Africa, Rest of Middle East & Africa), Latin America (Brazil, Argentina, Mexico, Colombia, Rest of Latin America). |
| Company Profiles | Apple Inc., Samsung Electronics Co., Ltd., Huawei Technologies Co., Ltd., Xiaomi Corporation, Garmin Ltd., Alphabet Inc., Sony Corporation, Fitbit LLC, Amazfit (Zepp Health Corporation), Oppo, Noise, boAt, Realme, Withings SA, Polar Electro Oy, Suunto Oy, Mobvoi Inc., Fossil Group, Inc., BBK Electronics Corporation, Honor Device Co., Ltd. |
Get in Touch
