Total Station Market Size & Growth:
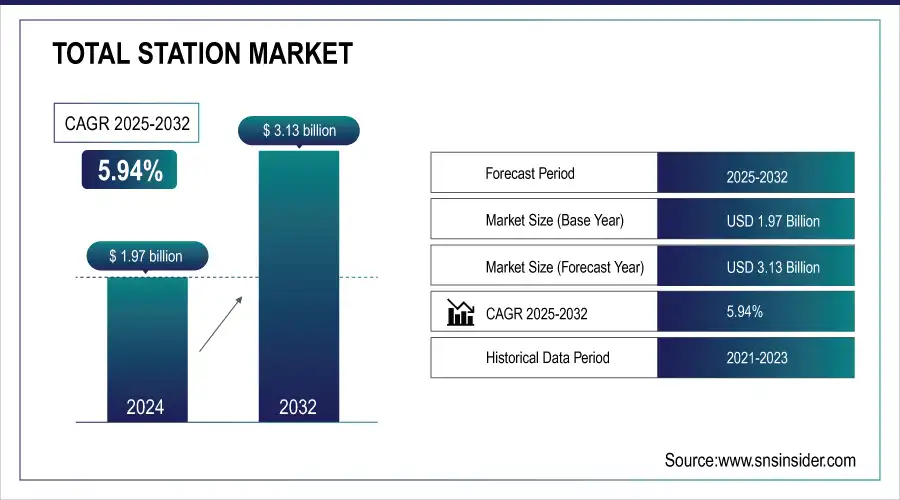
The Total Station Market was valued at USD 1.97 billion in 2024 and is expected to reach USD 3.13 billion by 2032, growing at a CAGR of 5.94% over the forecast period 2025-2032.
The growth of Total Station markets is primarily attributed to the increasing demand for precise and efficient surveying and construction technologies. Specifically, the construction industry is a significantly growing factor, as accurate data collection is vital for mapping, construction, and infrastructure projects. Unlike traditional methods, Total Stations boast increased accuracy, fast measurement speeds, broader capture, and automation capabilities that streamline workflow and reduce human error. Global adoption rates for robotic total stations were 35% in construction firms, while in the U.S., 27% of farms used precision farming technologies. In addition, launching initiatives like the Belt and Road Initiative and the U.S. Infrastructure Investment and Jobs Act are also boosting the utilization of surveying tools. The use of Robotic Total Stations also achieved time reductions of up to 30% during surveys when compared to traditional survey methods.
Total Station Market Size and Forecast:
-
Market Size in 2024: USD 1.97 Billion
-
Market Size by 2032: USD 3.13 Billion
-
CAGR: 5.94% from 2025 to 2032
-
Base Year: 2024
-
Forecast Period: 2025–2032
-
Historical Data: 2021–2023
Get more information on Total Station Market - Request Sample Report
Key Total Station Market Trends:
-
Integration of robotic and motorized total stations enhances surveying efficiency, accuracy, and reduces human intervention in complex construction and geospatial projects.
-
Adoption of GNSS and GPS technologies in total stations improves real-time positioning, mapping, and geospatial data collection capabilities for engineering and infrastructure projects.
-
Development of 3D laser scanning and imaging total stations supports detailed terrain modeling, topographic surveys, and advanced construction planning with high precision.
-
Increasing use of software integration and cloud-based data management enables seamless transfer, analysis, and visualization of survey data for improved decision-making.
-
Rising demand for automated and hybrid surveying systems reduces labor costs, enhances productivity, and ensures accuracy in large-scale infrastructure and urban development projects.
-
Compact and lightweight total stations improve portability and ease of use, facilitating surveys in remote, rugged, and difficult-to-access locations.
-
Growing adoption in construction, mining, and infrastructure sectors is driven by increasing government investments in smart city projects and large-scale industrial development.
The growing demand from mining, oil & gas, and transportation-based industries for precise measurement is another key catalyst improving the rate of growth of the Total Station market over the coming years as the need for accuracy in safety and efficient operation is at an all-time high. Furthermore, the increasing applications of geospatial data such as GIS (Geographic Information Systems) as well as 3D mapping are fueling the adoption of Total stations in new industries in addition to construction. Improvements at the GPS level, Software level & real-time data analysis are also strengthening the Total Station making it an integral tool for surveying. The total Station Market witnessed a robust growth of 30% in the adoption in the mining oil & gas and transportation industries. High demand for surveying equipment is being caused by investments of USD 1 trillion in construction driven by infrastructure projects such as the Belt and Road Initiative and the U.S. Infrastructure Investment and Jobs Act. In the realm of precision agriculture, the market penetration of Total Stations increased by 22%, while the uptake of robotic Total Stations saw an 18% growth.
Total Station Market Drivers:
-
Total Station Market Growth Driven by Infrastructure Development and Smart City Projects in Emerging Economies
The demand for the Total Station Market is driven in large part by the need for infrastructure development, especially in emerging economies. As countries around the world develop and places such as India, China, and parts of Africa experience industrialization and urbanization demand for effective surveying instruments has taken off. With such heavy investments in infrastructure projects across these regions like roads, railways, airports, and residential complexes, the demand for data collection is defined, and reliable and accurate data becomes even more critical. This could be a major work that requires extreme precision and accuracy, Total Stations gives the flexibility to map, plan, and implement such projects seamlessly. Apart from that, smart cities will need more modern types of surveying instruments for the planning and execution of sustainable growth due to the growing focus on smart cities by government and private players. Such trends then propel the growth of the Total Stations market in these developing regions even more. The Total Station Market is being driven by infrastructure investments in emerging economies. Smart city projects are helping to ignite demand for surveying technologies in India, where more than USD 1.4 trillion is being invested in infrastructure through 2030. The government strategy focuses on building 100 smart cities, and according to the latest announcement by the Chinese ministry of urbanization up to 2035, this is actually what China is hoping to develop. These trends fostered the entire industry of surveying that strives to provide better tools, such as Total Stations. Urban growth in Africa, particularly in cities such as Lagos and Nairobi, will drive up infrastructure investment by more than 10% a year. In addition, the Smart Cities Mission of India is investing USD 15 billion by 2025 to upgrade cities. These trends reflect the increasing penetration of total stations across developing markets.
-
AI and Machine Learning Revolutionizing Total Stations for Faster and More Accurate Surveying Solutions
Total Stations driven primarily by a rise in demand and innovation that includes integration of advanced technologies like artificial intelligence (AI) and machine learning (ML). Such technologies are having an enormous impact on how surveying and data collection takes place. Now with AI and ML, Total Stations can perform intelligent data analysis to facilitate real-time decision-making and increased map and model accuracy. AI-enabled Total stations, for example, can work with huge datasets in milliseconds, predict survey results; adjust or recalibrate measurements automatically, and even triangulate multiple devices with immense efficiency. Such a transition from manual surveying equipment to smarter and autonomous ones is also gaining popularity across industries, from agriculture to transportation to even archaeology where data precision and immediacy are a necessity. With this growing dependence on these hi-tech solutions, the market for Total Stations is turning these instruments into not just a tool for conventional surveying but an essential part of contemporary digital infrastructure. The Total Station with AI and Machine Learning integration has made it more efficient and accurate. The AI-powered Total Stations have been shown to process datasets 30% faster, and with machine learning, achieve 25% higher precision in complex settings. The proliferation of autonomous drones powered by AI has enabled an 18% increase in adoption along with a total operational cost reduction of up to 40%. Investment into AI survey technologies is predicted to expand globally at 15% each year up until the year 2025.
Total Station Market Restraints:
-
Challenges in Total Station Adoption Due to Skilled Labor Shortage and Harsh Environmental Conditions
A significant factor restraining the Total Station market is the requirement of experienced personnel to operate it. Total Stations have high accuracy and efficiency but require trained professionals to handle and interpret data correctly. A shortage of skilled professionals to use the systems, especially in developing economies, decelerates the adoption and productive use of these systems. For industries that require precision like construction and mining, this is a problem. Randomization may be impossible due to dependence on the weather for proper data collection. Total Stations are also impacted brightly by harsh environmental conditions like humidity, unexpected rain, fog, extreme temperatures, etc. The performance and accuracy of the instrument will be affected a lot by these harsh environmental conditions. This restriction usually requires more planning and scheduling, especially for outdoor usages such as surveying and construction. Inconsistent weather patterns, in turn, can delay operations, and reduce efficiency, impacting both timelines and the productivity of projects.
Total Station Market Segmentation Analysis:
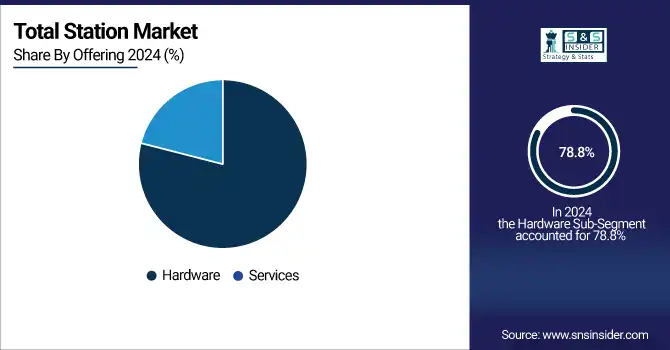
By Offering, Hardware Dominates Total Station Market, Services Segment to Grow Rapidly
Hardware led the Total Station market in 2024, with a share of 78.8%, owing to its pivotal role in the functionality and performance of Total Stations. At the heart of Total Station technology is hardware like a theodolite, EDM (electronic distance measurement), optical systems, and GPS systems. These devices play a critical role in offering accurate measurements, which is a fundamental need in industries such as construction, mining, and transportation. Surveying still captures a higher share of the market and the call for anything strong and reliable hardware always exists across surveying, especially for large-scale applications.
Services are estimated to hold the highest CAGR from 2025-2032, as modern Total Station systems continue to evolve and drivers become more complicated. As technology evolves and hardware becomes newer and newer, more downtimes associated with maintenance, calibration, software updates, and education will be required. By using service offerings like these, Total Stations can be maintained and ensure that they stay accurate and healthy for longer, resulting in an extended life cycle of the equipment while preventing downtime. Besides, the advent of machine learning, artificial intelligence, and real-time data processing technology in total stations is going to boost the demand for total station integration and analysis-based services. This transition from individual products to integrated service providers is one of the prominent factors that is expected to drive the growth of the market as industries are providing functional investments in service-driven solutions to optimize operational effectiveness through value-added service.
By Type, Robotic Total Stations Lead Market Growth with Automation and Precision Advantages
In 2024, Robotic Total Stations commanded the largest market share of 56.2% and also set to account for the fastest CAGR from 2025-2032. This increase is due to global demand for automation and precision in the case of surveying and construction projects. Robotic Total Stations have many advantages such as a high degree of accuracy, automation, and the ability to operate in remote or harsh environments with less human interference. Because they allow surveyors to measure faster, with less risk of human error, and therefore, greater productivity, they are especially beneficial where in the context of large-scale infrastructure projects such as roads, bridges, and buildings. The adoption of robotic systems is increasing at a furious pace as industries try to obtain higher accuracy and reduce operational costs. Robotic Total Stations offer significant operational advantages due to features such as automatic tracking, real-time data collection, and integration with other digital technologies like GIS and 3D modeling. This makes them the fastest-growing segment in the total station market and responsible for the ever-growing popularity of these units across different sectors including construction, transportation, and mining.
By Application, Construction Sector Drives Total Station Demand Amid Urbanization and Infrastructure Expansion
The construction sector accounted for the largest market share of 42.7% in 2024 and is anticipated to register the highest CAGR during 2025-2032. The proliferation of the construction sector is due to urbanization, infrastructural development, and the increasing demand for accuracy regarding large-scale construction enterprises. Total stations help survey, map, and collect data accurately which are necessary for the effective implementation of the construction site including roads, bridges, residential complexes, commercial buildings, and more. The rising demand for increasingly sophisticated and larger infrastructure projects, however, is driving the need for high-end surveying gear such as Total Stations. Using such equipment during the planning and construction phases allows you to increase efficiency, speed, and accuracy. Moreover, the combination of digital technologies, e.g., 3D modeling and geographic information systems (GIS) with Total Stations makes them more beneficial to onsite construction and promotes the growing penetration of Total Station equipment. Additionally, the increasing emphasis on smart cities and sustainable infrastructure further drives the widespread utilization of Total Station in construction.
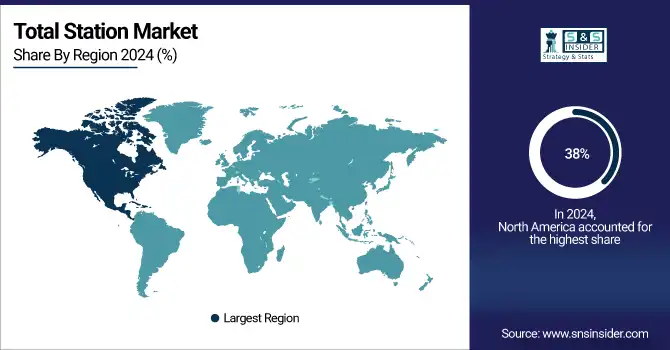
North America Dominates the Total Station Market in 2024
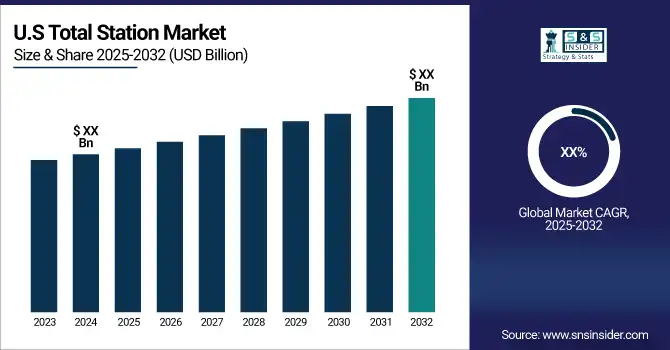
North America dominates the Total Station market in 2024, holding an estimated 38% market share, driven by the extensive development of infrastructure, urban construction projects, and modernization of transportation networks. The U.S., as the leading country, benefits from government investments in highways, smart city initiatives, and industrial expansion, which increases the adoption of advanced surveying technologies. Construction, mining, and transportation sectors increasingly rely on robotic and digital Total Stations for high accuracy, efficiency, and integration with GIS and 3D modeling systems.
Get Customized Report as per your Business Requirement - Request For Customized Report
United States Leads North America’s Total Station Market
The U.S. dominates due to its extensive infrastructural development, modernization of urban construction, and adoption of advanced surveying technologies. Government investments in transportation, smart cities, and large-scale industrial projects create high demand for accurate measurement tools. Surveying companies and construction firms increasingly adopt robotic and digital Total Stations for precision, efficiency, and integration with GIS and 3D modeling systems. With mature technology adoption, skilled professionals, and strong R&D, the U.S. continues to lead North America’s Total Station market, setting benchmarks for operational efficiency and automation.
Asia Pacific is the Fastest-Growing Region in the Total Station Market in 2024
Asia Pacific is the fastest-growing region in 2024, with an estimated CAGR of 11.6%, fueled by rapid urbanization, industrial growth, and extensive infrastructure development. China leads the region, driven by large-scale smart city projects, road and railway construction, and urban redevelopment initiatives. Surveying and construction companies increasingly deploy robotic Total Stations integrated with GIS and 3D modeling tools to ensure precision, minimize human error, and boost operational efficiency.
China Leads Asia Pacific’s Total Station Market
China dominates due to massive urbanization, government-backed infrastructure projects, and investments in smart cities. Rapid growth in construction, road networks, railways, and industrial zones drives adoption of robotic and digital Total Stations. Local manufacturers and foreign technology providers collaborate to supply advanced surveying tools for large-scale projects. Integration with GIS, 3D modeling, and automation technology enables higher efficiency and reduced human error. China’s emphasis on precise surveying, modernization of urban landscapes, and industrial expansion establishes it as the leading contributor to Asia Pacific’s Total Station market.
Europe Total Station Market Insights, 2024
Europe experiences steady growth in the Total Station market, fueled by urban redevelopment, infrastructure modernization, and high demand for precision surveying solutions. Germany’s investment in smart infrastructure and advanced surveying technology enhances construction accuracy, causing widespread adoption of Total Stations.
Germany Leads Europe’s Total Station Market
Germany dominates due to its strong engineering sector, infrastructure upgrades, and early adoption of robotic and digital surveying systems. Government projects focusing on smart cities, railways, and industrial expansions require precise measurement tools. Germany’s advanced construction standards and integration of Total Stations with BIM, GIS, and automation systems ensure higher productivity and lower operational errors. The country’s focus on innovation, technology adoption, and skilled surveying professionals solidifies its leadership position in Europe’s Total Station market.
Middle East & Africa and Latin America Total Station Market Insights, 2024
The Total Station market in these regions is growing steadily, supported by rising urbanization, infrastructure development, and adoption of precision surveying tools. In the Middle East, countries like Saudi Arabia and UAE invest in smart city and industrial projects, driving Total Station adoption for accurate construction and surveying. Latin American countries, such as Brazil and Mexico, are modernizing transport and urban infrastructure, which increases demand for advanced Total Station equipment. Collaboration with international technology providers and government-backed initiatives accelerates the deployment of both robotic and traditional surveying instruments.
Competitive Landscape for Total Station Market:
Leica Geosystems
Leica Geosystems is a Switzerland-based leader in precision measurement and surveying technologies, specializing in Total Station instruments, GNSS solutions, and laser scanners. With a rich heritage spanning over 200 years, the company designs, manufactures, and delivers highly accurate hardware and integrated software solutions for construction, mining, and infrastructure projects worldwide. Leica’s role in the Total Station market is pivotal, providing advanced robotic and conventional Total Stations that ensure precision, efficiency, and real-time data integration for large-scale surveying tasks, enhancing productivity and operational accuracy.
-
In 2024, Leica Geosystems launched an advanced Leica TS16 Total Station, featuring dynamic tracking, integrated 3D modeling, and automated data capture, supporting complex construction and mining projects globally.
Trimble Inc.
Trimble Inc. is a U.S.-based leader in advanced positioning technologies, delivering Total Stations, GNSS solutions, and construction software for surveying, agriculture, and civil engineering applications. The company specializes in combining hardware, software, and cloud-based solutions to enable high-precision measurements, automated workflows, and real-time data analysis. Trimble’s role in the Total Station market is significant, as it equips surveyors and construction professionals with integrated solutions that optimize project planning, execution, and monitoring.
-
In 2024, Trimble introduced the Trimble SX12 Robotic Total Station, offering integrated scanning, enhanced accuracy, and streamlined data processing for large-scale infrastructure projects.
Topcon Corporation
Topcon Corporation, headquartered in Japan, is a leading provider of precision measurement and surveying equipment, including robotic and conventional Total Stations, GNSS receivers, and imaging systems. The company integrates innovative hardware with software solutions to deliver efficient, accurate, and automated surveying and construction workflows. Topcon plays a key role in the Total Station market by offering reliable, high-precision instruments that support large-scale infrastructure, urban development, and industrial projects worldwide.
-
In 2024, Topcon launched the GT Series Robotic Total Station, combining real-time data transfer, advanced tracking, and seamless integration with BIM and GIS platforms for improved project efficiency.
Sokkia
Sokkia, based in Japan, is a prominent manufacturer of precision surveying instruments, including robotic and conventional Total Stations, GNSS solutions, and digital theodolites. The company focuses on delivering reliable, accurate, and user-friendly hardware combined with integrated software for construction, engineering, and geospatial applications. Sokkia’s role in the Total Station market is vital, providing advanced measurement solutions that enhance productivity, accuracy, and data management in demanding surveying and construction environments.
-
In 2024, Sokkia introduced the iX Series Robotic Total Station, featuring automated tracking, high-speed data collection, and compatibility with advanced 3D modeling and GIS technologies.
Leading Total Station Companies are:
-
Trimble Inc.
-
Topcon Corporation
-
Sokkia
-
Hexagon
-
Nikon
-
South Group
-
CHC Navigation
-
Stonex
-
Pentax
-
FOIF
-
Topcon Positioning Systems
-
Tianjin
-
Leica Microsystems
-
Javad GNSS
-
GeoPal
-
Survey Instruments
-
Laser Technology Inc.
-
Racelogic
| Report Attributes | Details |
|---|---|
|
Market Size in 2024 |
USD 1.97 Billion |
|
Market Size by 2032 |
USD 3.13 Billion |
|
CAGR |
CAGR of 5.94% From 2025 to 2032 |
|
Base Year |
2024 |
|
Forecast Period |
2025-2032 |
|
Historical Data |
2021-2023 |
|
Report Scope & Coverage |
Market Size, Segments Analysis, Competitive Landscape, Regional Analysis, DROC & SWOT Analysis, Forecast Outlook |
|
Key Segments |
• By Offering (Hardware, Service) |
|
Regional Analysis/Coverage |
North America (US, Canada, Mexico), Europe (Eastern Europe [Poland, Romania, Hungary, Turkey, Rest of Eastern Europe] Western Europe] Germany, France, UK, Italy, Spain, Netherlands, Switzerland, Austria, Rest of Western Europe]), Asia Pacific (China, India, Japan, South Korea, Vietnam, Singapore, Australia, Rest of Asia Pacific), Middle East & Africa (Middle East [UAE, Egypt, Saudi Arabia, Qatar, Rest of Middle East], Africa [Nigeria, South Africa, Rest of Africa], Latin America (Brazil, Argentina, Colombia, Rest of Latin America) |
|
Company Profiles |
Leica Geosystems, Trimble Inc., Topcon Corporation, Sokkia, Hexagon, GeoMax, Nikon, South Group, CHC Navigation, Stonex, Pentax, FOIF, Topcon Positioning Systems, Tianjin, Leica Microsystems, Javad GNSS, GeoPal, Survey Instruments, Laser Technology Inc., Racelogic. |
Frequently Asked Questions
The Total Station Market is expected to grow at a CAGR of 5.94% during 2025-2032.
Total Station Market size was USD 1.97 billion in 2024 and is expected to reach USD 3.13 billion by 2032.
The major growth factor of the Total Station market is the increasing demand for accurate and efficient surveying tools in large-scale infrastructure projects, driven by urbanization and technological advancements.
The Construction segment dominated the Total Station Market in 2024.
North America dominated the Total Station Market in 2024.
Get in Touch
