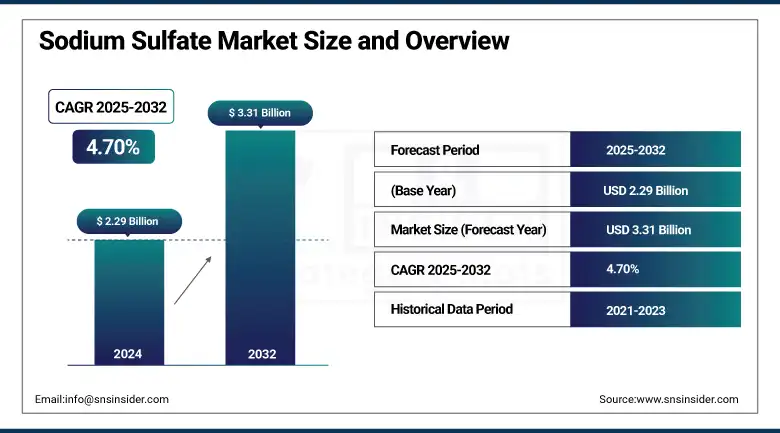
The sodium sulfate market size was valued at USD 2.29 billion in 2024 and is expected to reach USD 3.31 billion by 2032, growing at a CAGR of 4.70% over the forecast period of 2025-2032.
The sodium sulfate market is rapidly evolving in favor of sustainability and industrial innovation. North American sodium sulfate industry companies such as Searles Valley Minerals are scaling brine mining to saturate the market for detergents and glass. Synthetic sodium sulfate is more common in sustainable detergents, whereas Anhydrous Sodium Sulfate is more popular with manufacturing glass and recycling lithium-ion batteries byproducts. Sodium sulfate market trends highlight the increasing adoption of circular processes and clean manufacturing in the industry.
The U.S. Geological Survey (2023) reported that brine sources represented 33% of total U.S. salt consumption, a reflection of substantial natural sodium sulfate availability. Domestic sodium sulfate market share had likely been stable as of September 2022, when the U.S. International Trade Commission ruled no injury from Canadian imports of anhydrous sodium sulfate. Such developments are the manifestation of stable regulatory frameworks along with process innovation that is driving the sodium sulfate market growth.
Drivers
Expansion of Sustainable Brine Mining by Key Producers Accelerates Supply Growth
Leading sodium sulfate suppliers have increased the sustainable brine extraction of California dry-lake operations and incorporated a closed-loop evaporation process that reduces water and energy usage. This strategic repositioning will meet increased demand for natural sodium sulfate in detergents and glass and support a generalised expansion in the sodium sulfate market based on environmental sensitivity. Moreover, on the circular business front, by way of recycling lithium-ion battery byproducts and byproducts from rayon manufacture, customers can achieve higher purity of sodium sulphate with higher resource utilisation efficiency as well as supply source diversification. Consequently, brine-derived capacity in the North American sodium sulfate industry is expected to increase by 12% during 2022-24, helping to defend the market against raw material shortages
Rising Demand for High-Purity Synthetic Sodium Sulfate Fuels Specialty Applications
Pharmaceutical, electronics, and food-grade end-user industries have strict requirements for anhydrous sodium sulfate product purity, so Synthetic Sodium Sulfate manufacturers are innovating powder detergent formulation and specialty-grade anhydrous products to meet those specifications. Over the past few years, the developments in crystallization and drying technologies have kept the impurities below 0.05%, which have opened up new applications of high-purity material such as pH buffer, crystallization aid, and moisture-control desiccant. It is visible in a 9% annual growth from 2022 to 2024 in U.S. shipments of anhydrous sodium sulfate for specialty applications. These trends highlight the need for Sodium Sulfate Market Trends- segmentation, premium products, and chemical-firm and end-user partnerships.
Restraints
Climatic Variability Undermines Brine Lake Yield, Constraining Natural Supply
Production of Natural Sodium Sulfate via solar evaporation of brine is highly sensitive to precipitation and temperature; the 2023 unusually wet summer caused a 30,000-ton drop (-7%) in New York's Syracuse Basin output. Unfavourable weather conditions lower evaporation rates, prolong crystallization duration, and oblige producers to use more expensive synthetic methods. According to the U.S. Geological Survey, in 2022, domestic salt production was based in seven states, and 94% of salt was produced from this crop; such regional climate events may disproportionately affect the global Sodium Sulfate Market Size. This volatility increases the risk of supply and is hampering future capacity planning.
Heightened Water-Quality Regulations Increase Treatment and Compliance Costs
Stricter discharge limits for sulfate in industrial effluent, such as the EPA’s advisory to maintain drinking water sulfate below 250 mg/L and aquatic toxicity thresholds, necessitate advanced treatment systems at production sites. Retrofitting crystallizers and effluent treatment plants to meet these standards can add 8–12% to capital expenditures and drive-up operating costs. For instance, a Midwest facility incurred $1.2 million in treatment upgrades in 2023 to comply with state-mandated sulfate limits. This regulatory burden constrains profit margins and slows Sodium Sulfate Market Growth in regions with rigorous environmental policies.
By Nature
Natural Sodium Sulfate accounted for 55.3% of the market share in 2024, driven by its abundant reserves and lower production cost. Major producers like Saskatchewan Mining and Minerals in Canada supply to global detergent and glass manufacturers, ensuring steady demand. It is widely used in powder detergents as a filler and in glass production to remove air bubbles. According to the U.S. Geological Survey (USGS), the majority of natural Sodium Sulfate production is exported, highlighting its global acceptance and reliability in diverse industrial applications.
Synthetic Sodium Sulfate is the fastest-growing segment due to its consistent quality and purity, which are crucial for specialized uses in textiles and food processing. China leads in synthetic production through chemical processes involving hydrochloric acid and sodium chloride. As global industries emphasize precision formulations and environmental control, synthetic variants are gaining traction. Government incentives for advanced chemical production in Asia further fuel this growth. According to China’s Ministry of Industry and Information Technology (MIIT), synthetic Sodium Sulfate exports have increased by over 7% year-over-year.
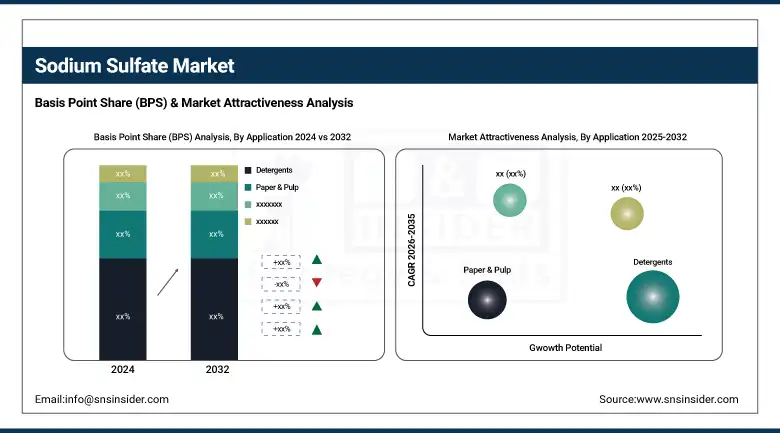
By Application
Detergents dominate with 38.5% market share, primarily due to the essential use of Sodium Sulfate as a filler in laundry powders and cleaners. Global leaders like Procter & Gamble and Henkel utilize Sodium Sulfate for its stability, cost-effectiveness, and compatibility with phosphate-free formulations. Regulatory frameworks like the U.S. Environmental Protection Agency’s Safer Choice program promote eco-friendly cleaning products, reinforcing demand. Additionally, Sodium Sulfate’s ability to maintain granule consistency makes it indispensable in high-efficiency detergent formats, especially in North America and Europe, where sustainable consumer products are prioritized.
Glass is the fastest-growing segment with a CAGR of 5.58%, driven by booming construction and automotive sectors. Sodium Sulfate acts as a fluxing agent in glass production, reducing furnace temperatures and enhancing product clarity. According to the U.S. Energy Information Administration (EIA), energy-efficient manufacturing practices are expanding, where Sodium Sulfate plays a critical role. Demand for architectural and solar glass in countries like the U.S., Germany, and India is also pushing growth. Companies like Saint-Gobain and Guardian Glass increasingly adopt Sodium Sulfate to meet rising standards in glass performance and sustainability.
By End-User
In 2024, the household segment led with a 42.6% market share, largely attributed to Sodium Sulfate’s prevalent use in laundry and dishwashing detergents. Top brands like Unilever’s Persil and Procter & Gamble’s Tide rely on Sodium Sulfate to maintain detergent volume and reduce formulation costs. Consumer demand for eco-friendly, phosphate-free products aligns with regulatory guidance from the U.S. EPA and EU REACH programs. Its non-toxic and biodegradable profile also aligns with household safety preferences, further strengthening its foothold in the consumer goods sector.
Industrial usage of Sodium Sulfate is expanding at the fastest rate with a CAGR of 5.06%, fueled by growth in sectors like textiles, glass, and paper. It serves as a processing aid, drying agent, or additive in several manufacturing workflows. Notably, increasing demand for sustainable packaging materials and specialty glass products supports this trend. The European Chemicals Agency (ECHA) has recognized Sodium Sulfate as a low-risk industrial chemical, encouraging its broader application. Industrial players are also benefiting from low raw material costs and growing demand in emerging markets.
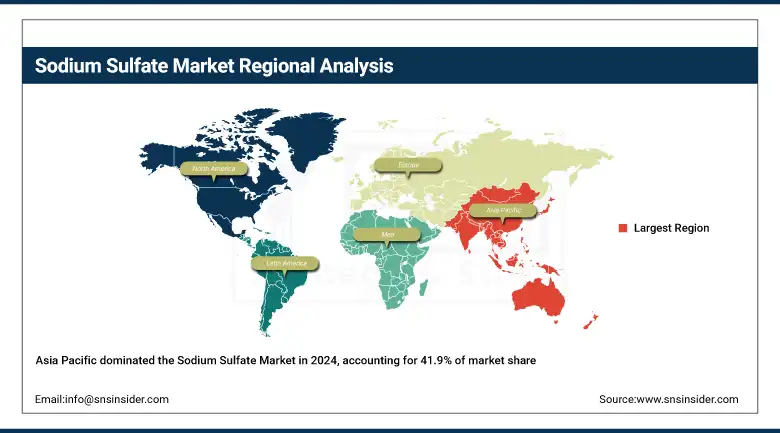
The Asia Pacific region leads the Sodium Sulfate Market Analysis in 2024, commanding a 41.9% share. China dominates the region due to its vast reserves of Natural Sodium Sulfate and aggressive expansion in Synthetic Sodium Sulfate output, used primarily in detergents and paper. The Ministry of Natural Resources of China reported over 3.5 million metric tons in output last year. India follows, with government programs like “Make in India” boosting the detergent and textile sectors. Rising middle-class demand and urbanization across Southeast Asia have also fueled the regional Sodium Sulfate Market Growth significantly.
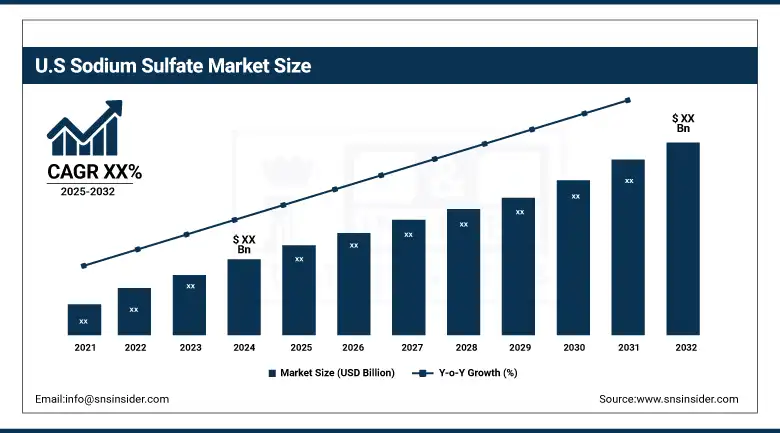
The North American Sodium Sulfate Industry is experiencing rapid growth in 2024, with the U.S. leading the surge due to the rising demand for Anhydrous Sodium Sulfate in phosphate-free detergents and high-grade glass manufacturing. Supported by the U.S. Geological Survey, production reached over 350,000 metric tons in 2023. Eco-conscious trends and innovations in powder detergent formulations are accelerating the Sodium Sulfate Market Growth. Canada is also playing a key role, where Saskatchewan Mining and Minerals expanded exports of Natural Sodium Sulfate, supported by demand in pulp, paper, and laundry sectors across North America.
Europe holds the second-largest Sodium Sulfate Market Share in 2024, led by countries like Germany, France, and Italy, with Germany at the forefront. The region’s stringent environmental regulations, such as REACH, are driving the shift to phosphate-free detergents, where Synthetic Sodium Sulfate is essential. Eurostat reported a steady increase in the consumption of eco-compliant detergents across Germany and France. Demand for Sodium Sulfate in textile dyeing and glass production also remains strong, particularly in industrial hubs like Frankfurt and Lyon, contributing to robust Sodium Sulfate Market Trends in Western Europe.
The major competitors in the sodium sulfate market include Nippon Chemical Industrial Co., Ltd., Elementis PLC, Shikoku Kasei Holdings Corporation, Cooper Natural Resources, Searles Valley Minerals, Godavari Biorefineries Ltd., MINERA DE SANTA MARTA, S.A., Saskatchewan Mining and Minerals Inc., Alkim Alkali Kimya A.Ş., and Sulquisa S.A.
May 2025: Shandong company launched an MVR plant to improve sodium sulfate recovery efficiency and reduce emissions in industrial chemical processes.
July 2024: Lupin received FDA tentative approval for generic Sutab® tablets used in colonoscopy prep, with $148M U.S. market value.
June 2024: Aepnus Technology raised $8M to develop a system converting sodium sulfate battery waste into reusable chemicals for circular sustainability.
Report Attributes | Details |
---|---|
Market Size in 2024 | USD 2.29 billion |
Market Size by 2032 | USD 3.31 billion |
CAGR | CAGR of 4.70% From 2025 to 2032 |
Base Year | 2024 |
Forecast Period | 2025-2032 |
Historical Data | 2021-2023 |
Report Scope & Coverage | Market Size, Segments Analysis, Competitive Landscape, Regional Analysis, DROC & SWOT Analysis, Forecast Outlook |
Key Segments | •By Nature (Natural, Synthetic) •By Application (Paper & Pulp, Detergents, Glass, Food & Beverage, Others) •By End-User (Household, Industrial, Commercial) |
Regional Analysis/Coverage | North America (US, Canada, Mexico), Europe (Germany, France, UK, Italy, Spain, Poland, Turkey, Rest of Europe), Asia Pacific (China, India, Japan, South Korea, Singapore, Australia, Rest of Asia Pacific), Middle East & Africa (UAE, Saudi Arabia, Qatar, South Africa, Rest of Middle East & Africa), Latin America (Brazil, Argentina, Rest of Latin America) |
Company Profiles | Nippon Chemical Industrial Co., Ltd., Elementis PLC, Shikoku Kasei Holdings Corporation, Cooper Natural Resources, Searles Valley Minerals, Godavari Biorefineries Ltd., MINERA DE SANTA MARTA, S.A., Saskatchewan Mining and Minerals Inc., Alkim Alkali Kimya A.Ş., Sulquisa S.A. |
Key players in the Sodium Sulfate Market include Searles Valley Minerals, Saskatchewan Mining and Minerals, and Elementis PLC.
Industrial applications in the Sodium Sulfate Market are growing fastest, fueled by demand in textiles, glass, and sustainable packaging.
Glass production in the Sodium Sulfate Market is expanding due to sodium sulfate’s role in lowering furnace temperatures and improving clarity.
The Sodium Sulfate Market is led by the detergent industry, accounting for 38.5% due to its filler role in powders.
The Sodium Sulfate Market is expected to reach USD 3.31 billion by 2032, growing at a 4.70% CAGR.
Table of Contents
1. Introduction
1.1 Market Definition
1.2 Scope (Inclusion and Exclusions)
1.3 Research Assumptions
2. Executive Summary
2.1 Market Overview
2.2 Regional Synopsis
2.3 Competitive Summary
3. Research Methodology
3.1 Top-Down Approach
3.2 Bottom-up Approach
3.3. Data Validation
3.4 Primary Interviews
4. Market Dynamics Impact Analysis
4.1 Market Driving Factors Analysis
4.1.1 Drivers
4.1.2 Restraints
4.1.3 Opportunities
4.1.4 Challenges
4.2 PESTLE Analysis
4.3 Porter’s Five Forces Model
5. Statistical Insights and Trends Reporting
5.1 Glass Manufacturing Demand Trends
5.2 Warehouse-to-Consumer Distribution Time
5.3 Raw Material Price Volatility Trends
5.4 Online Procurement Share Statistics
5.5 Major Supplier Geographic Distribution
6. Competitive Landscape
6.1 List of Major Companies, By Region
6.2 Market Share Analysis, By Region
6.3 Product Benchmarking
6.3.1 Product specifications and features
6.3.2 Pricing
6.4 Strategic Initiatives
6.4.1 Marketing and promotional activities
6.4.2 Distribution and Supply Chain Strategies
6.4.3 Expansion plans and new Product launches
6.4.4 Strategic partnerships and collaborations
6.5 Technological Advancements
6.6 Market Positioning and Branding
7. Sodium Sulfate Market Segmentation by Nature
7.1 Chapter Overview
7.2 Natural
7.2.1 Natural Market Trends Analysis (2021-2032)
7.2.2 Natural Market Size Estimates and Forecasts to 2032 (USD Billion)
7.3 Synthetic
7.3.1 Synthetic Market Trends Analysis (2021-2032)
7.3.2 Synthetic Market Size Estimates and Forecasts to 2032 (USD Billion)
8. Sodium Sulfate Market Segmentation by Application
8.1 Chapter Overview
8.2 Paper & Pulp
8.2.1 Paper & Pulp Market Trend Analysis (2021-2032)
8.2.2 Paper & Pulp Market Size Estimates and Forecasts to 2032 (USD Billion)
8.3 Detergents
8.3.1 Detergents Market Trends Analysis (2021-2032)
8.3.2 Detergents Market Size Estimates and Forecasts to 2032 (USD Billion)
8.2 Glass
8.2.1 Glass Market Trend Analysis (2021-2032)
8.2.2 Glass Market Size Estimates and Forecasts to 2032 (USD Billion)
8.3 Food & Beverage
8.3.1 Food & Beverage Market Trends Analysis (2021-2032)
8.3.2 Food & Beverage Market Size Estimates and Forecasts to 2032 (USD Billion)
8.2 Others
8.2.1 Others Market Trend Analysis (2021-2032)
8.2.2 Others Market Size Estimates and Forecasts to 2032 (USD Billion)
9. Sodium Sulfate Market Segmentation by End-User
9.1 Chapter Overview
9.2 Household
9.2.1 Household Market Trends Analysis (2021-2032)
9.2.2 Household Market Size Estimates and Forecasts to 2032 (USD Billion)
9.3 Industrial
9.3.1 Industrial Market Trends Analysis (2021-2032)
9.3.2 Industrial Market Size Estimates and Forecasts to 2032 (USD Billion)
9.4 Commercial
9.4.1 Commercial Market Trends Analysis (2021-2032)
9.4.2 Commercial Market Size Estimates and Forecasts to 2032 (USD Billion)
10. Regional Analysis
10.1 Chapter Overview
10.2 North America
10.2.1 Trends Analysis
10.2.2 North America Sodium Sulfate Market Estimates and Forecasts, by Country (2021-2032) (USD Billion)
10.2.3 North America Sodium Sulfate Market Estimates and Forecasts, by Nature (2021-2032) (USD Billion)
10.2.4 North America Sodium Sulfate Market Estimates and Forecasts, by Application (2021-2032) (USD Billion)
10.2.5 North America Sodium Sulfate Market Estimates and Forecasts, by End-User (2021-2032) (USD Billion)
10.2.6 USA
10.2.6.1 USA Sodium Sulfate Market Estimates and Forecasts, by Nature (2021-2032) (USD Billion)
10.2.6.2 USA Sodium Sulfate Market Estimates and Forecasts, by Application (2021-2032) (USD Billion)
10.2.6.3 USA Sodium Sulfate Market Estimates and Forecasts, by End-User (2021-2032) (USD Billion)
10.2.7 Canada
10.2.7.1 Canada Sodium Sulfate Market Estimates and Forecasts, by Nature (2021-2032) (USD Billion)
10.2.7.2 Canada Sodium Sulfate Market Estimates and Forecasts, by Application (2021-2032) (USD Billion)
10.2.7.3 Canada Sodium Sulfate Market Estimates and Forecasts, by End-User (2021-2032) (USD Billion)
10.2.8 Mexico
10.2.8.1 Mexico Sodium Sulfate Market Estimates and Forecasts, by Nature (2021-2032) (USD Billion)
10.2.8.2 Mexico Sodium Sulfate Market Estimates and Forecasts, by Application (2021-2032) (USD Billion)
10.2.8.3 Mexico Sodium Sulfate Market Estimates and Forecasts, by End-User (2021-2032) (USD Billion)
10.3 Europe
10.3.1 Trends Analysis
10.3.2 Eastern Europe Sodium Sulfate Market Estimates and Forecasts, by Country (2021-2032) (USD Billion)
10.3.3 Eastern Europe Sodium Sulfate Market Estimates and Forecasts, by Nature (2021-2032) (USD Billion)
10.3.4 Eastern Europe Sodium Sulfate Market Estimates and Forecasts, by Application (2021-2032) (USD Billion)
10.3.5 Eastern Europe Sodium Sulfate Market Estimates and Forecasts, by End-User (2021-2032) (USD Billion)
10.3.6 Germany
10.3.6.1 Germany Sodium Sulfate Market Estimates and Forecasts, by Nature (2021-2032) (USD Billion)
10.3.6.2 Germany Sodium Sulfate Market Estimates and Forecasts, by Application (2021-2032) (USD Billion)
10.3.6.3 Germany Sodium Sulfate Market Estimates and Forecasts, by End-User (2021-2032) (USD Billion)
10.3.7 France
10.3.7.1 France Sodium Sulfate Market Estimates and Forecasts, by Nature (2021-2032) (USD Billion)
10.3.7.2 France Sodium Sulfate Market Estimates and Forecasts, by Application (2021-2032) (USD Billion)
10.3.7.3 France Sodium Sulfate Market Estimates and Forecasts, by End-User (2021-2032) (USD Billion)
10.3.8 UK
10.3.8.1 UK Sodium Sulfate Market Estimates and Forecasts, by Nature (2021-2032) (USD Billion)
10.3.8.2 UK Sodium Sulfate Market Estimates and Forecasts, by Application (2021-2032) (USD Billion)
10.3.8.3 UK Sodium Sulfate Market Estimates and Forecasts, by End-User (2021-2032) (USD Billion)
10.3.9 Italy
10.3.9.1 Italy Sodium Sulfate Market Estimates and Forecasts, by Nature (2021-2032) (USD Billion)
10.3.9.2 Italy Sodium Sulfate Market Estimates and Forecasts, by Application (2021-2032) (USD Billion)
10.3.9.3 Italy Sodium Sulfate Market Estimates and Forecasts, by End-User (2021-2032) (USD Billion)
10.3.10 Spain
10.3.10.1 Spain Sodium Sulfate Market Estimates and Forecasts, by Nature (2021-2032) (USD Billion)
10.3.10.2 Spain Sodium Sulfate Market Estimates and Forecasts, by Application (2021-2032) (USD Billion)
10.3.10.3 Spain Sodium Sulfate Market Estimates and Forecasts, by End-User (2021-2032) (USD Billion)
10.3.11 Poland
10.3.11.1 Poland Sodium Sulfate Market Estimates and Forecasts, by Nature (2021-2032) (USD Billion)
10.3.11.2 Poland Sodium Sulfate Market Estimates and Forecasts, by Application (2021-2032) (USD Billion)
10.3.11.3 Poland Sodium Sulfate Market Estimates and Forecasts, by End-User (2021-2032) (USD Billion)
10.3.12 Turkey
10.3.12.1 Turkey Sodium Sulfate Market Estimates and Forecasts, by Nature (2021-2032) (USD Billion)
10.3.12.2 Turkey Sodium Sulfate Market Estimates and Forecasts, by Application (2021-2032) (USD Billion)
10.3.12.3 Turkey Sodium Sulfate Market Estimates and Forecasts, by End-User (2021-2032) (USD Billion)
10.3.13 Rest of Europe
10.3.13.1 Rest of Europe Sodium Sulfate Market Estimates and Forecasts, by Nature (2021-2032) (USD Billion)
10.3.13.2 Rest of Europe Sodium Sulfate Market Estimates and Forecasts, by Application (2021-2032) (USD Billion)
10.3.13.3 Rest of Europe Sodium Sulfate Market Estimates and Forecasts, by End-User (2021-2032) (USD Billion)
10.4 Asia Pacific
10.4.1 Trends Analysis
10.4.2 Asia Pacific Sodium Sulfate Market Estimates and Forecasts, by Country (2021-2032) (USD Billion)
10.4.3 Asia Pacific Sodium Sulfate Market Estimates and Forecasts, by Nature (2021-2032) (USD Billion)
10.4.4 Asia Pacific Sodium Sulfate Market Estimates and Forecasts, by Application (2021-2032) (USD Billion)
10.4.5 Asia Pacific Sodium Sulfate Market Estimates and Forecasts, by End-User (2021-2032) (USD Billion)
10.4.6 China
10.4.6.1 China Sodium Sulfate Market Estimates and Forecasts, by Nature (2021-2032) (USD Billion)
10.4.6.2 China Sodium Sulfate Market Estimates and Forecasts, by Application (2021-2032) (USD Billion)
10.4.6.3 China Sodium Sulfate Market Estimates and Forecasts, by End-User (2021-2032) (USD Billion)
10.4.7 India
10.4.7.1 India Sodium Sulfate Market Estimates and Forecasts, by Nature (2021-2032) (USD Billion)
10.4.7.2 India Sodium Sulfate Market Estimates and Forecasts, by Application (2021-2032) (USD Billion)
10.4.7.3 India Sodium Sulfate Market Estimates and Forecasts, by End-User (2021-2032) (USD Billion)
10.4.8 Japan
10.4.8.1 Japan Sodium Sulfate Market Estimates and Forecasts, by Nature (2021-2032) (USD Billion)
10.4.8.2 Japan Sodium Sulfate Market Estimates and Forecasts, by Application (2021-2032) (USD Billion)
10.4.8.3 Japan Sodium Sulfate Market Estimates and Forecasts, by End-User (2021-2032) (USD Billion)
10.4.9 South Korea
10.4.9.1 South Korea Sodium Sulfate Market Estimates and Forecasts, by Nature (2021-2032) (USD Billion)
10.4.9.2 South Korea Sodium Sulfate Market Estimates and Forecasts, by Application (2021-2032) (USD Billion)
10.4.9.3 South Korea Sodium Sulfate Market Estimates and Forecasts, by End-User (2021-2032) (USD Billion)
10.4.10 Singapore
10.4.10.1 Singapore Sodium Sulfate Market Estimates and Forecasts, by Nature (2021-2032) (USD Billion)
10.4.10.2 Singapore Sodium Sulfate Market Estimates and Forecasts, by Application (2021-2032) (USD Billion)
10.4.10.3 Singapore Sodium Sulfate Market Estimates and Forecasts, by End-User (2021-2032) (USD Billion)
10.4.11 Australia
10.4.11.1 Australia Sodium Sulfate Market Estimates and Forecasts, by Nature (2021-2032) (USD Billion)
10.4.11.2 Australia Sodium Sulfate Market Estimates and Forecasts, by Application (2021-2032) (USD Billion)
10.4.11.3 Australia Sodium Sulfate Market Estimates and Forecasts, by End-User (2021-2032) (USD Billion)
10.4.12 Rest of Asia Pacific
10.4.12.1 Rest of Asia Pacific Sodium Sulfate Market Estimates and Forecasts, by Nature (2021-2032) (USD Billion)
10.4.12.2 Rest of Asia Pacific Sodium Sulfate Market Estimates and Forecasts, by Application (2021-2032) (USD Billion)
10.4.12.3 Rest of Asia Pacific Sodium Sulfate Market Estimates and Forecasts, by End-User (2021-2032) (USD Billion)
10.5 Middle East and Africa
10.5.1 Trends Analysis
10.5.2 Middle East Sodium Sulfate Market Estimates and Forecasts, by Country (2021-2032) (USD Billion)
10.5.3 Middle East Sodium Sulfate Market Estimates and Forecasts, by Nature (2021-2032) (USD Billion)
10.5.4 Middle East Sodium Sulfate Market Estimates and Forecasts, by Application (2021-2032) (USD Billion)
10.5.5 Middle East Sodium Sulfate Market Estimates and Forecasts, by End-User (2021-2032) (USD Billion)
10.5.6 UAE
10.5.6.1 UAE Sodium Sulfate Market Estimates and Forecasts, by Nature (2021-2032) (USD Billion)
10.5.6.2 UAE Sodium Sulfate Market Estimates and Forecasts, by Application (2021-2032) (USD Billion)
10.5.6.3 UAE Sodium Sulfate Market Estimates and Forecasts, by End-User (2021-2032) (USD Billion)
10.5.7 Saudi Arabia
10.5.7.1 Saudi Arabia Sodium Sulfate Market Estimates and Forecasts, by Nature (2021-2032) (USD Billion)
10.5.7.2 Saudi Arabia Sodium Sulfate Market Estimates and Forecasts, by Application (2021-2032) (USD Billion)
10.5.7.3 Saudi Arabia Sodium Sulfate Market Estimates and Forecasts, by End-User (2021-2032) (USD Billion)
10.5.8 Qatar
10.5.8.1 Qatar Sodium Sulfate Market Estimates and Forecasts, by Nature (2021-2032) (USD Billion)
10.5.8.2 Qatar Sodium Sulfate Market Estimates and Forecasts, by Application (2021-2032) (USD Billion)
10.5.8.3 Qatar Sodium Sulfate Market Estimates and Forecasts, by End-User (2021-2032) (USD Billion)
10.5.9 South Africa
10.5.9.1 South Africa Sodium Sulfate Market Estimates and Forecasts, by Nature (2021-2032) (USD Billion)
10.5.9.2 South Africa Sodium Sulfate Market Estimates and Forecasts by Application (2021-2032) (USD Billion)
10.5.9.3 South Africa Sodium Sulfate Market Estimates and Forecasts, by End-User (2021-2032) (USD Billion)
10.5.10 Rest of Middle East & Africa
10.5.10.1 Rest of Middle East & Africa Sodium Sulfate Market Estimates and Forecasts, by Nature (2021-2032) (USD Billion)
10.5.10.2 Rest of Middle East & Africa Sodium Sulfate Market Estimates and Forecasts, by Application (2021-2032) (USD Billion)
10.5.10.3 Rest of Middle East & Africa Sodium Sulfate Market Estimates and Forecasts, by End-User (2021-2032) (USD Billion)
10.6 Latin America
10.6.1 Trends Analysis
10.6.2 Latin America Sodium Sulfate Market Estimates and Forecasts, by Country (2021-2032) (USD Billion)
10.6.3 Latin America Sodium Sulfate Market Estimates and Forecasts, by Nature (2021-2032) (USD Billion)
10.6.4 Latin America Sodium Sulfate Market Estimates and Forecasts, by Application (2021-2032) (USD Billion)
10.6.5 Latin America Sodium Sulfate Market Estimates and Forecasts, by End-User (2021-2032) (USD Billion)
10.6.6 Brazil
10.6.6.1 Brazil Sodium Sulfate Market Estimates and Forecasts, by Nature (2021-2032) (USD Billion)
10.6.6.2 Brazil Sodium Sulfate Market Estimates and Forecasts, by Application (2021-2032) (USD Billion)
10.6.6.3 Brazil Sodium Sulfate Market Estimates and Forecasts, by End-User (2021-2032) (USD Billion)
10.6.7 Argentina
10.6.7.1 Argentina Sodium Sulfate Market Estimates and Forecasts, by Nature (2021-2032) (USD Billion)
10.6.7.2 Argentina Sodium Sulfate Market Estimates and Forecasts, by Application (2021-2032) (USD Billion)
10.6.7.3 Argentina Sodium Sulfate Market Estimates and Forecasts, by End-User (2021-2032) (USD Billion)
10.6.8 Rest of Latin America
10.6.8.1 Rest of Latin America Sodium Sulfate Market Estimates and Forecasts, by Nature (2021-2032) (USD Billion)
10.6.8.2 Rest of Latin America Sodium Sulfate Market Estimates and Forecasts, by Application (2021-2032) (USD Billion)
10.6.8.3 Rest of Latin America Sodium Sulfate Market Estimates and Forecasts, by End-User (2021-2032) (USD Billion)
11. Company Profiles
11.1 Nippon Chemical Industrial Co., Ltd.
11.1.1 Company Overview
11.1.2 Financial
11.1.3 Product/ Services Offered
11.1.4 SWOT Analysis
11.2 Elementis PLC
11.2.1 Company Overview
11.2.2 Financial
11.2.3 Product/ Services Offered
11.2.4 SWOT Analysis
11.3 Shikoku Kasei Holdings Corporation
11.3.1 Company Overview
11.3.2 Financial
11.3.3 Product/ Services Offered
11.3.4 SWOT Analysis
11.4 Cooper Natural Resources
11.4.1 Company Overview
11.4.2 Financial
11.4.3 Product/ Services Offered
11.4.4 SWOT Analysis
11.5 Searles Valley Minerals
11.5.1 Company Overview
11.5.2 Financial
11.5.3 Product/ Services Offered
11.5.4 SWOT Analysis
11.6 Godavari Biorefineries Ltd.
11.6.1 Company Overview
11.6.2 Financial
11.6.3 Product/ Services Offered
11.6.4 SWOT Analysis
11.7 MINERA DE SANTA MARTA, S.A.
11.7.1 Company Overview
11.7.2 Financial
11.7.3 Product/ Services Offered
11.7.4 SWOT Analysis
11.8 Saskatchewan Mining and Minerals Inc.
11.8.1 Company Overview
11.8.2 Financial
11.8.3 Product/ Services Offered
11.8.4 SWOT Analysis
11.9 Alkim Alkali Kimya A.Ş.
11.9.1 Company Overview
11.9.2 Financial
11.9.3 Product/ Services Offered
11.9.4 SWOT Analysis
11.10 Sulquisa S.A.
11.10.1 Company Overview
11.10.2 Financial
11.10.3 Product/ Services Offered
11.10.4 SWOT Analysis
12. Use Cases and Best Practices
13. Conclusion
An accurate research report requires proper strategizing as well as implementation. There are multiple factors involved in the completion of good and accurate research report and selecting the best methodology to compete the research is the toughest part. Since the research reports we provide play a crucial role in any company’s decision-making process, therefore we at SNS Insider always believe that we should choose the best method which gives us results closer to reality. This allows us to reach at a stage wherein we can provide our clients best and accurate investment to output ratio.
Each report that we prepare takes a timeframe of 350-400 business hours for production. Starting from the selection of titles through a couple of in-depth brain storming session to the final QC process before uploading our titles on our website we dedicate around 350 working hours. The titles are selected based on their current market cap and the foreseen CAGR and growth.
The 5 steps process:
Step 1: Secondary Research:
Secondary Research or Desk Research is as the name suggests is a research process wherein, we collect data through the readily available information. In this process we use various paid and unpaid databases which our team has access to and gather data through the same. This includes examining of listed companies’ annual reports, Journals, SEC filling etc. Apart from this our team has access to various associations across the globe across different industries. Lastly, we have exchange relationships with various university as well as individual libraries.
Step 2: Primary Research
When we talk about primary research, it is a type of study in which the researchers collect relevant data samples directly, rather than relying on previously collected data. This type of research is focused on gaining content specific facts that can be sued to solve specific problems. Since the collected data is fresh and first hand therefore it makes the study more accurate and genuine.
We at SNS Insider have divided Primary Research into 2 parts.
Part 1 wherein we interview the KOLs of major players as well as the upcoming ones across various geographic regions. This allows us to have their view over the market scenario and acts as an important tool to come closer to the accurate market numbers. As many as 45 paid and unpaid primary interviews are taken from both the demand and supply side of the industry to make sure we land at an accurate judgement and analysis of the market.
This step involves the triangulation of data wherein our team analyses the interview transcripts, online survey responses and observation of on filed participants. The below mentioned chart should give a better understanding of the part 1 of the primary interview.
Part 2: In this part of primary research the data collected via secondary research and the part 1 of the primary research is validated with the interviews from individual consultants and subject matter experts.
Consultants are those set of people who have at least 12 years of experience and expertise within the industry whereas Subject Matter Experts are those with at least 15 years of experience behind their back within the same space. The data with the help of two main processes i.e., FGDs (Focused Group Discussions) and IDs (Individual Discussions). This gives us a 3rd party nonbiased primary view of the market scenario making it a more dependable one while collation of the data pointers.
Step 3: Data Bank Validation
Once all the information is collected via primary and secondary sources, we run that information for data validation. At our intelligence centre our research heads track a lot of information related to the market which includes the quarterly reports, the daily stock prices, and other relevant information. Our data bank server gets updated every fortnight and that is how the information which we collected using our primary and secondary information is revalidated in real time.
Step 4: QA/QC Process
After all the data collection and validation our team does a final level of quality check and quality assurance to get rid of any unwanted or undesired mistakes. This might include but not limited to getting rid of the any typos, duplication of numbers or missing of any important information. The people involved in this process include technical content writers, research heads and graphics people. Once this process is completed the title gets uploader on our platform for our clients to read it.
Step 5: Final QC/QA Process:
This is the last process and comes when the client has ordered the study. In this process a final QA/QC is done before the study is emailed to the client. Since we believe in giving our clients a good experience of our research studies, therefore, to make sure that we do not lack at our end in any way humanly possible we do a final round of quality check and then dispatch the study to the client.
Key Segments:
By Nature
Natural
Synthetic
By Application
Paper & Pulp
Detergents
Glass
Food & Beverage
Others
By End-User
Household
Industrial
Commercial
Request for Segment Customization as per your Business Requirement: Segment Customization Request
Regional Coverage:
North America
US
Canada
Mexico
Europe
Germany
France
UK
Italy
Spain
Poland
Turkey
Rest of Europe
Asia Pacific
China
India
Japan
South Korea
Singapore
Australia
Rest of Asia Pacific
Middle East & Africa
UAE
Saudi Arabia
Qatar
South Africa
Rest of Middle East & Africa
Latin America
Brazil
Argentina
Rest of Latin America
Request for Country Level Research Report: Country Level Customization Request
Available Customization
With the given market data, SNS Insider offers customization as per the company’s specific needs. The following customization options are available for the report:
Detailed Volume Analysis
Criss-Cross segment analysis (e.g. Product X Application)
Competitive Product Benchmarking
Geographic Analysis
Additional countries in any of the regions
Customized Data Representation
Detailed analysis and profiling of additional market players