Stadium Security Market Report Scope & Overview:
The Stadium Security Market size was valued at USD 11.38 billion in 2024 and is expected to reach USD 20.50 billion by 2032, growing at a CAGR of 7.72% from 2025-2032.
The Stadium Security Market growth is driven by the high incidences of security threats, crowd related incidents, and terrorism on large public events. Growing investments in advanced surveillance systems, access control, and emergency response solution fueling the safety of stadiums. AI-based video analytics, integrated facial recognition and IoT-enabled monitoring are driving better real-time threat detection and incident response too. Moreover, growing sports events, concerts, and large gatherings globally are driving demand for strong security infrastructure. The market growth is being expedited by stringent regulations enforced by the government and the need to provide a secure fan experience.
-
The SAFETY Act Program of the U.S. Department of Homeland Security, which provides anti-terrorism security solutions via its Best Practices in Anti-Terrorism Security (BPATS I) and BPATS II, and offers critical security standards and quantitative benchmarks to assess anti-terrorism measures at venues.
-
Furthermore, more than 70% of sports organizations are targeted by cyberattacks annually, according to the Cybersecurity and Infrastructure Security Agency (CISA), creating increased demand for so-called holistic cyber and physical security solutions.
The U.S. Stadium Security Market size was valued at USD 3.12 billion in 2024 and is expected to reach USD 5.55 billion by 2032, growing at a CAGR of 7.45% from 2025-2032.
Growth in the U.S. Stadium Security Market is fueled by rising security threats, stricter safety regulations, and increasing adoption of advanced surveillance, access control, and AI-driven monitoring systems to ensure public safety during major sports and entertainment events.
Market Dynamics
Drivers
-
Rising Frequency of Large-Scale Sporting and Entertainment Events Demanding Advanced Security Measures to Ensure Crowd Safety and Incident Prevention Globally
The increasing frequency of large-scale sporting events, concerts, and cultural gatherings will fuel demand for the stadium security infrastructure. Large crowds heighten potential dangers including crowd crushes and terrorism, increasing the demand for advanced technologies surveillance, facial recognition, and access control necessary. A lot of money is being spent by event organizers and government to ensure the safety and protect the venue reputation. Increased international security climate excited via main events, followed through implementation of incorporated safety solutions, is predicted to force the marketplace steadily as human protection and operational efficiency comprise highest essential task inside of government.
-
DHS SAFETY Act approval has been granted for 24/7 Software, Inc., for a technology platform developed to improve situational awareness and safety/security at sports and entertainment events.
-
As one of the largest sporting events in all of the U.S. Super Bowl LVIII approaches the Cybersecurity and Infrastructure Security Agency (CISA), NFL, Allegiant Stadium and federal/state partners conducted a cybersecurity tabletop exercise. In a series of controlled, harnessed, and simulated environments, over 100 stakeholders worked together to fortify event resilience against cyber threats.
Restraints
-
High Implementation and Maintenance Costs of Advanced Security Systems Limiting Adoption in Smaller Stadiums and Budget-Constrained Event Venues
These systems require substantial investment in surveillance, biometric access control and crowd management technology though. More modest venues, or those in emerging economies, may struggle to implement such cutting-edge solutions due to budget reasons. This adds to the financial burden on top of other ongoing costs such as software updates, maintenance of equipment and having a team with expertise. Such high costs have discouraged many, leaving most at the mercy of basic security measures. This financial obstacle results in a sluggish market expansion, particularly in areas with insufficient sports facilities and also places with unstable or undeveloped public-private security funding partnerships.
Opportunities
-
Growing Adoption Of AI, Iot, And Predictive Analytics in Stadium Security for Real-Time Threat Detection and Crowd Management Optimization
AI, IoT and predictive analytics have improved the safety of stadiums by practicing real-time detection of threats and crowd monitoring capacities. AI-video analytics identifies suspicious activities and crowd anomalies, IoT-sensors deliver environmental monitoring, and unauthorized access detection. Using past and current data, crowd prediction models can forecast crowd behaviour and aid in the efficient management of personnel and evacuation plans. While these technologies improve the efficiency of security operations and provide a more seamless fan experience with less intrusive screening, these have shown to be capital investments for stadium operators that look to improve the quality of their security system.
-
A recent study introduced EvacuNet, an AI-powered model using data on temperature, humidity, and CO₂ and VOC levels from over 62,000 sensors, was developed to detect fire hazards with 99.99% accuracy. It optimizes evacuation plans and then addresses crowding issues in emergencies.
Challenges
-
Balancing Robust Security Measures with Fan Convenience to Avoid Negative Impacts on Overall Stadium Experience and Event Attendance
Robust security measures, including extensive baggage inspections, biometric authorization, and multiple levels of access control, frequently result in slow entry queues and disruption for visitors. Although protecting the venue has to be of critical concern, too stringent an approach might simply drive fans away and cause attendance to become lacking in enthusiasm. It's a constant battle for stadium operators to strike the right balance between safety and keeping the flow of people moving freely. Clearly, contactless access, mobile ticket scanning and AI-powered enforcement can address a number of these challenges but only if properly managed in context without compromising security. This dilemma requires stakeholders to come up with new security protocols that ensure the freedom of movement for fans in an open environment.
Segment Analysis
By Technology
Surveillance systems held the largest share of about 44% in 2024 owing to their vital role in real-time monitoring, threat detection, and incident documentation in stadiums. High-resolution cameras, AI-based analytics to identify crowded, chaotic, and individual inappropriate activity, and advanced video management systems to provide wide surveillance coverage while deterring malicious activity, make them a first choice for venue operators willing to boost safety, comply with regulations, and keep venues on-site operational at scale during events.
Access control systems are projected to grow at the fastest CAGR of 9.90% over 2025–2032, due to the increasing adoption of biometric authentication, RFID based ticketing and mobile entry solutions. By simplifying entry procedures, lowering unwarranted access, and promoting crowd movement, these technologies have the potential to radically change visitor experience without compromising security. A shift toward contactless, speedy, and data-driven approach toward entry management for safety and convenience is even further propelling their adoption across the stadiums.
By Application
Event security dominated with a 40% share in 2024 driven by the growing need for complete security at live sports, concerts, and tournaments. Trained personnel, a screening system, and incident response teams enable things to run smoothly during events. Event-centric security services driven by high profile gatherings creating the need to safeguard athletes, performers, and audiences make this segment among core operational to stadium operators globally.
Crowd management is expected to register the fastest CAGR of 9.02% over 2025–2032 primarily driven by increasing organization of large-scale events along with enhancing safety compliance standards. With the help of advanced crowd analytics, AI-based prediction models, and real-time monitoring, stampede prevention, seating flow optimization, and emergency evacuations can be best managed. This ensures securing safe and efficient operations while also improving the visitor experience; a significant interest and investment in crowd management solutions.
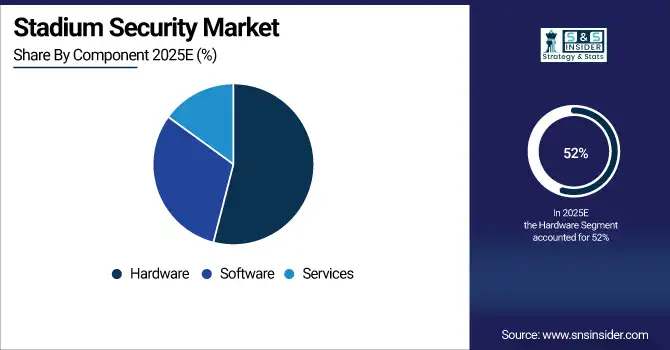
By Component
Hardware dominated the stadium security market share in 2024 of a 52%, as surveillance cameras, metal detectors, scanners, biometric devices, and other hardware elements are the first line of defense against a myriad of threats. This physical hardware, in turn, is the foundation of security infrastructure, providing tangible deterrents and monitoring. Hardware is expected to remain the highest revenue generating segment within the market due to continuous technology upgrades and the need for safety installations.
Software is set to grow at the fastest CAGR of 9.51% over 2025–2032, due to AI-based analytics, facial recognition, & incident management platforms. They facilitate the centralized nature of control, enable automated detection of threat, provide actionable insights which enables fast response. However, with the increasing frameworks being implemented at the smart stadium with integrated smart and integrated security, the software-based world between assisting decision, compliance, and operational efficiency has now become necessity rather than luxury, fueling a strong growth.
By End-User
Sports stadiums accounted for 59% of revenue in 2024 due to hosting frequent high-capacity events such as football, cricket, and rugby games which require substantial security. Due to the requirement to provide security for large crowds, high-profile athletes, and abide by international security protocols, sports stadiums have continued to invest in advanced surveillance, access control, and emergency security in which sports stadiums are still the highest demand for sophisticated security globally.
Concert venues are expected to grow at the fastest CAGR of 9.32% over 2025–2032, owing to the surge in demand for large-scale live performances and music festivals. Such events need flexible security systems that can respond to a different crowd behaviour and hung in the various layout. Support efforts with advanced monitoring, mobile access systems and real-time crowd analytics ensure safety, keeping the attendee experience compromise-free, thus making concert venue security investments all the more necessary from operators and organizers standpoint.
By Sales Channel
Direct sales captured 53% of the market in 2024 as stadium operators prefer to deal directly finding value through tailored installations and service agreements from security solution providers. This allows for tailored systems, improved post-sales service, and seamless communication in case of upgrades or a crisis. Direct sales further enable the integration of niche technologies, providing stadiums some assurance of system robustness and long-term operational viability, thereby keeping direct sales firmly atop the stadium purchase ecosystem.
Channel partners are projected to grow at the fastest CAGR of 8.63% over 2025–2032 as they provide extensive Distribution networks, localized service support, and competitive pricing. They help bring security solutions to mid-tier and smaller stadiums in emerging markets. Collaboration with system integrators, resellers, and consultants further enriches the customization and scalability of the solution, which continues to trigger venues to adopt these systems on an economical yet uncompromising security system.
Regional Analysis
North America held the largest share of about 39% in 2024, owing to its existing sports infrastructure, regular large-scale events, and stringent security regulations. Market dominance is largely due to high adoption of advanced technologies such as AI surveillance and biometric access control along with integrated surveillance systems. The strong presence of large investments by stadium operators, and the high level of collaboration among defense forces and public-private agencies boosts stadium security market dominance in the region.
The U.S. is dominating the stadium security market in North America, driven by active participation at the state level in sports, the presence of sport infrastructure on a grand scale, and a lot of money being invested into new and advanced safety technologies.
Asia Pacific is projected to grow at the fastest CAGR of 9.53% over 2025–2032, owing to rapid urbanization, growing popularity of sporting events, and an expanding entertainment industry. There is a major investment by both governments and the private sector in stadium infrastructure; the new stadiums come with advanced security technology. The growing consciousness toward safety compliance along with adoption of AI-powered surveillance systems and access management systems render the region as a prominent growth engine for stadium security solutions.
China is dominating the stadium security market in Asia Pacific, driven by massive sports infrastructure investments and rapid adoption of advanced surveillance and access control technologies.
Europe holds a significant position in the stadium security market, Due to large number of international sporting events, strict safety codes & regulations and rapid technology penetration in the region. The UK, Germany and France are big investors in surveillance, access control and crowd management solutions
The U.K. is dominating the stadium security market in Europe, due to advanced infrastructure, regular occurrence of major events and a high adoption of modern safety technologies.
The stadium security market trends in Middle East & Africa are on the rise owing to investments for modern sports venues, especially for mega-events. Latin America, on the other hand, is playing catch-up with upgrades to football stadiums as safety concerns rise and advanced surveillance and crowd control systems become more commonplace.
Key Players
Stadium Security Market companies are Avigilon Corporation, AxxonSoft, BOSCH Security Systems, Genetec Inc., Dallmeier, Honeywell International Inc., NEC Corporation, Rapiscan Systems, Cisco Systems Inc., Intel Corporation, IBM, Johnson Controls International plc, Axis Communications AB, Siemens AG, GP Smart Stadium, L3Harris Technologies Inc., FLIR Systems Inc., Verint Systems Inc., Smiths Detection Inc., Pelco.
Recent Developments:
-
2025: Avigilon Corporation: GBK Sports Complex implemented Avigilon Unity video system with self-learning analytics and UMD technology to monitor vast sports facilities preventing unauthorized usage while reducing operational losses.
-
2024: Genetec Inc. Eden Park in New Zealand deployed Genetec Security Center with Omnicast, ANPR, and redundant appliances to centralize stadium security, improve crowd monitoring, and enhance law enforcement collaboration during major events.
Report Attributes | Details |
---|---|
Market Size in 2024 | USD 11.38 Billion |
Market Size by 2032 | USD 20.50 Billion |
CAGR | CAGR of 7.72% From 2025 to 2032 |
Base Year | 2024 |
Forecast Period | 2025-2032 |
Historical Data | 2021-2023 |
Report Scope & Coverage | Market Size, Segments Analysis, Competitive Landscape, Regional Analysis, DROC & SWOT Analysis, Forecast Outlook |
Key Segments | • By Component (Hardware, Software, Services) • By Technology (Surveillance Systems, Access Control Systems, Emergency and Disaster Management, Cybersecurity, Others) • By Application (Event Security, Parking Security, Crowd Management, Others) • By End-User (Sports Stadiums, Concert Venues, Others) • By Sales Channel (Channel Partners, Direct Sales, Others) |
Regional Analysis/Coverage | North America (US, Canada), Europe (Germany, UK, France, Italy, Spain, Russia, Poland, Rest of Europe), Asia Pacific (China, India, Japan, South Korea, Australia, ASEAN Countries, Rest of Asia Pacific), Middle East & Africa (UAE, Saudi Arabia, Qatar, South Africa, Rest of Middle East & Africa), Latin America (Brazil, Argentina, Mexico, Colombia, Rest of Latin America). |
Company Profiles | Avigilon Corporation, AxxonSoft, BOSCH Security Systems, Genetec Inc., Dallmeier, Honeywell International Inc., NEC Corporation, Rapiscan Systems, Cisco Systems Inc., Intel Corporation, IBM, Johnson Controls International plc, Axis Communications AB, Siemens AG, GP Smart Stadium, L3Harris Technologies Inc., FLIR Systems Inc., Verint Systems Inc., Smiths Detection Inc., Pelco |
Table Of Contents
1. Introduction
1.1 Market Definition & Scope
1.2 Research Assumptions & Abbreviations
1.3 Research Methodology
2. Executive Summary
2.1 Market Snapshot
2.2 Market Absolute $ Opportunity Assessment & Y-o-Y Analysis, 2021–2032
2.3 Market Size & Forecast, By Segmentation, 2021–2032
2.3.1 Market Size By Component
2.3.2 Market Size By Application
2.3.3 Market Size By Technology
2.3.4 Market Size By End-User
2.3.5 Market Size By Sales Channel
2.4 Market Share & Bps Analysis By Region, 2024
2.5 Industry Growth Scenarios – Conservative, Likely & Optimistic
2.6 Industry CxO’s Perspective
3. Market Overview
3.1 Market Dynamics
3.1.1 Drivers
3.1.2 Restraints
3.1.3 Opportunities
3.1.4 Key Market Trends
3.2 Industry PESTLE Analysis
3.3 Key Industry Forces (Porter’s) Impacting Market Growth
3.4 Industry Supply Chain Analysis
3.4.1 Raw Material Suppliers
3.4.2 Manufacturers
3.4.3 Distributors/Suppliers
3.4.4 Customers/End-Users
3.5 Industry Life Cycle Assessment
3.6 Parent Market Overview
3.7 Market Risk Assessment
4. Statistical Insights & Trends Reporting
4.1 Pricing Analysis & Forecast
4.1.1 Overview
4.1.2 Pricing Trends by Component (Hardware, Software, Services)
4.1.3 Price Benchmarking by Key Technology Providers
4.1.4 Cost Comparison: Surveillance Systems vs. Access Control Systems
4.1.5 Forecast of Unit Price Reduction due to Technological Advancements
4.2 Regulatory & Compliance Landscape
4.2.1 Overview
4.2.2 Safety & Security Compliance Standards for Stadiums
4.2.3 Cybersecurity Regulations for Connected Security Devices
4.2.4 Event Crowd Management Legal Frameworks
4.2.5 Future Policy Trends on Public Venue Security
4.3 Installation & Deployment Metrics
4.3.1 Overview
4.3.2 Average Installation Time by System Type
4.3.3 Share of New vs. Retrofit Stadium Security Installations
4.3.4 Stadium Size Categories and Security Equipment Density
4.3.5 Deployment Models: On-Premises vs. Cloud-Based Security Management
4.4 Operational & Performance Statistics
4.4.1 Overview
4.4.2 Average Incident Response Time Before & After System Deployment
4.4.3 Percentage Reduction in Security Breaches Post-Implementation
4.4.4 Detection Accuracy Rates by Surveillance System Type
4.4.5 False Alarm Rates & Resolution Methods
4.5 Event & Crowd Management Data
4.5.1 Overview
4.5.2 Crowd Density Monitoring Accuracy Levels
4.5.3 Emergency Evacuation Time Benchmarks
4.5.4 Fan Behavior Analytics (Suspicious Activity Detection Rates)
4.5.5 Average Security Personnel per 1,000 Attendees
5. Stadium Security Market Segmental Analysis & Forecast, By Component, 2021 – 2032, Value (USD Billion)
5.1 Introduction
5.2 Hardware
5.2.1 Key Trends
5.2.2 Market Size & Forecast, 2021 – 2032
5.3 Software
5.3.1 Key Trends
5.3.2 Market Size & Forecast, 2021 – 2032
5.4 Services
5.4.1 Key Trends
5.4.2 Market Size & Forecast, 2021 – 2032
6. Stadium Security Market Segmental Analysis & Forecast, By Application, 2021 – 2032, Value (USD Billion)
6.1 Introduction
6.2 Event Security
6.2.1 Key Trends
6.2.2 Market Size & Forecast, 2021 – 2032
6.3 Parking Security
6.3.1 Key Trends
6.3.2 Market Size & Forecast, 2021 – 2032
6.4 Crowd Management
6.4.1 Key Trends
6.4.2 Market Size & Forecast, 2021 – 2032
6.5 Others
6.5.1 Key Trends
6.5.2 Market Size & Forecast, 2021 – 2032
7. Stadium Security Market Segmental Analysis & Forecast, By Technology, 2021 – 2032, Value (USD Billion)
7.1 Introduction
7.2 Surveillance Systems
7.2.1 Key Trends
7.2.2 Market Size & Forecast, 2021 – 2032
7.3 Access Control Systems
7.3.1 Key Trends
7.3.2 Market Size & Forecast, 2021 – 2032
7.4 Emergency and Disaster Management
7.4.1 Key Trends
7.4.2 Market Size & Forecast, 2021 – 2032
7.5 Cybersecurity
7.5.1 Key Trends
7.5.2 Market Size & Forecast, 2021 – 2032
7.6 Others
7.6.1 Key Trends
7.6.2 Market Size & Forecast, 2021 – 2032
8. Stadium Security Market Segmental Analysis & Forecast, By End-User, 2021 – 2032, Value (USD Billion)
8.1 Introduction
8.2 Sports Stadiums
8.2.1 Key Trends
8.2.2 Market Size & Forecast, 2021 – 2032
8.3 Concert Venues
8.3.1 Key Trends
8.3.2 Market Size & Forecast, 2021 – 2032
8.4 Others
8.4.1 Key Trends
8.4.2 Market Size & Forecast, 2021 – 2032
9. Stadium Security Market Segmental Analysis & Forecast, By Sales Channel, 2021 – 2032, Value (USD Billion)
9.1 Introduction
9.2 Channel Partners
9.2.1 Key Trends
9.2.2 Market Size & Forecast, 2021 – 2032
9.3 Direct Sales
9.3.1 Key Trends
9.3.2 Market Size & Forecast, 2021 – 2032
9.4 Others
9.4.1 Key Trends
9.4.2 Market Size & Forecast, 2021 – 2032
10. Stadium Security Market Segmental Analysis & Forecast By Region, 2021 – 2032, Value (USD Billion)
10.1 Introduction
10.2 North America
10.2.1 Key Trends
10.2.2 Stadium Security Market Size & Forecast, By Component, 2021 – 2032
10.2.3 Stadium Security Market Size & Forecast, By Application, 2021 – 2032
10.2.4 Stadium Security Market Size & Forecast, By Technology, 2021 – 2032
10.2.5 Stadium Security Market Size & Forecast, By End-User, 2021 – 2032
10.2.6 Stadium Security Market Size & Forecast, By Sales Channel, 2021 – 2032
10.2.7 Stadium Security Market Size & Forecast, By Country, 2021 – 2032
10.2.7.1 USA
10.2.7.1.1 Stadium Security Market Size & Forecast, By Component, 2021 – 2032
10.2.7.1.2 Stadium Security Market Size & Forecast, By Application, 2021 – 2032
10.2.7.1.3 Stadium Security Market Size & Forecast, By Technology, 2021 – 2032
10.2.7.1.4 Stadium Security Market Size & Forecast, By End-User, 2021 – 2032
10.2.7.1.5 Stadium Security Market Size & Forecast, By Sales Channel, 2021 – 2032
10.2.7.2 Canada
10.2.7.2.1 Stadium Security Market Size & Forecast, By Component, 2021 – 2032
10.2.7.2.2 Stadium Security Market Size & Forecast, By Application, 2021 – 2032
10.2.7.2.3 Stadium Security Market Size & Forecast, By Technology, 2021 – 2032
10.2.7.2.4 Stadium Security Market Size & Forecast, By End-User, 2021 – 2032
10.2.7.2.5 Stadium Security Market Size & Forecast, By Sales Channel, 2021 – 2032
10.3 Europe
10.3.1 Key Trends
10.3.2 Stadium Security Market Size & Forecast, By Component, 2021 – 2032
10.3.3 Stadium Security Market Size & Forecast, By Application, 2021 – 2032
10.3.4 Stadium Security Market Size & Forecast, By Technology, 2021 – 2032
10.3.5 Stadium Security Market Size & Forecast, By End-User, 2021 – 2032
10.3.6 Stadium Security Market Size & Forecast, By Sales Channel, 2021 – 2032
10.3.7 Stadium Security Market Size & Forecast, By Country, 2021 – 2032
10.3.7.1 Germany
10.3.7.1.1 Stadium Security Market Size & Forecast, By Component, 2021 – 2032
10.3.7.1.2 Stadium Security Market Size & Forecast, By Application, 2021 – 2032
10.3.7.1.3 Stadium Security Market Size & Forecast, By Technology, 2021 – 2032
10.3.7.1.4 Stadium Security Market Size & Forecast, By End-User, 2021 – 2032
10.3.7.1.5 Stadium Security Market Size & Forecast, By Sales Channel, 2021 – 2032
10.3.7.2 UK
10.3.7.2.1 Stadium Security Market Size & Forecast, By Component, 2021 – 2032
10.3.7.2.2 Stadium Security Market Size & Forecast, By Application, 2021 – 2032
10.3.7.2.3 Stadium Security Market Size & Forecast, By Technology, 2021 – 2032
10.3.7.2.4 Stadium Security Market Size & Forecast, By End-User, 2021 – 2032
10.3.7.2.5 Stadium Security Market Size & Forecast, By Sales Channel, 2021 – 2032
10.3.7.3 France
10.3.7.3.1 Stadium Security Market Size & Forecast, By Component, 2021 – 2032
10.3.7.3.2 Stadium Security Market Size & Forecast, By Application, 2021 – 2032
10.3.7.3.3 Stadium Security Market Size & Forecast, By Technology, 2021 – 2032
10.3.7.3.4 Stadium Security Market Size & Forecast, By End-User, 2021 – 2032
10.3.7.3.5 Stadium Security Market Size & Forecast, By Sales Channel, 2021 – 2032
10.3.7.4 Italy
10.3.7.4.1 Stadium Security Market Size & Forecast, By Component, 2021 – 2032
10.3.7.4.2 Stadium Security Market Size & Forecast, By Application, 2021 – 2032
10.3.7.4.3 Stadium Security Market Size & Forecast, By Technology, 2021 – 2032
10.3.7.4.4 Stadium Security Market Size & Forecast, By End-User, 2021 – 2032
10.3.7.4.5 Stadium Security Market Size & Forecast, By Sales Channel, 2021 – 2032
10.3.7.5 Spain
10.3.7.5.1 Stadium Security Market Size & Forecast, By Component, 2021 – 2032
10.3.7.5.2 Stadium Security Market Size & Forecast, By Application, 2021 – 2032
10.3.7.5.3 Stadium Security Market Size & Forecast, By Technology, 2021 – 2032
10.3.7.5.4 Stadium Security Market Size & Forecast, By End-User, 2021 – 2032
10.3.7.5.5 Stadium Security Market Size & Forecast, By Sales Channel, 2021 – 2032
10.3.7.6 Russia
10.3.7.6.1 Stadium Security Market Size & Forecast, By Component, 2021 – 2032
10.3.7.6.2 Stadium Security Market Size & Forecast, By Application, 2021 – 2032
10.3.7.6.3 Stadium Security Market Size & Forecast, By Technology, 2021 – 2032
10.3.7.6.4 Stadium Security Market Size & Forecast, By End-User, 2021 – 2032
10.3.7.6.5 Stadium Security Market Size & Forecast, By Sales Channel, 2021 – 2032
10.3.7.7 Poland
10.3.7.7.1 Stadium Security Market Size & Forecast, By Component, 2021 – 2032
10.3.7.7.2 Stadium Security Market Size & Forecast, By Application, 2021 – 2032
10.3.7.7.3 Stadium Security Market Size & Forecast, By Technology, 2021 – 2032
10.3.7.7.4 Stadium Security Market Size & Forecast, By End-User, 2021 – 2032
10.3.7.7.5 Stadium Security Market Size & Forecast, By Sales Channel, 2021 – 2032
10.3.7.8 Rest of Europe
10.3.7.8.1 Stadium Security Market Size & Forecast, By Component, 2021 – 2032
10.3.7.8.2 Stadium Security Market Size & Forecast, By Application, 2021 – 2032
10.3.7.8.3 Stadium Security Market Size & Forecast, By Technology, 2021 – 2032
10.3.7.8.4 Stadium Security Market Size & Forecast, By End-User, 2021 – 2032
10.3.7.8.5 Stadium Security Market Size & Forecast, By Sales Channel, 2021 – 2032
10.4 Asia-Pacific
10.4.1 Key Trends
10.4.2 Stadium Security Market Size & Forecast, By Component, 2021 – 2032
10.4.3 Stadium Security Market Size & Forecast, By Application, 2021 – 2032
10.4.4 Stadium Security Market Size & Forecast, By Technology, 2021 – 2032
10.4.5 Stadium Security Market Size & Forecast, By End-User, 2021 – 2032
10.4.6 Stadium Security Market Size & Forecast, By Sales Channel, 2021 – 2032
10.4.7 Stadium Security Market Size & Forecast, By Country, 2021 – 2032
10.4.7.1 China
10.4.7.1.1 Stadium Security Market Size & Forecast, By Component, 2021 – 2032
10.4.7.1.2 Stadium Security Market Size & Forecast, By Application, 2021 – 2032
10.4.7.1.3 Stadium Security Market Size & Forecast, By Technology, 2021 – 2032
10.4.7.1.4 Stadium Security Market Size & Forecast, By End-User, 2021 – 2032
10.4.7.1.5 Stadium Security Market Size & Forecast, By Sales Channel, 2021 – 2032
10.4.7.2 India
10.4.7.2.1 Stadium Security Market Size & Forecast, By Component, 2021 – 2032
10.4.7.2.2 Stadium Security Market Size & Forecast, By Application, 2021 – 2032
10.4.7.2.3 Stadium Security Market Size & Forecast, By Technology, 2021 – 2032
10.4.7.2.4 Stadium Security Market Size & Forecast, By End-User, 2021 – 2032
10.4.7.2.5 Stadium Security Market Size & Forecast, By Sales Channel, 2021 – 2032
10.4.7.3 Japan
10.4.7.3.1 Stadium Security Market Size & Forecast, By Component, 2021 – 2032
10.4.7.3.2 Stadium Security Market Size & Forecast, By Application, 2021 – 2032
10.4.7.3.3 Stadium Security Market Size & Forecast, By Technology, 2021 – 2032
10.4.7.3.4 Stadium Security Market Size & Forecast, By End-User, 2021 – 2032
10.4.7.3.5 Stadium Security Market Size & Forecast, By Sales Channel, 2021 – 2032
10.4.7.4 South Korea
10.4.7.4.1 Stadium Security Market Size & Forecast, By Component, 2021 – 2032
10.4.7.4.2 Stadium Security Market Size & Forecast, By Application, 2021 – 2032
10.4.7.4.3 Stadium Security Market Size & Forecast, By Technology, 2021 – 2032
10.4.7.4.4 Stadium Security Market Size & Forecast, By End-User, 2021 – 2032
10.4.7.4.5 Stadium Security Market Size & Forecast, By Sales Channel, 2021 – 2032
10.4.7.5 Australia
10.4.7.5.1 Stadium Security Market Size & Forecast, By Component, 2021 – 2032
10.4.7.5.2 Stadium Security Market Size & Forecast, By Application, 2021 – 2032
10.4.7.5.3 Stadium Security Market Size & Forecast, By Technology, 2021 – 2032
10.4.7.5.4 Stadium Security Market Size & Forecast, By End-User, 2021 – 2032
10.4.7.5.5 Stadium Security Market Size & Forecast, By Sales Channel, 2021 – 2032
10.4.7.6 ASEAN Countries
10.4.7.6.1 Stadium Security Market Size & Forecast, By Component, 2021 – 2032
10.4.7.6.2 Stadium Security Market Size & Forecast, By Application, 2021 – 2032
10.4.7.6.3 Stadium Security Market Size & Forecast, By Technology, 2021 – 2032
10.4.7.6.4 Stadium Security Market Size & Forecast, By End-User, 2021 – 2032
10.4.7.6.5 Stadium Security Market Size & Forecast, By Sales Channel, 2021 – 2032
10.4.7.7 Rest of Asia-Pacific
10.4.7.7.1 Stadium Security Market Size & Forecast, By Component, 2021 – 2032
10.4.7.7.2 Stadium Security Market Size & Forecast, By Application, 2021 – 2032
10.4.7.7.3 Stadium Security Market Size & Forecast, By Technology, 2021 – 2032
10.4.7.7.4 Stadium Security Market Size & Forecast, By End-User, 2021 – 2032
10.4.7.7.5 Stadium Security Market Size & Forecast, By Sales Channel, 2021 – 2032
10.5 Latin America
10.5.1 Key Trends
10.5.2 Stadium Security Market Size & Forecast, By Component, 2021 – 2032
10.5.3 Stadium Security Market Size & Forecast, By Application, 2021 – 2032
10.5.4 Stadium Security Market Size & Forecast, By Technology, 2021 – 2032
10.5.5 Stadium Security Market Size & Forecast, By End-User, 2021 – 2032
10.5.6 Stadium Security Market Size & Forecast, By Sales Channel, 2021 – 2032
10.5.7 Stadium Security Market Size & Forecast, By Country, 2021 – 2032
10.5.7.1 Brazil
10.5.7.1.1 Stadium Security Market Size & Forecast, By Component, 2021 – 2032
10.5.7.1.2 Stadium Security Market Size & Forecast, By Application, 2021 – 2032
10.5.7.1.3 Stadium Security Market Size & Forecast, By Technology, 2021 – 2032
10.5.7.1.4 Stadium Security Market Size & Forecast, By End-User, 2021 – 2032
10.5.7.1.5 Stadium Security Market Size & Forecast, By Sales Channel, 2021 – 2032
10.5.7.2 Argentina
10.5.7.2.1 Stadium Security Market Size & Forecast, By Component, 2021 – 2032
10.5.7.2.2 Stadium Security Market Size & Forecast, By Application, 2021 – 2032
10.5.7.2.3 Stadium Security Market Size & Forecast, By Technology, 2021 – 2032
10.5.7.2.4 Stadium Security Market Size & Forecast, By End-User, 2021 – 2032
10.5.7.2.5 Stadium Security Market Size & Forecast, By Sales Channel, 2021 – 2032
10.5.7.3 Mexico
10.5.7.3.1 Stadium Security Market Size & Forecast, By Component, 2021 – 2032
10.5.7.3.2 Stadium Security Market Size & Forecast, By Application, 2021 – 2032
10.5.7.3.3 Stadium Security Market Size & Forecast, By Technology, 2021 – 2032
10.5.7.3.4 Stadium Security Market Size & Forecast, By End-User, 2021 – 2032
10.5.7.3.5 Stadium Security Market Size & Forecast, By Sales Channel, 2021 – 2032
10.5.7.4 Colombia
10.5.7.4.1 Stadium Security Market Size & Forecast, By Component, 2021 – 2032
10.5.7.4.2 Stadium Security Market Size & Forecast, By Application, 2021 – 2032
10.5.7.4.3 Stadium Security Market Size & Forecast, By Technology, 2021 – 2032
10.5.7.4.4 Stadium Security Market Size & Forecast, By End-User, 2021 – 2032
10.5.7.4.5 Stadium Security Market Size & Forecast, By Sales Channel, 2021 – 2032
10.5.7.5 Rest of Latin America
10.5.7.5.1 Stadium Security Market Size & Forecast, By Component, 2021 – 2032
10.5.7.5.2 Stadium Security Market Size & Forecast, By Application, 2021 – 2032
10.5.7.5.3 Stadium Security Market Size & Forecast, By Technology, 2021 – 2032
10.5.7.5.4 Stadium Security Market Size & Forecast, By End-User, 2021 – 2032
10.5.7.5.5 Stadium Security Market Size & Forecast, By Sales Channel, 2021 – 2032
10.6 Middle East & Africa
10.6.1 Key Trends
10.6.2 Stadium Security Market Size & Forecast, By Component, 2021 – 2032
10.6.3 Stadium Security Market Size & Forecast, By Application, 2021 – 2032
10.6.4 Stadium Security Market Size & Forecast, By Technology, 2021 – 2032
10.6.5 Stadium Security Market Size & Forecast, By End-User, 2021 – 2032
10.6.6 Stadium Security Market Size & Forecast, By Sales Channel, 2021 – 2032
10.6.7 Stadium Security Market Size & Forecast, By Country, 2021 – 2032
10.6.7.1 UAE
10.6.7.1.1 Stadium Security Market Size & Forecast, By Component, 2021 – 2032
10.6.7.1.2 Stadium Security Market Size & Forecast, By Application, 2021 – 2032
10.6.7.1.3 Stadium Security Market Size & Forecast, By Technology, 2021 – 2032
10.6.7.1.4 Stadium Security Market Size & Forecast, By End-User, 2021 – 2032
10.6.7.1.5 Stadium Security Market Size & Forecast, By Sales Channel, 2021 – 2032
10.6.7.2 Saudi Arabia
10.6.7.2.1 Stadium Security Market Size & Forecast, By Component, 2021 – 2032
10.6.7.2.2 Stadium Security Market Size & Forecast, By Application, 2021 – 2032
10.6.7.2.3 Stadium Security Market Size & Forecast, By Technology, 2021 – 2032
10.6.7.2.4 Stadium Security Market Size & Forecast, By End-User, 2021 – 2032
10.6.7.2.5 Stadium Security Market Size & Forecast, By Sales Channel, 2021 – 2032
10.6.7.3 Qatar
10.6.7.3.1 Stadium Security Market Size & Forecast, By Component, 2021 – 2032
10.6.7.3.2 Stadium Security Market Size & Forecast, By Application, 2021 – 2032
10.6.7.3.3 Stadium Security Market Size & Forecast, By Technology, 2021 – 2032
10.6.7.3.4 Stadium Security Market Size & Forecast, By End-User, 2021 – 2032
10.6.7.3.5 Stadium Security Market Size & Forecast, By Sales Channel, 2021 – 2032
10.6.7.4 Egypt
10.6.7.4.1 Stadium Security Market Size & Forecast, By Component, 2021 – 2032
10.6.7.4.2 Stadium Security Market Size & Forecast, By Application, 2021 – 2032
10.6.7.4.3 Stadium Security Market Size & Forecast, By Technology, 2021 – 2032
10.6.7.4.4 Stadium Security Market Size & Forecast, By End-User, 2021 – 2032
10.6.7.4.5 Stadium Security Market Size & Forecast, By Sales Channel, 2021 – 2032
10.6.7.5 South Africa
10.6.7.5.1 Stadium Security Market Size & Forecast, By Component, 2021 – 2032
10.6.7.5.2 Stadium Security Market Size & Forecast, By Application, 2021 – 2032
10.6.7.5.3 Stadium Security Market Size & Forecast, By Technology, 2021 – 2032
10.6.7.5.4 Stadium Security Market Size & Forecast, By End-User, 2021 – 2032
10.6.7.5.5 Stadium Security Market Size & Forecast, By Sales Channel, 2021 – 2032
10.6.7.6 Rest of Middle East & Africa
10.6.7.6.1 Stadium Security Market Size & Forecast, By Component, 2021 – 2032
10.6.7.6.2 Stadium Security Market Size & Forecast, By Application, 2021 – 2032
10.6.7.6.3 Stadium Security Market Size & Forecast, By Technology, 2021 – 2032
10.6.7.6.4 Stadium Security Market Size & Forecast, By End-User, 2021 – 2032
10.6.7.6.5 Stadium Security Market Size & Forecast, By Sales Channel, 2021 – 2032
11. Competitive Landscape
11.1 Key Players' Positioning
11.2 Competitive Developments
11.2.1 Key Strategies Adopted (%), By Key Players, 2024
11.2.2 Year-Wise Strategies & Development, 2021 – 2025
11.2.3 Number Of Strategies Adopted By Key Players, 2024
11.3 Market Share Analysis, 2024
11.4 Product/Service & Application Benchmarking
11.4.1 Product/Service Specifications & Features By Key Players
11.4.2 Product/Service Heatmap By Key Players
11.4.3 Application Heatmap By Key Players
11.5 Industry Start-Up & Innovation Landscape
11.6 Key Company Profiles
11.6.1 Avigilon Corporation
11.6.1.1 Company Overview & Snapshot
11.6.1.2 Product/Service Portfolio
11.6.1.3 Key Company Financials
11.6.1.4 SWOT Analysis
11.6.2 AxxonSoft
11.6.2.1 Company Overview & Snapshot
11.6.2.2 Product/Service Portfolio
11.6.2.3 Key Company Financials
11.6.2.4 SWOT Analysis
11.6.3 BOSCH Security Systems
11.6.3.1 Company Overview & Snapshot
11.6.3.2 Product/Service Portfolio
11.6.3.3 Key Company Financials
11.6.3.4 SWOT Analysis
11.6.4 Genetec Inc.
11.6.4.1 Company Overview & Snapshot
11.6.4.2 Product/Service Portfolio
11.6.4.3 Key Company Financials
11.6.4.4 SWOT Analysis
11.6.5 Dallmeier
11.6.5.1 Company Overview & Snapshot
11.6.5.2 Product/Service Portfolio
11.6.5.3 Key Company Financials
11.6.5.4 SWOT Analysis
11.6.6 Honeywell International Inc.
11.6.6.1 Company Overview & Snapshot
11.6.6.2 Product/Service Portfolio
11.6.6.3 Key Company Financials
11.6.6.4 SWOT Analysis
11.6.7 NEC Corporation
11.6.7.1 Company Overview & Snapshot
11.6.7.2 Product/Service Portfolio
11.6.7.3 Key Company Financials
11.6.7.4 SWOT Analysis
11.6.8 Rapiscan Systems
11.6.8.1 Company Overview & Snapshot
11.6.8.2 Product/Service Portfolio
11.6.8.3 Key Company Financials
11.6.8.4 SWOT Analysis
11.6.9 Cisco Systems Inc.
11.6.9.1 Company Overview & Snapshot
11.6.9.2 Product/Service Portfolio
11.6.9.3 Key Company Financials
11.6.9.4 SWOT Analysis
11.6.10 Intel Corporation
11.6.10.1 Company Overview & Snapshot
11.6.10.2 Product/Service Portfolio
11.6.10.3 Key Company Financials
11.6.10.4 SWOT Analysis
11.6.11 IBM
11.6.11.1 Company Overview & Snapshot
11.6.11.2 Product/Service Portfolio
11.6.11.3 Key Company Financials
11.6.11.4 SWOT Analysis
11.6.12 Johnson Controls International plc
11.6.12.1 Company Overview & Snapshot
11.6.12.2 Product/Service Portfolio
11.6.12.3 Key Company Financials
11.6.12.4 SWOT Analysis
11.6.13 Axis Communications AB
11.6.13.1 Company Overview & Snapshot
11.6.13.2 Product/Service Portfolio
11.6.13.3 Key Company Financials
11.6.13.4 SWOT Analysis
11.6.14 Siemens AG
11.6.14.1 Company Overview & Snapshot
11.6.14.2 Product/Service Portfolio
11.6.14.3 Key Company Financials
11.6.14.4 SWOT Analysis
11.6.15 GP Smart Stadium
11.6.15.1 Company Overview & Snapshot
11.6.15.2 Product/Service Portfolio
11.6.15.3 Key Company Financials
11.6.15.4 SWOT Analysis
11.6.16 L3Harris Technologies Inc.
11.6.16.1 Company Overview & Snapshot
11.6.16.2 Product/Service Portfolio
11.6.16.3 Key Company Financials
11.6.16.4 SWOT Analysis
11.6.17 FLIR Systems Inc.
11.6.17.1 Company Overview & Snapshot
11.6.17.2 Product/Service Portfolio
11.6.17.3 Key Company Financials
11.6.17.4 SWOT Analysis
11.6.18 Verint Systems Inc.
11.6.18.1 Company Overview & Snapshot
11.6.18.2 Product/Service Portfolio
11.6.18.3 Key Company Financials
11.6.18.4 SWOT Analysis
11.6.19 Smiths Detection Inc.
11.6.19.1 Company Overview & Snapshot
11.6.19.2 Product/Service Portfolio
11.6.19.3 Key Company Financials
11.6.19.4 SWOT Analysis
11.6.20 Pelco
11.6.20.1 Company Overview & Snapshot
11.6.20.2 Product/Service Portfolio
11.6.20.3 Key Company Financials
11.6.20.4 SWOT Analysis
12. Analyst Recommendations
12.1 SNS Insider Opportunity Map
12.2 Industry Low-Hanging Fruit Assessment
12.3 Market Entry & Growth Strategy
12.4 Analyst Viewpoint & Suggestions On Market Growth
13. Assumptions
14. Disclaimer
15. Appendix
15.1 List Of Tables
15.2 List Of Figures
Key Segments:
By Component
-
Hardware
-
Software
-
Services
By Technology
-
Surveillance Systems
-
Access Control Systems
-
Emergency and Disaster Management
-
Cybersecurity
-
Others
By Application
-
Event Security
-
Parking Security
-
Crowd Management
-
Others
By End-User
-
Sports Stadiums
-
Concert Venues
-
Others
By Sales Channel
-
Channel Partners
-
Direct Sales
-
Others
Request for Segment Customization as per your Business Requirement: Segment Customization Request
Regional Coverage:
North America
-
US
-
Canada
Europe
-
Germany
-
France
-
UK
-
Italy
-
Spain
-
Poland
-
Russia
-
Rest of Europe
Asia Pacific
-
China
-
India
-
Japan
-
South Korea
-
Australia
-
ASEAN Countries
-
Rest of Asia Pacific
Middle East & Africa
-
UAE
-
Saudi Arabia
-
Qatar
-
South Africa
-
Rest of Middle East & Africa
Latin America
-
Brazil
-
Argentina
-
Mexico
-
Colombia
-
Rest of Latin America
Request for Country Level Research Report: Country Level Customization Request
Available Customization
With the given market data, SNS Insider offers customization as per the company’s specific needs. The following customization options are available for the report:
-
Detailed Volume Analysis
-
Criss-Cross segment analysis (e.g. Product X Application)
-
Competitive Product Benchmarking
-
Geographic Analysis
-
Additional countries in any of the regions
-
Customized Data Representation
-
Detailed analysis and profiling of additional market players
An accurate research report requires proper strategizing as well as implementation. There are multiple factors involved in the completion of good and accurate research report and selecting the best methodology to compete the research is the toughest part. Since the research reports we provide play a crucial role in any company’s decision-making process, therefore we at SNS Insider always believe that we should choose the best method which gives us results closer to reality. This allows us to reach at a stage wherein we can provide our clients best and accurate investment to output ratio.
Each report that we prepare takes a timeframe of 350-400 business hours for production. Starting from the selection of titles through a couple of in-depth brain storming session to the final QC process before uploading our titles on our website we dedicate around 350 working hours. The titles are selected based on their current market cap and the foreseen CAGR and growth.
The 5 steps process:
Step 1: Secondary Research:
Secondary Research or Desk Research is as the name suggests is a research process wherein, we collect data through the readily available information. In this process we use various paid and unpaid databases which our team has access to and gather data through the same. This includes examining of listed companies’ annual reports, Journals, SEC filling etc. Apart from this our team has access to various associations across the globe across different industries. Lastly, we have exchange relationships with various university as well as individual libraries.

Step 2: Primary Research
When we talk about primary research, it is a type of study in which the researchers collect relevant data samples directly, rather than relying on previously collected data. This type of research is focused on gaining content specific facts that can be sued to solve specific problems. Since the collected data is fresh and first hand therefore it makes the study more accurate and genuine.
We at SNS Insider have divided Primary Research into 2 parts.
Part 1 wherein we interview the KOLs of major players as well as the upcoming ones across various geographic regions. This allows us to have their view over the market scenario and acts as an important tool to come closer to the accurate market numbers. As many as 45 paid and unpaid primary interviews are taken from both the demand and supply side of the industry to make sure we land at an accurate judgement and analysis of the market.
This step involves the triangulation of data wherein our team analyses the interview transcripts, online survey responses and observation of on filed participants. The below mentioned chart should give a better understanding of the part 1 of the primary interview.

Part 2: In this part of primary research the data collected via secondary research and the part 1 of the primary research is validated with the interviews from individual consultants and subject matter experts.
Consultants are those set of people who have at least 12 years of experience and expertise within the industry whereas Subject Matter Experts are those with at least 15 years of experience behind their back within the same space. The data with the help of two main processes i.e., FGDs (Focused Group Discussions) and IDs (Individual Discussions). This gives us a 3rd party nonbiased primary view of the market scenario making it a more dependable one while collation of the data pointers.
Step 3: Data Bank Validation
Once all the information is collected via primary and secondary sources, we run that information for data validation. At our intelligence centre our research heads track a lot of information related to the market which includes the quarterly reports, the daily stock prices, and other relevant information. Our data bank server gets updated every fortnight and that is how the information which we collected using our primary and secondary information is revalidated in real time.

Step 4: QA/QC Process
After all the data collection and validation our team does a final level of quality check and quality assurance to get rid of any unwanted or undesired mistakes. This might include but not limited to getting rid of the any typos, duplication of numbers or missing of any important information. The people involved in this process include technical content writers, research heads and graphics people. Once this process is completed the title gets uploader on our platform for our clients to read it.
Step 5: Final QC/QA Process:
This is the last process and comes when the client has ordered the study. In this process a final QA/QC is done before the study is emailed to the client. Since we believe in giving our clients a good experience of our research studies, therefore, to make sure that we do not lack at our end in any way humanly possible we do a final round of quality check and then dispatch the study to the client.