Styrenics Market Size & Overview
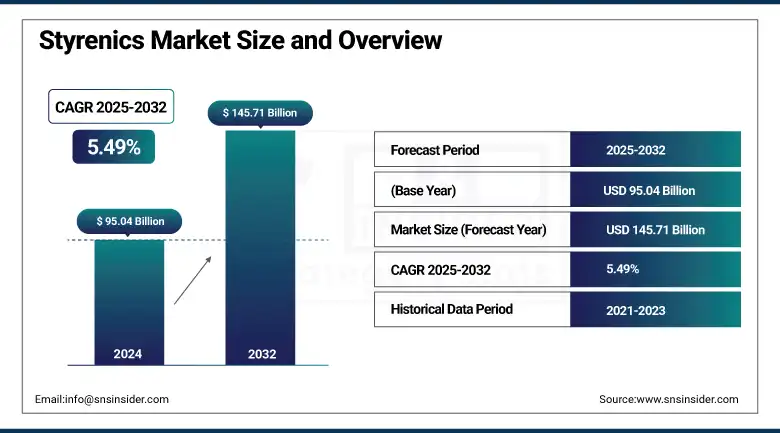
The Styrenics Market size was USD 95.04 billion in 2024 and is expected to reach USD 145.71 billion by 2032, growing at a CAGR of 5.49% over the forecast period of 2025-2032.
Styrenics market analysis highlights that the expansion of construction and infrastructure projects is a key driver of market growth. The rise in styrenic consumption is substantially driven by ongoing developments in the construction & infrastructure sectors. In particular, Expanded Polystyrene (EPS) and Acrylonitrile Butadiene Styrene (ABS), styrenic materials, are widely utilized in the building industry as a result of their excellent insulation properties, durability, and lightweight nature. EPS is used in wall insulation systems, roofing systems, and concrete formwork, making construction energy-efficient and economical. A growing number of governments around the world are directing investments into sustainable infrastructure, smart cities, and housing, especially in emerging economies such as China, India, and Southeast Asia, and that has certainly spurred the uptake of styrenics, which are high-performance materials.
To Get more information On Styrenics Market - Request Free Sample Report
The U.S. Census Bureau estimates that the seasonally adjusted annual rate of construction spending in March 2025 was USD 2,195.4 billion, which is 2.8 percent above the March 2024 estimate of USD 2,135.8 billion. Hence, the positive trajectory reflects the strong construction activity in both residential and commercial sectors. With a continued injection of funds by governments and private enterprises into infrastructure building, the requirement for high-performance materials such as styrenics will continue to grow, which will continue to cement styrenics as building blocks of any modern-day construction.
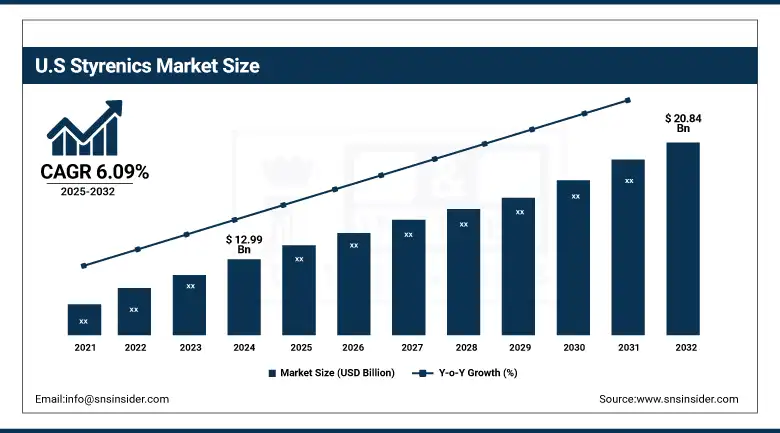
U.S Styrenics market size was USD 12.99 billion in 2024 and is expected to reach USD 20.84 billion by 2032 and grow at a CAGR of 6.09% over the forecast period of 2025-2032. It is owing to mature industrial base, high demand for consumer electronics, automotive production, and infrastructural developments in the U.S. In South Korea, where its chemical and plastics industries are well established, production and innovation of styrenics such as ABS, SAN, and EPS, primarily used for automotive parts, electronic housings, packaging, and construction applications, is driven by local demand. In addition, electric vehicle adoption initiatives, government incentives, government support for sustainable manufacturing, and the need for lightweight and durable styrenic materials universally bolster the growth of the styrenic materials market.
Styrenics Market Dynamics
Drivers
-
Increase in consumer electronics drives the market growth.
The growing consumption of consumer electronics is one of the major factors that drive the styrenics market, as these polymers are key components in the design and function of many electronic products. Styrenics, such as Acrylonitrile Butadiene Styrene (ABS), Styrene-Acrylonitrile (SAN), and Thermoplastic Polymers, are a common polymer for product housings, casings, and internal components for products like smartphones, laptops, televisions, and home appliances. Because of these properties (stability, high impact resistance, low weight, and high molding quality), they are used as the most suitable material for complex electronic parts. With the expanding consumer preference for fast, portable, and multifunctional devices, manufacturers are turning more towards innovative plastics, specifically styrenics, as a high-performance, economical, and visually appealing solution, which drives the styrenics market growth.
Consumer spending in this sector remained strong, as evidenced by U.S. Census Bureau data showing retail sales rising 2.3% in October 2024 from September at electronics and appliance stores. In other news, real GDP rose 2.8% in 2024, according to the Bureau of Economic Analysis, driven by upturns in consumer spending, business investment, government spending, and exports.
Restrain
-
Competition from biodegradable alternatives may hamper the market growth.
The increasing trend of using eco-friendly materials is proving to be a major hurdle for the styrenics market. With rising concern around plastic pollution and the degradation of earth resources worldwide, there is a growing trend amongst consumers, governments, and industries to prefer biodegradable and compostable alternative materials to traditional petrochemical-based plastics, such as styrenics. PLA, PHA, and other bio-based materials are gaining some momentum in various packaging and disposable applications where environmental footprint is a particular concern. Also, regulatory pressures like prohibitions on single-use plastics and the rewards for utilizing biodegradable products are fast-tracking this transition. It can be seen that this change is most clearly in industries such as food packaging, retail, and consumer products, where styrenics companies are feeling the squeeze to implement greener alternatives.
Opportunities
-
Integration with Electric Vehicles (EVs) creates opportunities in the market.
Expansion of Electric Vehicles (EVs) into the global transport landscape represents a key opportunity for the styrenics market. Commonly used in EV components, styrenic polymers like Acrylonitrile Butadiene Styrene (ABS) and Styrene-Ethylene-Butylene-Styrene (SEBS) are low-density polymers characterized by many excellent properties such as high impact, toughness, and superior surface finishing. It said these are suitable for manufacturing interior components such as dashboards, trims, control panels, and battery enclosures, where the lower weight and design flexibility are essential to lowering the weight and range of the vehicle, which are both important for EVs. As governments around the globe are imposing increasingly stringent emission regulations and providing incentives to help accelerate EV adoption, OEMs are looking even more to advanced plastics such as styrenics to meet design and performance requirements and lightweight vehicles, which drive the styrenics market trends.
In 2024 in the US, more than 1.5 million plug-in electric vehicles (PEVs) were sold, for a year-over-year increase of 8%, according to the U.S. Department of Energy's Argonne National Laboratory. In 2024, PEVs represented 9.9% of total light-duty vehicle sales; battery electric vehicles (BEVs) made up more than 80% of PEV sales. The increase in EV adoption flows through the long-term demand for styrenics and other materials used in EVs.
Additionally, the Department of Energy will invest USD 3 billion to fund 25 projects in 14 states that manufacture batteries and battery materials, with the projects expected to create USD 16 billion of investment and 12,000 jobs as a result of expanding U.S. production of advanced battery systems.
Styrenics Market Segmentation Analysis
By Type
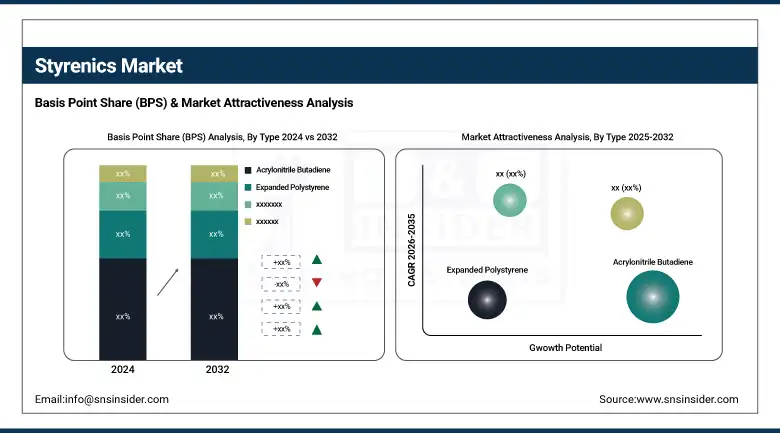
Acrylonitrile Butadiene held the largest styrenics market share, around 38%, in 2024. It is due to its low density, high dimensional stability, and suitability for molding into complex shapes, ABS is widely used in automotive, consumer electronics, appliances, and construction. ABS is used for both interior and exterior components for vehicles and is preferred in the automotive sector as it helps reduce the weight of the vehicle, which allows for improved fuel efficiency, both critical for electric and fuel-efficient vehicles. Particularly in electronics, this is mostly due to its physical characteristics, such as thermal and electrical properties, heat and shock resistance, as well as its ability to withstand minor mechanical stress, ideal for housings and parts inside laptops, smartphones, and televisions.
Expanded Polystyrene held a significant Styrenics market share, owing to the high insulation efficiency, lightweight, and economic properties of expanded polystyrene, which makes it a suitable choice for several sectors. EPS is widely used in the building industry for thermal insulation in walls, roofs, and ground floors, helping to create energy-efficient and sustainable buildings. The Superior cushioning and shock absorption of this material also makes it perfect for protective packaging, which is a part of many industries such as electronics, food, and medical. Additionally, the advantages offered by EPS, such as simple production, recyclability, and mouldability into various forms and dimensions, are making it more frequently used.
By End-use Industry
Automotive held the largest market share, around 28%, in 2024. It is owing to the increasing need for lightweight, sturdy, and economical materials, which contribute to improved vehicle performance and overall fuel efficiency. A wide range of automotive components utilize styrenic polymers, especially Acrylonitrile Butadiene Styrene (ABS), which are vital in the production of dashboards and other interior trims, bumpers and other exterior parts, and under-the-hood parts. These materials have good impact strength, heat resistance, and processability, ideal for complicated automotive part configurations.
Electrical and electronics hold a significant market share in the Styrenics market. It is due to widely used in the production of durable, lightweight, and heat-resistant components for domestic appliances, consumer & office electronics, and other electronic devices. Consumer electronics such as smartphones, laptops, televisions, and home appliances often use plastic components like Acrylonitrile Butadiene Styrene (ABS) and Styrene-Acrylonitrile (SAN) for housings, casings, connectors, and internal parts. These polymers are great for electrical insulating characteristics, impact resistance, and are easily capable of being molded, all critical to the ability to achieve safe, reliable, and flexible designs in these devices.
Styrenics Market Regional Outlook
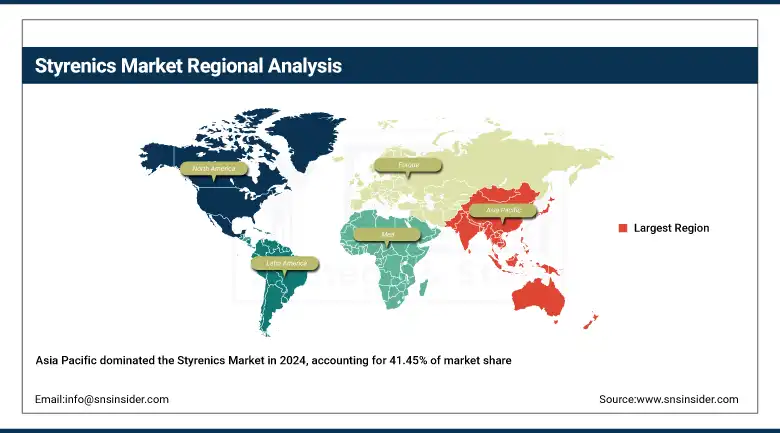
Asia Pacific held the largest market share, around 41.45%, in 2024. It is due to its varied end-use application base, a well-established growth platform, and support from key sectors such as automobile, electronics, construction, and the food and packaging industry. As major production centers for electronics and automotive solutions, countries such as China, Japan, South Korea, and India utilize styrenic polymers, including ABS and EPS, for their versatility, durability, and cost-efficiency. The consumption of styrenics in the world, particularly in China, is mainly due to the huge scale of manufacturing, protective government policies, and rising domestic consumption of styrenics. Moreover, the presence of high availability of raw materials and cheaper production costs has attracted major international players to establish their production facilities in the region.
Get Customized Report as per Your Business Requirement - Enquiry Now
In April 2023, Sinopec subsidiary Hainan Baling Chemical New Material, Ltd. started its new Styrene-Butadiene Copolymer (SBC) production line in Hainan, China. The plant operates with an investment of CNY 1.924 billion, and it is a 170,000 tons per annum facility, and the largest SBC plant in the world. The thirteen-unit plant includes refinery, polymerization, coalescence, recycling, and post-treatment processes addressing the increasing regional demand.
North America styrenics market held a significant market share and is the fastest-growing segment in the forecast period. It is owing to a large share of the country in advanced manufacturing infrastructure, coupled with a high consumer base for consumer electronics and packaging materials, as well as the presence of a large number of end-use industries, such as automotive, construction, and healthcare. This is due to the presence of well-established players in the region, technological innovation, and increasing adoption of lightweight and high-performance materials such as ABS, EPS, and SAN. Steady demand is further driven by increasing investments in electromobility (EVs), green building, and medical technology markets, as styrenics find applications in medical devices and packaging (healthcare).
In February 2024, Kraton Corporation announced a USD 35 million investment to expand the current capacity of its crude tall oil biorefinery towers at its Panama City, Florida site. It is the latest in production upgrading for styrenic block copolymers to meet the sustainable development goals of this producer.
Europe held a significant market share in the forecast period. It is owing to a strong industrial base, strict environmental regulations, and mega key players focused on innovation and sustainability. Styrenic polymers such as ABS, SAN, and EPS are lightweight, hard, and recyclable, which increases their demand in the automotive, electronics, and construction sectors due to the well-established advanced industries in the region. The focus of European governments towards the use of Eco-friendly raw materials and circular economy activities encourages manufacturers to adopt Green styrenic products and thus boosts the market growth. In addition to this, the established infrastructure, along with rising investments in green building & packaging solutions, will also drive styrenics industry over the forecast period.
Key Players
Dow Chemical Company, BASF SE, INEOS Styrolution, SABIC, Chevron Phillips Chemical Company, LG Chem, Trinseo, TotalEnergies, Formosa Plastics Corporation, Mitsubishi Chemical Corporation.
Recent Development:
-
In 2024, INEOS Styrolution launched its NAS ECO series with BASF´s biomass-balanced styrene. The new ISCC+ certified line contains styrenics, including SMMA (styrene methyl methacrylate), thereby contributing to the company's ambition of lower carbon and circular economy.
-
In 2023, BASF partnered with SABIC and Linde for a commercially sized demonstration plant for electrically heated steam cracker furnaces at the company’s Ludwigshafen site. The project will reduce CO₂ emissions by at least 90% by replacing natural gas in the initial integrated process with renewable electricity, and is sponsored by the German Federal Ministry for Economic Affairs and Climate Action.
| Report Attributes | Details |
|---|---|
| Market Size in 2024 | USD 95.04 Billion |
| Market Size by 2032 | USD 145.71 Billion |
| CAGR | CAGR of 5.49% From 2025 to 2032 |
| Base Year | 2024 |
| Forecast Period | 2025-2032 |
| Historical Data | 2021-2023 |
| Report Scope & Coverage | Market Size, Segments Analysis, Competitive Landscape, Regional Analysis, DROC & SWOT Analysis, Forecast Outlook |
| Key Segments | •By Type (Polystyrene, Acrylonitrile Butadiene, Expanded Polystyrene, Styrene-Butadiene Rubber, Unsaturated Polyester Resin) •By End-Use Industry (Automotive, Packaging, Construction, Electrical and Electronics, Medical, Wind Energy, Consumer Goods) |
| Regional Analysis/Coverage | North America (US, Canada, Mexico), Europe (Germany, France, UK, Italy, Spain, Poland, Turkey, Rest of Europe), Asia Pacific (China, India, Japan, South Korea, Singapore, Australia, Rest of Asia Pacific), Middle East & Africa (UAE, Saudi Arabia, Qatar, South Africa, Rest of Middle East & Africa), Latin America (Brazil, Argentina, Rest of Latin America) |
| Company Profiles | Dow Chemical Company, BASF SE, INEOS Styrolution, SABIC, Chevron Phillips Chemical Company, LG Chem, Trinseo, TotalEnergies, Formosa Plastics Corporation, Mitsubishi Chemical Corporation |
Frequently Asked Questions
Asia Pacific led the Styrenics Market in the region with the highest revenue share in 2024.
An Increase in consumer electronics drives the market growth.
Acrylonitrile Butadiene will grow rapidly in the Styrenics Market from 2025 to 2032.
The expected CAGR of the global Styrenics Market during the forecast period is 5.49%
The Styrenics Market was valued at USD 95.04 billion in 2024.
Get in Touch
