Surveillance Radars Market Report Scope & Overview:
To get more information on Surveillance Radars Market - Request Free Sample Report
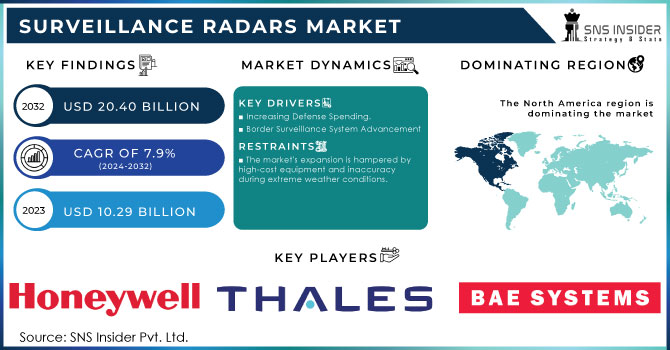
The Surveillance Radars Market Size was valued at USD 10.29 billion in 2023 and is expected to reach USD 20.40 billion by 2032 with a growing CAGR of 7.9% over the forecast period 2024-2032.
Surveillance Radars are used to monitor a variety of activities across critical infrastructure and installations such as airports, camps, borders, and ports. These radars are used to detect and track non-linear and non-linear, as well as moving country security regulations. In addition, it is used to improve perimeter safety in all commercial and defense sectors. These radar systems can operate in all areas including land, ships, airplanes, and space. Radar monitoring is an integral part of border security operations within the security sector. The majority of the surveillance radars operate in S-Band frequency band. These programme are used to find and apply for jobs. In addition, surveillance radars can be used in airports and maritime safety applications to test a wide range of targeted objects including aircraft, ultralights, rambles, non-aircraft vehicles , and vacant air systems , helicopters, boats, and ships. Surveillance radar therefore provides extensive military and defense support during their strategic mission in unknown areas acting as their eyes.
MARKET DYNAMICS
KEY DRIVERS
-
Increasing Defense Spending.
-
Border Surveillance System Advancement
RESTRAINTS
-
The market's expansion is hampered by high-cost equipment and inaccuracy during extreme weather conditions.
OPPORTUNITIES
-
Investing more in advanced surveillance technology
-
Governments all across the world are working to create stealth aircraft.
CHALLENGES
-
Regulatory issues for sales to international customers
-
Terrorists may be able to develop weapons using advanced technologies by reverse engineering of weapons and systems.
IMPACT OF COVID-19
Governments in all major countries have announced work cuts over the COVID-19 epidemic that has led to the suspension of businesses. This has led to disruptions in the production of defense equipment. In addition, due to the economic downturn and increased focus on health budgets many countries have reduced their defense budget thus undermining the need for surveillance radars. In addition, commercial airlines have had a negative impact as a result of the epidemic which also affected their need for surveillance radars. In addition, due to the closure of the area there has been a lack of maturity required for making radar monitoring hardware. In addition, due to social distance and travel restrictions, there has been a lack of skilled work required to develop surveillance radar software. Defense is a emerging sector that has experienced a slight decline due to the epidemic, but it is expected to reverse the epidemic and drive the growth of the radars market.
Digital Signal Processors are predicted to hold the biggest market share by component throughout the forecasted period. The digital signal processor operates as a computer, performing all command and control functions using signal processing. Previously, systems relied on analogue signal processing techniques. High-end processors, such as Field Programmable Gated Array, Graphics Processing Unit, and general-purpose processors, are used in the latest digital signal processing. Antennas The segment dominated the radar surveillance market in 2022. The antenna transmits the transmission power in the required way. This process is done the same at the time of acceptance. The antenna used can be a parabolic display, planar array, or arrays orally guided electrically. The antenna is an integral part of the radar system. Transmitters The segment is expected to witness high growth during the forecast period, 2022 to 2028. The radar transmitter produces short-term high power pulses indicated by the antenna. Transmitters include power amplifiers such as klystrons, magnetic oscillators, and rotating tubes. The signal is first produced using a waveform generator and amplified by a power amplifier. Duplexers Part is expected to register the highest CAGR at the time of forecasting. The duplexer switches the antenna between the transmitter and receiver so that only one pole can be used. This switch is necessary as high-power pulses of the transmitter can damage the receiver. The duplexer allows the rainbow to be used both as a transmitter and receiver. Receivers The segment is expected to witness steady growth during the forecast period, 2022 to 2028. The receiver amplifies and lowers the received RF signals and generates the video signal. Radar sensor systems use super heterodyne receivers and any other receivers that can process and receive signals. Land The segment dominated the radar surveillance market in 2022.
Earth-based radar systems are widely used for border patrols, to protect critical infrastructure, and to protect military bases. Naval The segment is expected to see high growth during the forecast period, 2022 to 2028. This is because military organizations all around the world are increasingly using marine surveillance radar equipment. Airborne Part is expected to register the highest CAGR at the time of forecasting. Airborne radar systems use unmanned aerial vehicles, aerostat, and helicopters. Sensors installed on these platforms detect and monitor, record, and analyze activity on the ground.
Space The segment is expected to witness steady growth during the forecast period, 2022 to 2028. Space-based surveillance systems provide intelligence and intelligence capabilities.
KEY MARKET SEGMENTATION
By Platform
-
Land
-
Airborne
-
Naval
-
Space
By Component
-
Antennas
-
Transmitters
-
Duplexer
-
Power Amplifiers
-
Receivers
-
Signal Processors
-
Cameras
-
Others
By Application
-
Commercial
-
National Security
-
Defense
-
Space
By Radar Type
-
Short Range Surveillance Radar
-
Medium Range Surveillance Radar
-
Long-Range Surveillance
REGIONAL ANALYSIS:
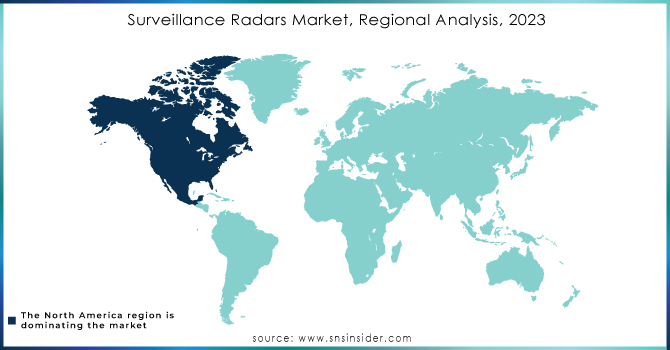
The Surveillance Radar market in North America has the largest market share During the projected period. The North American surveillance radars market is predicted to increase significantly during the forecast period, owing to continuing modernization of aircraft, ships, and border surveillance systems, among other things. Cross-border wars, high rates of illegal immigration, and drug trafficking have prompted the US Department of Homeland Security to spend extensively in border security and detection technologies. US Customs and Border Protection has begun building watch towers along the Texas border.
Need any customization research on Surveillance Radars Market - Enquiry Now
REGIONAL COVEREGE:
-
North America
-
USA
-
Canada
-
Mexico
-
-
Europe
-
Germany
-
UK
-
France
-
Italy
-
Spain
-
The Netherlands
-
Rest of Europe
-
-
Asia-Pacific
-
Japan
-
south Korea
-
China
-
India
-
Australia
-
Rest of Asia-Pacific
-
-
The Middle East & Africa
-
Israel
-
UAE
-
South Africa
-
Rest of Middle East & Africa
-
-
Latin America
-
Brazil
-
Argentina
-
Rest of Latin America
-
KEY PLAYERS
The najor Players are Thales Group, Honeywell International Inc., BAE Systems, Israel Aerospace industries Ltd, Leonardo S.P.A, Lockheed Martin Corporation, Raytheon Technologies, Saab AB, Elbit Systems Ltd, FLIR Systems Ltd, and other players
| Report Attributes | Details |
|---|---|
| Market Size in 2023 | US$ 10.29 Billion |
| Market Size by 2032 | US$ 20.40 Billion |
| CAGR | CAGR of 7.9% From 2024 to 2032 |
| Base Year | 2023 |
| Forecast Period | 2024-2032 |
| Historical Data | 2020-2022 |
| Report Scope & Coverage | Market Size, Segments Analysis, Competitive Landscape, Regional Analysis, DROC & SWOT Analysis, Forecast Outlook |
| Key Segments | • By Component (Antennas, Transmitters, Duplexer, Power Amplifiers, Receivers, Signal Processors, Cameras, and Others) • By Radar Type (Short Range Surveillance Radar, Medium Range Surveillance Radar, and Long-Range Surveillance) • By Application (Commercial, National Security, Defense & Space) • By Platform (Land, Airborne, Naval, and Space) |
| Regional Analysis/Coverage | North America (USA, Canada, Mexico), Europe (Germany, UK, France, Italy, Spain, Netherlands, Rest of Europe), Asia-Pacific (Japan, South Korea, China, India, Australia, Rest of Asia-Pacific), The Middle East & Africa (Israel, UAE, South Africa, Rest of Middle East & Africa), Latin America (Brazil, Argentina, Rest of Latin America) |
| Company Profiles | Thales Group, Honeywell International Inc., BAE Systems, Israel Aerospace industries Ltd, Leonardo S.P.A, Lockheed Martin Corporation, Raytheon Technologies, Saab AB, Elbit Systems Ltd, FLIR Systems Ltd, and other players. |
| DRIVERS | • Increasing Defense Spending. • Border Surveillance System Advancement |
| RESTRAINTS | • The market's expansion is hampered by high-cost equipment and inaccuracy during extreme weather conditions. |
Get in Touch
