Global Chemical Market Report Scope & Overview:
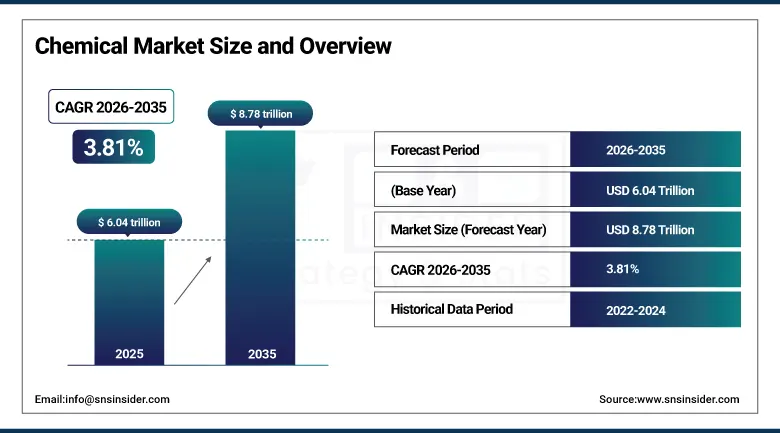
The Global Chemical Market was valued at USD 6.04 Trillion in 2025 and is expected to reach USD 8.78 Trillion by 2035, growing at a CAGR of 3.81% from 2026–2035.
Global Chemical Market growth is fueled by the increase in globalization, industrialization, urbanization, and high demand from the major end-user industries, including agriculture, pharma & health care, construction, automotive, and manufacturing. The increasing population and food security concerns have increased the use of fertilizers and chemicals in agriculture. Meanwhile, the growth in the field of health care industry has been creating an increasing demand for specialty chemicals. Further, expansion in the automotive industry has also been supporting the demand for petrochemicals. Moreover, sustainable chemistry and technological improvements in chemical processes have been adding value to market growth.
Agriculture consumes more than 200 million metric tons of fertilizers annually, driven by the need to feed a global population exceeding 8 billion people.
Market Size and Forecast
-
Market Size in 2026E: USD 6.04 Trillion
-
Market Size by 2035: USD 8.78 Trillion
-
CAGR: 3.81% from 2026 to 2035
-
Fastest Growing Region: North America
-
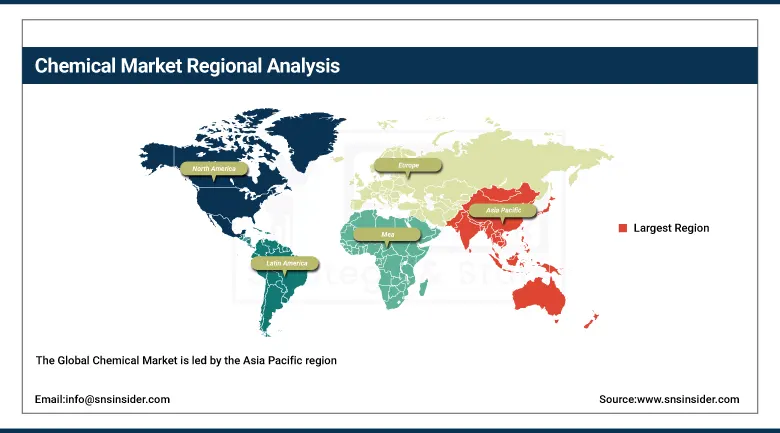
Largest Region: Asia Pacific
To Get more information on Chemical Market - Request Free Sample Report
Global Chemical Market Trends
-
Rapid expansion of electric vehicles, semiconductors, and renewable energy industries is increasing demand for specialty and high-purity chemicals.
-
Growing adoption of sustainable and green chemistry solutions is driving innovation in bio-based and low-emission chemical products.
-
Rising industrialization and urbanization in emerging economies are significantly boosting global chemical consumption and infrastructure-related demand.
-
Digital transformation through AI-driven manufacturing, automation, and online procurement platforms is improving efficiency across chemical supply chains.
-
Increasing investments in advanced materials, nanomaterials, and green hydrogen technologies are reshaping long-term chemical industry innovation and sustainability strategies.
The U.S. Global Chemical Market Outlook
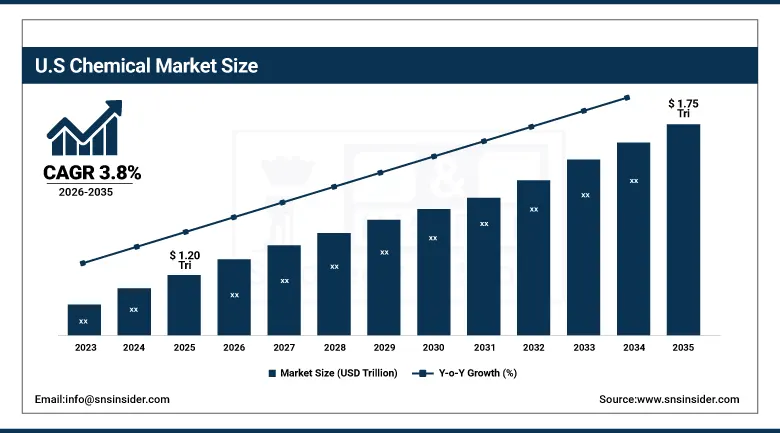
The U.S. Chemical Market was valued at approximately USD 1.20 Trillion in 2025 and is expected to reach approximately USD 1.75 Trillion by 2035, growing at a CAGR of 3.8% from 2026–2035.
The United States Chemical Industry is experiencing steady growth, fueled by the high demand from major end-user industries like pharmaceuticals & healthcare, automobile, construction, agriculture, and advanced manufacturing. The increased availability of shale gas within the country has brought down feedstock prices, enhancing the petrochemical sector’s competitiveness. Higher investments in specialty and performance chemicals and sustainable chemistry solutions are other factors aiding market growth. The use of green chemistry and stringent environmental laws are some of the important drivers pushing the development of cleaner manufacturing processes. Moreover, higher spending in the semiconductor, electronics, and energy sectors has led to a rise in demand for high purity chemicals.
The U.S. chemical industry generates over USD 500+ billion in annual shipments, making it one of the largest manufacturing sectors in the country.
Global Chemical Market Segment Analysis
-
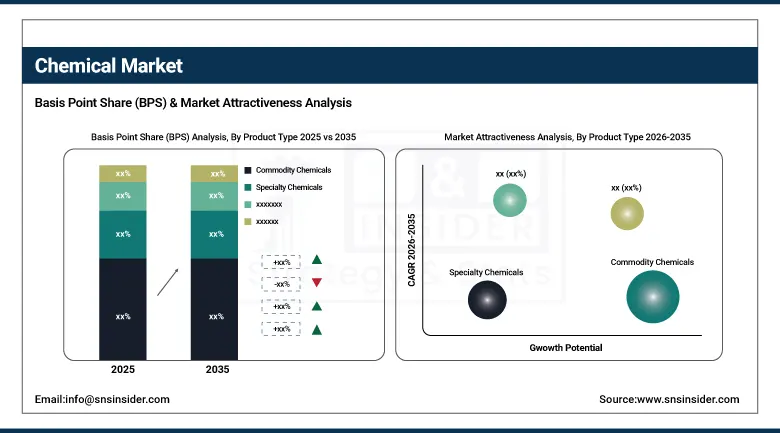
By Product Type, Commodity Chemicals dominated the market with approximately 45% share in 2025; Specialty Chemicals are the fastest-growing segment at a CAGR of 5.2% due to rising demand for high-performance, sustainable, and application-specific formulations.
-
By Application, Agriculture led the market with approximately 28% share in 2025; Pharmaceuticals & Healthcare is the fastest-growing segment at a CAGR of 5.8% due to increasing drug manufacturing, API demand, and healthcare expansion.
-
By End-Use Industry, Manufacturing dominated the market with approximately 35% share in 2025; Electronics & Semiconductor is the fastest-growing segment at a CAGR of 6.1% due to rapid growth in advanced electronics, AI systems, and high-purity chemical demand.
-
By Distribution Channel, Direct Sales dominated the market with approximately 50% share in 2025; Online Chemical Marketplaces are the fastest-growing segment at a CAGR of 7.0% driven by digital procurement adoption and SME participation.
By Product Type, commodity chemicals dominate, specialty chemicals grow fastest
Commodity chemicals constitute the biggest segment in the global chemicals market due to their massive output, standard composition, and wide range of use in different industries such as manufacturing, construction, automotive, and energy. As a result of greater demand coupled with their cheaper costs, commodity chemicals have played a vital role in mass production of plastics, fertilizers, solvents, and base chemicals that account for the larger share of about 45 percent of the total market by 2025. In contrast, specialty chemicals have shown greater rates of growth due to increasing demand for high-quality chemicals that are innovative and sustainable. These chemicals are commonly used in advanced processes in the electronics industry, pharmaceuticals, coatings, and water treatments. Trends towards innovation and sustainability are becoming increasingly important factors determining growth in the specialty chemicals industry.
By Application, agriculture leads, pharmaceuticals & healthcare grows fastest
The Global Chemical Market application wise leads agriculture as a result of the use of fertilizers, pesticides, herbicides, and soil conditioners, which enable the provision of food worldwide. With an increasing number of people and high demand for increased yield, agricultural chemicals form about 28% of the total global chemical market demand in 2025. In this case, there will be heavy dependency on seasonal cycle, subsidies, and adoption of modern practices of agriculture. Pharmaceutical and Healthcare application segment holds the lead in terms of growth. The growth of this segment has been facilitated by high drug manufacturing, development of healthcare infrastructure, and demand for active pharmaceutical intermediaries (API) & specialty intermediaries. The high level of aging populations, presence of diseases, and development in biotechnology have enabled high growth rates. Regulations play a significant role in encouraging innovations in purity and safety of chemicals.
By End-Use Industry, manufacturing dominates, electronics & semiconductor grows fastest
Manufacturing stands out as the major end-use industry within the Global Chemicals Market owing to its high use of chemicals in processing, manufacturing, coating, adhesive applications, and industrial operations. It holds roughly 35% market share by 2025, backed by robust production levels globally and expanding supply chains. There is a heavy need for chemicals that increase efficiency, strength, and performance in various manufacturing sub-industries. On the other hand, the Electronics & Semiconductor industry is the fast-growing end-use segment owing to advances made in Artificial Intelligence (AI), Internet-of-Things (IoT), 5G connectivity, cloud computing, and electronics production. Semiconductors require high-grade chemicals for wafer production, cleansing, cutting, etching, and processing. Increased fabrication spending along with digitization have contributed significantly to demand. Growth in miniaturized electronics and semiconductors has further pushed chemical innovation in this segment, which makes this segment crucial in the development of the global chemical industry going forward.
Regional Analysis
|
Region |
Major Country |
Share within Region, 2025 (%) |
|---|---|---|
|
North America |
United States |
82.3% |
|
Europe |
Germany |
34.2% |
|
Asia Pacific |
China |
43.8% |
|
Middle East & Africa |
Israel |
25.4% |
|
Latin America |
Brazil |
38.7% |
North America Global Chemical Market Insights
North America represents one of the vital geographical areas in the global chemical market owing to high demand in industries including manufacturing, pharmaceuticals, agriculture, automotive, and energy sector. The US leads the market in terms of production, thanks to availability of ample sources of shale gas which produce over 100 billion cubic feet of natural gas each day, thereby making petrochemical products competitive. There are more than 13,000 chemical manufacturing plants in North America generating more than USD 500+ billion in chemical products annually. The chemical industry in US alone employs about 550,000 direct employees and millions of indirect employees across supply chains. The region is making rapid strides in research and development, comprising nearly 15–20% share in global innovation expenditures, in developing specialty and green chemicals.
Get Customized Report as per Your Business Requirement - Enquiry Now
Europe Global Chemical Market Insights
Europe is one of the key players in the global chemical market, fueled by the increasing need for chemicals in such industries as automotive, pharmaceutical, construction, and industrial manufacturing. There are more than 29,000 chemical companies in the region making Europe one of the most advanced chemical hubs in the world. The contribution of Germany to the global chemical market amounts to more than 220+ billion EUR annually; the country specializes in specialty chemicals and high-purity products. The share of Europe's petrochemicals and industrial gases in the global chemical market is also remarkable. The European chemical industry creates over 1.2 million employment opportunities and operates according to stringent regulations of REACH which stimulates innovations in green chemistry.
Asia Pacific Global Chemical Market Insights
The Global Chemical Market is led by the Asia Pacific region owing to the high degree of industrialization, urbanization, and manufacturing in countries such as China, India, Japan, and South Korea. The region has more than 50% of the total global chemical market in terms of manufacturing capabilities and has huge chemical parks for petrochemicals and specialties. China alone has manufacturing capability to produce more than 40% of all the chemicals produced in the world and holds the first position in chemical production globally. In addition, the Indian chemical market is worth USD 220+ billion and depends on agricultural needs, pharmaceutical requirements, and manufacturing applications. The rising automobile production of over 45 million vehicles per annum and electronics manufacturing make the region favorable for the production of chemicals.
MEA & Latin America Global Chemical Market Insights
MEA and Latin America represent two of the emerging regions within the Global Chemicals Market due to the increased industrial activity and availability of resources. The MEA region is advantaged by its vast oil and gas reserves, accounting for more than 20% of all petrochemical feedstock in the world, while Saudi Arabia and UAE are among the largest centers for chemical production in the region. Latin America, with its leadership provided by countries such as Brazil and Mexico, enjoys strong demand for chemicals in agriculture, food processing, and manufacturing industries. In particular, Brazil produces over 70 million tons of fertilizers per year. There is significant investment in downstream diversity, infrastructure development, and export chemical production in both regions.
Market Dynamics
Growth Drivers: Increasing demand from agriculture, pharmaceuticals & healthcare, construction, automotive, and manufacturing industries is driving the global chemical market growth.
Rising industrialization and urbanization are significantly boosting consumption of commodity and specialty chemicals across global value chains. The expansion of petrochemical production, supported by shale gas availability in the U.S. and large-scale refining capacity in the Middle East and Asia Pacific, is further strengthening supply. In addition, growing demand for sustainable and green chemistry solutions, bio-based materials, and high-performance specialty chemicals is accelerating market expansion. Pharmaceutical and healthcare growth, particularly in APIs and intermediates, along with rising food security needs driving agrochemical usage, are also key structural drivers supporting long-term chemical demand worldwide.
Restraints: The Global Chemical Market faces significant restraints from stringent environmental regulations, high compliance costs, and increasing pressure to reduce carbon emissions.
Fluctuations in raw materials pricing, especially in the case of crude oil and natural gas, can have a direct effect on manufacturing costs and profitability within the commodity and petrochemical sectors. The mounting awareness about dangerous chemical processing and waste management adds to the intricacy of the operation. Besides, there may be some political risks as well, which can impact supply chains and international trade operations. Moreover, the shift towards sustainable chemicals adds another layer of difficulty to the entire production process.
Opportunities: The Global Chemical Market presents strong opportunities through the rapid shift toward sustainable chemistry, including bio-based chemicals, recyclable materials, and low-carbon production technologies.
Rapid development and growth of various industries such as the manufacture of electric vehicles, semiconductor, renewable power generation, and health care segments have created more demand for specialty and high-purity chemicals used in batteries, coatings, electronics manufacturing, and pharmaceuticals. Industrialization and urbanization of fast-developing nations in the Asia-Pacific region, Latin America, and Africa present great unexplored opportunities for players in the chemical industry owing to the creation of infrastructure and consumer demand. Digitalization in the industry is taking place through automation of manufacturing processes, AI-driven manufacturing operations, and digital procurement platforms. Innovations in advanced materials, nanotechnology, and green hydrogen technologies have enabled the creation of environmental-friendly products in the chemical industry.
Recent Developments:
-
May 2025: BASF SE announced expansion of its North American petrochemical and specialty chemicals capacity to strengthen supply for automotive, construction, and industrial applications, while enhancing low-carbon production initiatives across key sites.
-
April 2025: Dow Inc. introduced new circular and bio-based material solutions aimed at packaging and automotive sectors, supporting its sustainability roadmap and increasing demand for recyclable polymer products in global supply chains.
Global Chemical Market Key Players are:
-
BASF SE
-
Dow Inc.
-
LyondellBasell Industries N.V.
-
SABIC
-
INEOS Group
-
DuPont de Nemours, Inc.
-
Evonik Industries AG
-
Covestro AG
-
Mitsubishi Chemical Group Corporation
-
LG Chem Ltd.
-
Sumitomo Chemical Co., Ltd.
-
Toray Industries, Inc.
-
Arkema S.A.
-
Air Liquide S.A.
-
Akzo Nobel N.V.
-
Eastman Chemical Company
-
Celanese Corporation
-
Huntsman Corporation
-
Wacker Chemie AG
-
Solvay S.A.
Global Chemical Market Report Scope:
| Report Attributes | Details |
|---|---|
| Market Size in 2025 | USD 6.04 Trillion |
| Market Size by 2035 | USD 8.78 Trillion |
| CAGR | CAGR of 3.81% From 2026 to 2035 |
| Base Year | 2025 |
| Forecast Period | 2026-2035 |
| Historical Data | 2022-2024 |
| Report Scope & Coverage | Market Size, Segments Analysis, Competitive Landscape, Regional Analysis, DROC & SWOT Analysis, Forecast Outlook |
| Key Segments | • By Product Type (Commodity Chemicals, Specialty Chemicals, Agrochemicals, Petrochemicals, Industrial Gases) • By Application (Agriculture, Pharmaceuticals & Healthcare, Construction, Automotive, Consumer Goods) • By End-Use Industry (Manufacturing, Food & Beverage, Energy & Utilities, Textile Industry, Electronics & Semiconductor) • By Distribution Channel (Direct Sales, Distributors & Wholesalers, Online Chemical Marketplaces, Retail Suppliers, Third-Party Procurement Services) |
| Regional Analysis/Coverage | North America (US, Canada), Europe (Germany, UK, France, Italy, Spain, Russia, Poland, Rest of Europe), Asia Pacific (China, India, Japan, South Korea, Australia, ASEAN Countries, Rest of Asia Pacific), Middle East & Africa (UAE, Saudi Arabia, Qatar, South Africa, Rest of Middle East & Africa), Latin America (Brazil, Argentina, Mexico, Colombia, Rest of Latin America). |
| Company Profiles | BASF SE, Dow Inc., LyondellBasell Industries N.V., SABIC, INEOS Group, DuPont de Nemours, Inc., Evonik Industries AG, Covestro AG, Mitsubishi Chemical Group Corporation, LG Chem Ltd., Sumitomo Chemical Co., Ltd., Toray Industries, Inc., Arkema S.A., Air Liquide S.A., Akzo Nobel N.V., Eastman Chemical Company, Celanese Corporation, Huntsman Corporation, Wacker Chemie AG, Solvay S.A. |
Frequently Asked Questions
Asia Pacific dominated the Global Chemical Market in 2025.
Agriculture dominated with approximately 28% of revenues in 2025.
The major growth factor driving the Global Chemical Market is rising demand from manufacturing, agriculture, pharmaceuticals, construction, and automotive industries supported by rapid industrialization and urbanization.
The Global Chemical Market was valued at USD 6.04 Trillion in 2025.
The Global Chemical Market is expected to grow at a CAGR of 3.81% from 2026 to 2035.
Get in Touch
