image

Synthetic Natural Gas Market Report Scope & Overview:

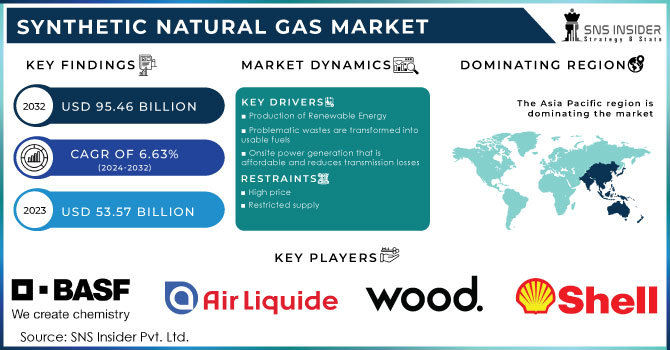
The Synthetic Natural Gas Market size was valued at USD 50.22 billion in 2022 and is expected to grow to USD 82.49 billion by 2030 and grow at a CAGR of 6.4 % over the forecast period of 2023-2030.

Syngas, sometimes referred to as synthetic gas, producer gas, or synthesis gas, can be created from a range types distinct carbon-containing compounds. Biomass (wood gas), plastics, coal, municipal garbage, and other resources may be among them. Many homes in the past relied on town gas to supply them with gas.

Synthetic Natural Gas Market Revenue Analysis

The 20th century saw industrialization in Europe and other developed nations. To improve system efficiency, petrol engines that burn syngas as fuel can be set up in a combined heat and power arrangement. Natural gas can be replaced by synthetic natural gas, which is produced from coal and is compatible for transmission through natural gas pipes. This gas is natural replacement must have at least 95% methane. The creation of synthesis gas, commonly known as syngas, is a first stage in the process of producing synthetic natural gas.

Due to its widespread usage in household, business, and industrial settings, natural gas is a significant part of the global energy supply. However, because there is a limited supply, synthetic natural gas is desired in areas where there is a dearth or lack of natural gas. Given that it exhibits natural gas-like combustion properties, this kind of natural gas is desirable.

MARKET DYNAMICS

KEY DRIVERS:  

  • Production of Renewable Energy

  • Problematic wastes are transformed into usable fuels

  • Onsite power generation that is affordable and reduces transmission losses

  • Lowering of carbon dioxide emissions

RESTRAIN:

  • High price

  • Restricted supply

It is anticipated that high startup costs for SNG plants and rising fossil fuel prices would restrain the market for synthetic natural gas. SNG is a medium- to long-term solution with a broad use in the manufacture of bio-SNG. Similar to how SNG is created, SNG is also produced by the gasification of biomass, such as forestry waste or energy crops.

OPPORTUNITY: 

  • Technology for underground coal gasification

  • Government investing in creation of renewable energy sources.

An increase in government measures to heavily invest in the creation of renewable energy sources is needed to reduce carbon emissions, provide a reliable supply of energy, and assure waste management ingenuity. predicted to drive the worldwide market for synthetic natural gas. However, creating an enterprise comes with a great expense.

CHALLENGES:

  • Composition of synthetic gas is highly depending upon gasifier

The inputs to the gasifier have a significant impact on the syngas's composition. Tars, hydrogen concentrations, and moisture are just a few of the syngas constituents that present problems that need to be dealt with right away. Methane, the typical fuel for gas engines, burns much more slowly than hydrogen gas does. Under normal conditions, the possibility of pre-ignition, banging, and engine backfiring would result from the engine's cylinders burning fuel more quickly. The engine has undergone a variety of technological changes to address this issue, and its output has been decreased to between 50 and 70 percent of what it would normally produce while running on natural gas.

IMPACT OF RUSSIAN UKRAINE WAR

The Russia-Ukraine conflict is resetting the energy industry, with natural gas becoming a global and linked market that is impacted by dynamics and events that go well beyond its conventional physical limitations, something akin to what oil was for decades.

Compared to merely 19% in 2021, LNG's contribution to the supply of gas to Europe increased to 33% in 2022, according to data from S&P Global Commodity Insights. Asian LNG prices are all exhibiting signs of increasing higher correlation.

KEY MARKET SEGMENTS

By Gasifier

  • Moving Bed Gasifier

  • Fluidized Bed Gasifier

  • Entrained Flow Gasifier

  • Others

By Technology

  • Steam Reforming

  • Partial Oxidation

  • Autothermal Reforming

  • Combined or Two-step Reforming

  • Biomass Gasification

By Feedstock

  • Natural Gas

  • Coal

  • Biomass/Waste

  • Others

By Application

  • Power Generation

  • Chemicals

  • Others

Synthetic Natural Gas Market Segmentation Analysis

REGIONAL ANALYSIS

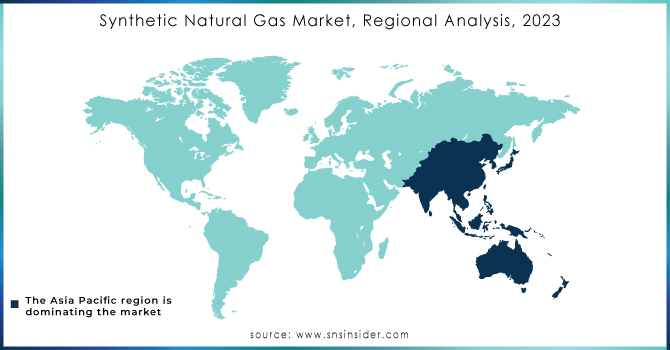
The Asia Pacific market is seeing considerable growth because to an increase in demand for SNG in nations like China, Japan, and India. Major markets in the Middle East, Africa, and Latin America are also share of the market for synthetic natural gas. This is explained by the rise in demand for SNG in important markets including industrial and commercial. Due to the increased use of alternatives and other factors, the synthetic natural gas market in North America is predicted to grow at a rapid rate over the projected period. sources of renewable energy in the United States and Canada. 

Asia-Pacific led the worldwide syngas market share. Due to an increase in demand from the chemical sector, particularly from refineries market for Syngas.

REGIONAL COVERAGE:

North America

  • US

  • Canada

  • Mexico

Europe

  • Eastern Europe

    • Poland

    • Romania

    • Hungary

    • Turkey

    • Rest of Eastern Europe

  • Western Europe

    • Germany

    • France

    • UK

    • Italy

    • Spain

    • Netherlands

    • Switzerland

    • Austria

    • Rest of Western Europe

Asia Pacific

  • China

  • India

  • Japan

  • South Korea

  • Vietnam

  • Singapore

  • Australia

  • Rest of Asia Pacific

Middle East & Africa

  • Middle East

    • UAE

    • Egypt

    • Saudi Arabia

    • Qatar

    • Rest of Middle East

  • Africa

    • Nigeria

    • South Africa

    • Rest of Africa

Latin America

  • Brazil

  • Argentina

  • Colombia

  • Rest of Latin America

KEY PLAYERS 

ROYAL DUTCH SHELL PLC., SynGas Technology LLC, John Wood Group, Syngas Energy Holdings, BASF SE, Air Liquide, Air Products and Chemicals Inc., SIEMENS AG, The Linde Group, Sasol Limited, and other players are listed in a final report.

SynGas Technology LLC-Company Financial Analysis

Company Landscape Analysis

Synthetic Natural Gas Market Report Scope:
Report Attributes Details
Market Size in 2022  US$ 50.22 Bn
Market Size by 2030  US$ 82.49 Bn
CAGR   CAGR of 6.4 % From 2023 to 2030
Base Year 2022
Forecast Period  2023-2030
Historical Data  2020-2021
Report Scope & Coverage Market Size, Segments Analysis, Competitive  Landscape, Regional Analysis, DROC & SWOT Analysis, Forecast Outlook
Key Segments • By Gasifier (Moving Bed Gasifier, Fluidized Bed Gasifier, Entrained Flow Gasifier, Others)
• By Technology (Steam Reforming, Partial Oxidation, Autothermal Reforming, Combined or Two-step Reforming, Biomass Gasification)
• By Feedstock (Natural Gas, Coal, Biomass/Waste, Others)
• By Application (Power Generation, Chemicals, Others)
Regional Analysis/Coverage North America (US, Canada, Mexico), Europe (Eastern Europe [Poland, Romania, Hungary, Turkey, Rest of Eastern Europe] Western Europe] Germany, France, UK, Italy, Spain, Netherlands, Switzerland, Austria, Rest of Western Europe]). Asia Pacific (China, India, Japan, South Korea, Vietnam, Singapore, Australia, Rest of Asia Pacific), Middle East & Africa (Middle East [UAE, Egypt, Saudi Arabia, Qatar, Rest of Middle East], Africa [Nigeria, South Africa, Rest of Africa], Latin America (Brazil, Argentina, Colombia Rest of Latin America)
Company Profiles ROYAL DUTCH SHELL PLC., SynGas Technology LLC, John Wood Group, Syngas Energy Holdings, BASF SE, Air Liquide, Air Products and Chemicals Inc., SIEMENS AG, The Linde Group, Sasol Limited
Key Drivers • Production of Renewable Energy
• Problematic wastes are transformed into usable fuels
• Onsite power generation that is affordable and reduces transmission losses
• Lowering of carbon dioxide emissions
Market Restraints • High price
• Restricted supply


Frequently Asked Questions

Ans: Synthetic Natural Gas Market is anticipated to expand by 6.4 % from 2023 to 2030.

Ans:  USD 82.49 billion is expected to grow by 2030.

Ans: Synthetic Natural Gas Market size was valued at USD 50.22 billion in 2022

Ans: Acia Pacific is dominating the market.

Ans: Technology for underground coal gasification

Government investing in creation of renewable energy sources.

TABLE OF CONTENT

1. Introduction
1.1 Market Definition
1.2 Scope
1.3 Research Assumptions

2. Research Methodology

3. Market Dynamics
3.1 Drivers
3.2 Restraints
3.3 Opportunities
3.4 Challenges

4. Impact Analysis
4.1 Impact of the Ukraine- Russia war
4.2 Impact of ongoing Recession
4.2.1 Introduction
4.2.2 Impact on major economies
4.2.2.1 US
4.2.2.2 Canada
4.2.2.3 Germany
4.2.2.4 France
4.2.2.5 United Kingdom
4.2.2.6 China
4.2.2.7 Japan
4.2.2.8 South Korea
4.2.2.9 Rest of the World

5. Value Chain Analysis

6. Porter’s 5 forces model

7. PEST Analysis

8. Synthetic Natural Gas Market Segmentation, By Gasifier
8.1 Moving Bed Gasifier
8.2 Fluidized Bed Gasifier
8.3 Entrained Flow Gasifier
8.4 Others

9. Synthetic Natural Gas Market Segmentation, By Technology
9.1 Steam Reforming
9.2 Partial Oxidation
9.3 Autothermal Reforming
9.4 Combined or Two-step Reforming
9.5 Biomass Gasification

10. Synthetic Natural Gas Market Segmentation, By Feedstock
10.1 Natural Gas
10.2 Coal
10.3 Biomass/Waste
10.4 Others

11. Synthetic Natural Gas Market Segmentation, By Application
11.1 Power Generation
11.2 Chemicals
11.3 Others

12. Regional Analysis
12.1 Introduction
12.2 North America
12.2.1 North America Synthetic Natural Gas Market by Country
12.2.2North America Synthetic Natural Gas Market by Gasifier
12.2.3 North America Synthetic Natural Gas Market by Technology
12.2.4 North America Synthetic Natural Gas Market by Feedstock
12.2.5 North America Synthetic Natural Gas Market by Application
12.2.6 USA
12.2.6.1 USA Synthetic Natural Gas Market by Gasifier
12.2.6.2 USA Synthetic Natural Gas Market by Technology
12.2.6.3 USA Synthetic Natural Gas Market by Feedstock
12.2.6.4 USA Synthetic Natural Gas Market by Application
12.2.7 Canada
12.2.7.1 Canada Synthetic Natural Gas Market by Gasifier
12.2.7.2 Canada Synthetic Natural Gas Market by Technology
12.2.7.3 Canada Synthetic Natural Gas Market by Feedstock
12.2.7.4 Canada Synthetic Natural Gas Market by Application
12.2.8 Mexico
12.2.8.1 Mexico Synthetic Natural Gas Market by Gasifier
12.2.8.2 Mexico Synthetic Natural Gas Market by Technology
12.2.8.3 Mexico Synthetic Natural Gas Market by Feedstock
12.2.8.4 Mexico Synthetic Natural Gas Market by Application
12.3 Europe
12.3.1 Eastern Europe
12.3.1.1 Eastern Europe Synthetic Natural Gas Market by Country
12.3.1.2 Eastern Europe Synthetic Natural Gas Market by Gasifier
12.3.1.3 Eastern Europe Synthetic Natural Gas Market by Technology
12.3.1.4 Eastern Europe Synthetic Natural Gas Market by Feedstock
12.3.1.5 Eastern Europe Synthetic Natural Gas Market by Application
12.3.1.6 Poland
12.3.1.6.1 Poland Synthetic Natural Gas Market by Gasifier
12.3.1.6.2 Poland Synthetic Natural Gas Market by Technology
12.3.1.6.3 Poland Synthetic Natural Gas Market by Feedstock
12.3.1.6.4 Poland Synthetic Natural Gas Market by Application
12.3.1.7 Romania
12.3.1.7.1 Romania Synthetic Natural Gas Market by Gasifier
12.3.1.7.2 Romania Synthetic Natural Gas Market by Technology
12.3.1.7.3 Romania Synthetic Natural Gas Market by Feedstock
12.3.1.7.4 Romania Synthetic Natural Gas Market by Application
12.3.1.8 Hungary
12.3.1.8.1 Hungary Synthetic Natural Gas Market by Gasifier
12.3.1.8.2 Hungary Synthetic Natural Gas Market by Technology
12.3.1.8.3 Hungary Synthetic Natural Gas Market by Feedstock
12.3.1.8.4 Hungary Synthetic Natural Gas Market by Application
12.3.1.9 Turkey
12.3.1.9.1 Turkey Synthetic Natural Gas Market by Gasifier
12.3.1.9.2 Turkey Synthetic Natural Gas Market by Technology
12.3.1.9.3 Turkey Synthetic Natural Gas Market by Feedstock
12.3.1.9.4 Turkey Synthetic Natural Gas Market by Application
12.3.1.10 Rest of Eastern Europe
12.3.1.10.1 Rest of Eastern Europe Synthetic Natural Gas Market by Gasifier
12.3.1.10.2 Rest of Eastern Europe Synthetic Natural Gas Market by Technology
12.3.1.10.3 Rest of Eastern Europe Synthetic Natural Gas Market by Feedstock
12.3.1.10.4 Rest of Eastern Europe Synthetic Natural Gas Market by Application
12.3.2 Western Europe
12.3.2.1 Western Europe Synthetic Natural Gas Market by Country
12.3.2.2 Western Europe Synthetic Natural Gas Market by Gasifier
12.3.2.3 Western Europe Synthetic Natural Gas Market by Technology
12.3.2.4 Western Europe Synthetic Natural Gas Market by Feedstock
12.3.2.5 Western Europe Synthetic Natural Gas Market by Application
12.3.2.6 Germany
12.3.2.6.1 Germany Synthetic Natural Gas Market by Gasifier
12.3.2.6.2 Germany Synthetic Natural Gas Market by Technology
12.3.2.6.3 Germany Synthetic Natural Gas Market by Feedstock
12.3.2.6.4 Germany Synthetic Natural Gas Market by Application
12.3.2.7 France
12.3.2.7.1 France Synthetic Natural Gas Market by Gasifier
12.3.2.7.2 France Synthetic Natural Gas Market by Technology
12.3.2.7.3 France Synthetic Natural Gas Market by Feedstock
12.3.2.7.4 France Synthetic Natural Gas Market by Application
12.3.2.8 UK
12.3.2.8.1 UK Synthetic Natural Gas Market by Gasifier
12.3.2.8.2 UK Synthetic Natural Gas Market by Technology
12.3.2.8.3 UK Synthetic Natural Gas Market by Feedstock
12.3.2.8.4 UK Synthetic Natural Gas Market by Application
12.3.2.9 Italy
12.3.2.9.1 Italy Synthetic Natural Gas Market by Gasifier
12.3.2.9.2 Italy Synthetic Natural Gas Market by Technology
12.3.2.9.3 Italy Synthetic Natural Gas Market by Feedstock
12.3.2.9.4 Italy Synthetic Natural Gas Market by Application
12.3.2.10 Spain
12.3.2.10.1 Spain Synthetic Natural Gas Market by Gasifier
12.3.2.10.2 Spain Synthetic Natural Gas Market by Technology
12.3.2.10.3 Spain Synthetic Natural Gas Market by Feedstock
12.3.2.10.4 Spain Synthetic Natural Gas Market by Application
12.3.2.11 Netherlands
12.3.2.11.1 Netherlands Synthetic Natural Gas Market by Gasifier
12.3.2.11.2 Netherlands Synthetic Natural Gas Market by Technology
12.3.2.11.3 Netherlands Synthetic Natural Gas Market by Feedstock
12.3.2.11.4 Netherlands Synthetic Natural Gas Market by Application
12.3.2.12 Switzerland
12.3.2.12.1 Switzerland Synthetic Natural Gas Market by Gasifier
12.3.2.12.2 Switzerland Synthetic Natural Gas Market by Technology
12.3.2.12.3 Switzerland Synthetic Natural Gas Market by Feedstock
12.3.2.12.4 Switzerland Synthetic Natural Gas Market by Application
12.3.2.13 Austria
12.3.2.13.1 Austria Synthetic Natural Gas Market by Gasifier
12.3.2.13.2 Austria Synthetic Natural Gas Market by Technology
12.3.2.13.3 Austria Synthetic Natural Gas Market by Feedstock
12.3.2.13.4 Austria Synthetic Natural Gas Market by Application
12.3.2.14 Rest of Western Europe
12.3.2.14.1 Rest of Western Europe Synthetic Natural Gas Market by Gasifier
12.3.2.14.2 Rest of Western Europe Synthetic Natural Gas Market by Technology
12.3.2.14.3 Rest of Western Europe Synthetic Natural Gas Market by Feedstock
12.3.2.14.4 Rest of Western Europe Synthetic Natural Gas Market by Application
12.4 Asia-Pacific
12.4.1 Asia Pacific Synthetic Natural Gas Market by Country
12.4.2 Asia Pacific Synthetic Natural Gas Market by Gasifier
12.4.3 Asia Pacific Synthetic Natural Gas Market by Technology
12.4.4 Asia Pacific Synthetic Natural Gas Market by Feedstock
12.4.5 Asia Pacific Synthetic Natural Gas Market by Application
12.4.6 China
12.4.6.1 China Synthetic Natural Gas Market by Gasifier
12.4.6.2 China Synthetic Natural Gas Market by Technology
12.4.6.3 China Synthetic Natural Gas Market by Feedstock
12.4.6.4 China Synthetic Natural Gas Market by Application
12.4.7 India
12.4.7.1 India Synthetic Natural Gas Market by Gasifier
12.4.7.2 India Synthetic Natural Gas Market by Technology
12.4.7.3 India Synthetic Natural Gas Market by Feedstock
12.4.7.4 India Synthetic Natural Gas Market by Application
12.4.8 Japan
12.4.8.1 Japan Synthetic Natural Gas Market by Gasifier
12.4.8.2 Japan Synthetic Natural Gas Market by Technology
12.4.8.3 Japan Synthetic Natural Gas Market by Feedstock
12.4.8.4 Japan Synthetic Natural Gas Market by Application
12.4.9 South Korea
12.4.9.1 South Korea Synthetic Natural Gas Market by Gasifier
12.4.9.2 South Korea Synthetic Natural Gas Market by Technology
12.4.9.3 South Korea Synthetic Natural Gas Market by Feedstock
12.4.9.4 South Korea Synthetic Natural Gas Market by Application
12.4.10 Vietnam
12.4.10.1 Vietnam Synthetic Natural Gas Market by Gasifier
12.4.10.2 Vietnam Synthetic Natural Gas Market by Technology
12.4.10.3 Vietnam Synthetic Natural Gas Market by Feedstock
12.4.10.4 Vietnam Synthetic Natural Gas Market by Application
12.4.11 Singapore
12.4.11.1 Singapore Synthetic Natural Gas Market by Gasifier
12.4.11.2 Singapore Synthetic Natural Gas Market by Technology
12.4.11.3 Singapore Synthetic Natural Gas Market by Feedstock
12.4.11.4 Singapore Synthetic Natural Gas Market by Application
12.4.12 Australia
12.4.12.1 Australia Synthetic Natural Gas Market by Gasifier
12.4.12.2 Australia Synthetic Natural Gas Market by Technology
12.4.12.3 Australia Synthetic Natural Gas Market by Feedstock
12.4.12.4 Australia Synthetic Natural Gas Market by Application
12.4.13 Rest of Asia-Pacific
12.4.13.1 Rest of Asia-Pacific Synthetic Natural Gas Market by Gasifier
12.4.13.2 Rest of Asia-Pacific Synthetic Natural Gas Market by Technology
12.4.13.3 Rest of Asia-Pacific Synthetic Natural Gas Market by Feedstock
12.4.13.4 Rest of Asia-Pacific Synthetic Natural Gas Market by Application
12.5 Middle East & Africa
12.5.1 Middle East
12.5.1.1 Middle East Synthetic Natural Gas Market by Country
12.5.1.2 Middle East Synthetic Natural Gas Market by Gasifier
12.5.1.3 Middle East Synthetic Natural Gas Market by Technology
12.5.1.4 Middle East Synthetic Natural Gas Market by Feedstock
12.5.1.5 Middle East Synthetic Natural Gas Market by Application
12.5.1.6 UAE
12.5.1.6.1 UAE Synthetic Natural Gas Market by Gasifier
12.5.1.6.2 UAE Synthetic Natural Gas Market by Technology
12.5.1.6.3 UAE Synthetic Natural Gas Market by Feedstock
12.5.1.6.4 UAE Synthetic Natural Gas Market by Application
12.5.1.7 Egypt
12.5.1.7.1 Egypt Synthetic Natural Gas Market by Gasifier
12.5.1.7.2 Egypt Synthetic Natural Gas Market by Technology
12.5.1.7.3 Egypt Synthetic Natural Gas Market by Feedstock
12.5.1.7.4 Egypt Synthetic Natural Gas Market by Application
12.5.1.8 Saudi Arabia
12.5.1.8.1 Saudi Arabia Synthetic Natural Gas Market by Gasifier
12.5.1.8.2 Saudi Arabia Synthetic Natural Gas Market by Technology
12.5.1.8.3 Saudi Arabia Synthetic Natural Gas Market by Feedstock
12.5.1.8.4 Saudi Arabia Synthetic Natural Gas Market by Application
12.5.1.9 Qatar
12.5.1.9.1 Qatar Synthetic Natural Gas Market by Gasifier
12.5.1.9.2 Qatar Synthetic Natural Gas Market by Technology
12.5.1.9.3 Qatar Synthetic Natural Gas Market by Feedstock
12.5.1.9.4 Qatar Synthetic Natural Gas Market by Application
12.5.1.10 Rest of Middle East
12.5.1.10.1 Rest of Middle East Synthetic Natural Gas Market by Gasifier
12.5.1.10.2 Rest of Middle East Synthetic Natural Gas Market by Technology
12.5.1.10.3 Rest of Middle East Synthetic Natural Gas Market by Feedstock
12.5.1.10.4 Rest of Middle East Synthetic Natural Gas Market by Application
12.5.2. Africa
12.5.2.1 Africa Synthetic Natural Gas Market by Country
12.5.2.2 Africa Synthetic Natural Gas Market by Gasifier
12.5.2.3 Africa Synthetic Natural Gas Market by Technology
12.5.2.4 Africa Synthetic Natural Gas Market by Feedstock
12.5.2.5 Africa Synthetic Natural Gas Market by Application
12.5.2.6 Nigeria
12.5.2.6.1 Nigeria Synthetic Natural Gas Market by Gasifier
12.5.2.6.2 Nigeria Synthetic Natural Gas Market by Technology
12.5.2.6.3 Nigeria Synthetic Natural Gas Market by Feedstock
12.5.2.6.4 Nigeria Synthetic Natural Gas Market by Application
12.5.2.7 South Africa
12.5.2.7.1 South Africa Synthetic Natural Gas Market by Gasifier
12.5.2.7.2 South Africa Synthetic Natural Gas Market by Technology
12.5.2.7.3 South Africa Synthetic Natural Gas Market by Feedstock
12.5.2.7.4 South Africa Synthetic Natural Gas Market by Application
12.5.2.8 Rest of Africa
12.5.2.8.1 Rest of Africa Synthetic Natural Gas Market by Gasifier
12.5.2.8.2 Rest of Africa Synthetic Natural Gas Market by Technology
12.5.2.8.3 Rest of Africa Synthetic Natural Gas Market by Feedstock
12.5.2.8.4 Rest of Africa Synthetic Natural Gas Market by Application
12.6. Latin America
12.6.1 Latin America Synthetic Natural Gas Market by Country
12.6.2 Latin America Synthetic Natural Gas Market by Gasifier
12.6.3 Latin America Synthetic Natural Gas Market by Technology
12.6.4 Latin America Synthetic Natural Gas Market by Feedstock
12.6.5 Latin America Synthetic Natural Gas Market by Application
12.6.6 Brazil
12.6.6.1 Brazil Synthetic Natural Gas Market by Gasifier
12.6.6.2 Brazil Synthetic Natural Gas Market by Technology
12.6.6.3 Brazil Synthetic Natural Gas Market by Feedstock
12.6.6.4 Brazil Synthetic Natural Gas Market by Application
12.6.7 Argentina
12.6.7.1 Argentina Synthetic Natural Gas Market by Gasifier
12.6.7.2 Argentina Synthetic Natural Gas Market by Technology
12.6.7.3 Argentina Synthetic Natural Gas Market by Feedstock
12.6.7.4 Argentina Synthetic Natural Gas Market by Application
12.6.8 Colombia
12.6.8.1 Colombia Synthetic Natural Gas Market by Gasifier
12.6.8.2 Colombia Synthetic Natural Gas Market by Technology
12.6.8.3 Colombia Synthetic Natural Gas Market by Feedstock
12.6.8.4 Colombia Synthetic Natural Gas Market by Application
12.6.9 Rest of Latin America
12.6.9.1 Rest of Latin America Synthetic Natural Gas Market by Gasifier
12.6.9.2 Rest of Latin America Synthetic Natural Gas Market by Technology
12.6.9.3 Rest of Latin America Synthetic Natural Gas Market by Feedstock
12.6.9.4 Rest of Latin America Synthetic Natural Gas Market by Application

13 Company Profile
13.1 ROYAL DUTCH SHELL PLC.
13.1.1 Company Overview
13.1.2 Financials
13.1.3 Products/ Services Offered
13.1.4 SWOT Analysis
13.1.5 The SNS View
13.2 SynGas Technology LLC
13.2.1 Company Overview
13.2.2 Financials
13.2.3 Products/ Services Offered
13.2.4 SWOT Analysis
13.2.5 The SNS View
13.3 John Wood Group
13.3.1 Company Overview
13.3.2 Financials
13.3.3 Products/ Services Offered
13.3.4 SWOT Analysis
13.3.5 The SNS View
13.4 Syngas Energy Holdings
13.4 Company Overview
13.4.2 Financials
13.4.3 Products/ Services Offered
13.4.4 SWOT Analysis
13.4.5 The SNS View
13.5 BASF SE
13.5.1 Company Overview
13.5.2 Financials
13.5.3 Products/ Services Offered
13.5.4 SWOT Analysis
13.5.5 The SNS View
13.6 Air Liquide
13.6.1 Company Overview
13.6.2 Financials
13.6.3 Products/ Services Offered
13.6.4 SWOT Analysis
13.6.5 The SNS View
13.7 Air Products and Chemicals Inc.
13.7.1 Company Overview
13.7.2 Financials
13.7.3 Products/ Services Offered
13.7.4 SWOT Analysis
13.7.5 The SNS View
13.8 SIEMENS AG
13.8.1 Company Overview
13.8.2 Financials
13.8.3 Products/ Services Offered
13.8.4 SWOT Analysis
13.8.5 The SNS View
13.9 The Linde Group
13.9.1 Company Overview
13.9.2 Financials
13.9.3 Products/ Services Offered
13.9.4 SWOT Analysis
13.9.5 The SNS View
13.10 Sasol Limited
13.10.1 Company Overview
13.10.2 Financials
13.10.3 Products/ Services Offered
13.10.4 SWOT Analysis
13.10.5 The SNS View

14. Competitive Landscape
14.1 Competitive Bench marking
14.2 Market Share Analysis
14.3 Recent Developments
14.3.1 Industry News
14.3.2 Company News
14.3.3 Mergers & Acquisitions

15. USE Cases and Best Practices

16. Conclusion

An accurate research report requires proper strategizing as well as implementation. There are multiple factors involved in the completion of good and accurate research report and selecting the best methodology to compete the research is the toughest part. Since the research reports we provide play a crucial role in any company’s decision-making process, therefore we at SNS Insider always believe that we should choose the best method which gives us results closer to reality. This allows us to reach at a stage wherein we can provide our clients best and accurate investment to output ratio.

Each report that we prepare takes a timeframe of 350-400 business hours for production. Starting from the selection of titles through a couple of in-depth brain storming session to the final QC process before uploading our titles on our website we dedicate around 350 working hours. The titles are selected based on their current market cap and the foreseen CAGR and growth.


The 5 steps process:

Step 1: Secondary Research:

Secondary Research or Desk Research is as the name suggests is a research process wherein, we collect data through the readily available information. In this process we use various paid and unpaid databases which our team has access to and gather data through the same. This includes examining of listed companies’ annual reports, Journals, SEC filling etc. Apart from this our team has access to various associations across the globe across different industries. Lastly, we have exchange relationships with various university as well as individual libraries.

Secondary Research

Step 2: Primary Research

When we talk about primary research, it is a type of study in which the researchers collect relevant data samples directly, rather than relying on previously collected data.  This type of research is focused on gaining content specific facts that can be sued to solve specific problems. Since the collected data is fresh and first hand therefore it makes the study more accurate and genuine.

We at SNS Insider have divided Primary Research into 2 parts.

Part 1 wherein we interview the KOLs of major players as well as the upcoming ones across various geographic regions. This allows us to have their view over the market scenario and acts as an important tool to come closer to the accurate market numbers. As many as 45 paid and unpaid primary interviews are taken from both the demand and supply side of the industry to make sure we land at an accurate judgement and analysis of the market.

This step involves the triangulation of data wherein our team analyses the interview transcripts, online survey responses and observation of on filed participants. The below mentioned chart should give a better understanding of the part 1 of the primary interview.

Primary Research

Part 2: In this part of primary research the data collected via secondary research and the part 1 of the primary research is validated with the interviews from individual consultants and subject matter experts.

Consultants are those set of people who have at least 12 years of experience and expertise within the industry whereas Subject Matter Experts are those with at least 15 years of experience behind their back within the same space. The data with the help of two main processes i.e., FGDs (Focused Group Discussions) and IDs (Individual Discussions). This gives us a 3rd party nonbiased primary view of the market scenario making it a more dependable one while collation of the data pointers.

Step 3: Data Bank Validation

Once all the information is collected via primary and secondary sources, we run that information for data validation. At our intelligence centre our research heads track a lot of information related to the market which includes the quarterly reports, the daily stock prices, and other relevant information. Our data bank server gets updated every fortnight and that is how the information which we collected using our primary and secondary information is revalidated in real time.

Data Bank Validation

Step 4: QA/QC Process

After all the data collection and validation our team does a final level of quality check and quality assurance to get rid of any unwanted or undesired mistakes. This might include but not limited to getting rid of the any typos, duplication of numbers or missing of any important information. The people involved in this process include technical content writers, research heads and graphics people. Once this process is completed the title gets uploader on our platform for our clients to read it.

Step 5: Final QC/QA Process:

This is the last process and comes when the client has ordered the study. In this process a final QA/QC is done before the study is emailed to the client. Since we believe in giving our clients a good experience of our research studies, therefore, to make sure that we do not lack at our end in any way humanly possible we do a final round of quality check and then dispatch the study to the client.

Start a Conversation

Hi! Click one of our member below to chat on Phone