Test Benches Market Report Scope & Overview:
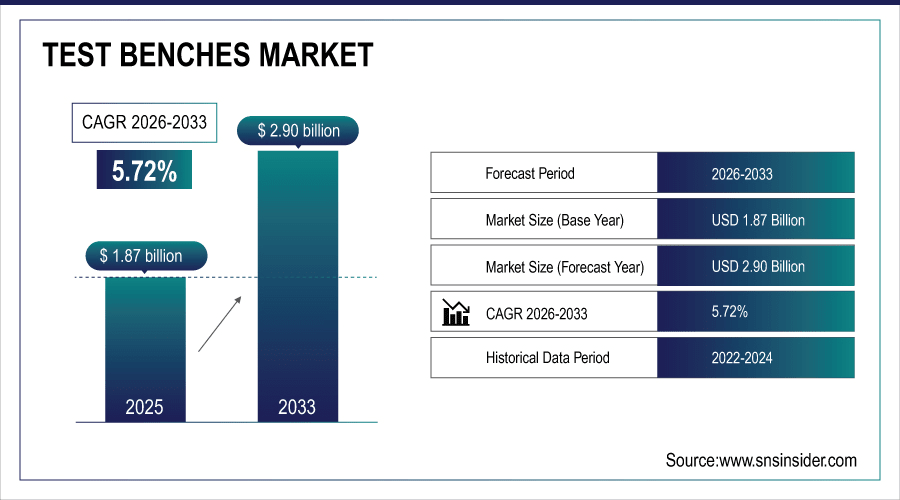
The Test Benches Market size was valued at USD 1.87 Billion in 2025E and is projected to reach USD 2.90 Billion by 2033, growing at a CAGR of 5.72% during 2026-2033.
The Test Benches Market is expanding due to the rising demand for precision testing across automotive, aerospace, electronics, and industrial sectors. Increasing adoption of automated and motorized benches is enhancing accuracy, efficiency, and reducing downtime in production environments. The growth of electric vehicles, IoT devices, and advanced semiconductor manufacturing is further driving the need for high-performance testing solutions.
Automated & motorized test benches now represent 65% of all new installations in 2024, reducing human error by 40% and cutting test cycle times by 30–50%. Factories report 22% less unplanned downtime after switching from manual to robotic test rigs.
To Get More Information On Test Benches Market - Request Free Sample Report
Market Size and Forecast:
-
Market Size in 2025: USD 1.87 Billion
-
Market Size by 2033: USD 2.90 Billion
-
CAGR: 5.72% from 2026 to 2033
-
Base Year: 2025
-
Forecast Period: 2026–2033
-
Historical Data: 2022–2024
Test Benches Market Trends
-
Increasing shift from manual to motorized and automated test benches, enhancing precision, repeatability, and efficiency across industries globally.
-
Integration of IoT-enabled sensors and real-time data analytics in test benches, supporting predictive maintenance and improved quality assurance systems.
-
Growing adoption of digital twin technology in test benches, enabling simulation, validation, and faster prototyping in automotive and aerospace industries.
-
Rising demand for EV and battery testing benches, driven by electric vehicle expansion and stricter global energy efficiency regulations.
-
Expansion of modular, customizable test bench designs offering flexibility, scalability, and cost-effectiveness for diverse industrial and electronic applications.
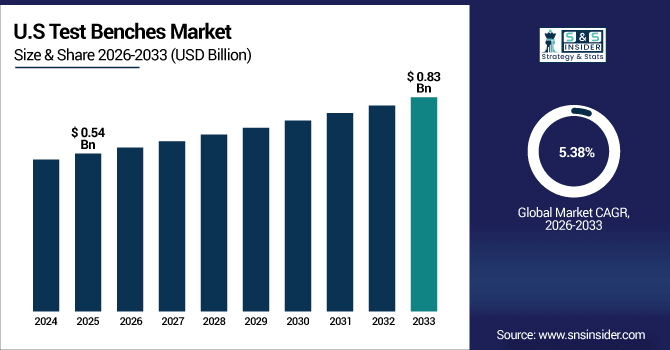
The U.S. Test Benches Market size was valued at USD 0.54 Billion in 2025E and is projected to reach USD 0.83 Billion by 2033, growing at a CAGR of 5.38%during 2026-2033. Test Benches Market growth is driven by strong demand in automotive, aerospace, and defense industries for high-precision testing equipment. Rising investments in EV development and advanced electronics manufacturing are creating new opportunities for motorized and automated benches. The presence of leading technology providers and strong R&D initiatives further accelerates innovation in digital, IoT-enabled testing systems.
Test Benches Market Growth Drivers:
-
Growing adoption of automated, IoT-enabled, and digital twin-integrated test benches across automotive, aerospace, and electronics industries.
The increasing need for precision, efficiency, and reliability in product validation is fueling the adoption of advanced test benches. Automated and IoT-enabled systems reduce human error, deliver real-time insights, and optimize production workflows. Digital twin integration further enhances simulation and prototyping, accelerating time-to-market for complex products. This technological transformation is a major driver shaping global test bench demand.
Over 70% of new test benches deployed in 2024 are IoT-enabled, streaming real-time performance data to cloud dashboards — reducing defect escape rates by 35% and cutting validation cycle times by up to 50% in automotive and electronics sectors.
Test Benches Market Restraints:
-
High capital investment and maintenance costs associated with advanced test benches limit adoption among small enterprises
While test benches are crucial for quality assurance, their high purchase and integration costs act as a barrier for SMEs. Advanced automated and motorized systems often require significant capital, specialized training, and regular maintenance. This increases total cost of ownership, slowing down adoption. Smaller companies, especially in emerging markets, face challenges in justifying ROI, creating a restraint for market growth.
Test Benches Market Opportunities:
-
Rising demand for test benches in electric vehicle, battery testing, and renewable energy applications worldwide
The global shift toward clean energy and electrification is creating lucrative opportunities for test benches. EV manufacturers need specialized testing solutions for batteries, drivetrains, and electronic modules to meet safety and performance standards. Similarly, renewable energy systems like wind turbines and solar inverters require reliable validation equipment. These expanding applications present a strong growth opportunity for innovative and customized test benches globally.
Over 80% of new EV drivetrain test benches in 2024 now simulate real-world thermal, vibration, and load profiles, cutting field failure rates by 35% — while Tier-1 suppliers report 90% utilization rates on these systems amid production ramp-ups.
Test Benches Market Segment Analysis
-
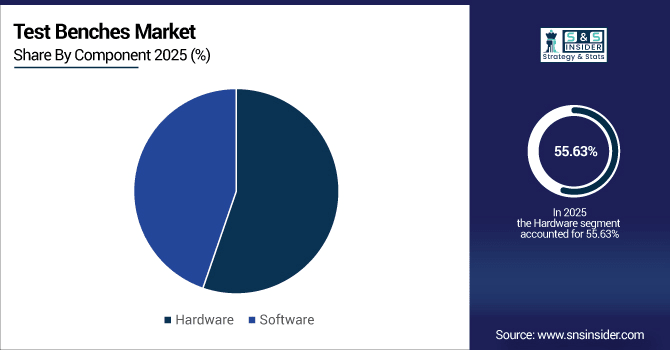
By Component: Hardware led the Test Benches Market with a 55.63% share in 2025E, while Software is the fastest growing segment with a CAGR of 14.56%.
-
By Application: Semiconductor & Electronics dominated the market with a 52.21% share in 2025E, whereas Automotive & Transportation is the fastest growing segment with a CAGR of 9.49%.
-
By Type: Valve test benches led with a 38.13% share in 2025E, and Force test benches are the fastest growing segment at a CAGR of 8.90%.
-
By Test Stands: Manual test stands held 61.78% of the market in 2025E, while Motorized test stands are growing fastest at a CAGR of 9.20%.
By Component, Hardware Leads Market While Software Registers Fastest Growth
Hardware continues to dominate the test benches market, driven by rising demand for durable, precise, and high-performance components that ensure reliability in various testing environments. Industries such as automotive, aerospace, and electronics heavily depend on advanced hardware setups for real-time performance validation. However, software is registering the fastest growth as digitalization accelerates. Increasing adoption of automation, IoT connectivity, and data analytics tools enhances monitoring, control, and predictive maintenance capabilities. The integration of smart software solutions is transforming conventional hardware into intelligent, connected systems.
By Application, Semiconductor & Electronics Dominate While Automotive & Transportation Shows Rapid Growth
Semiconductor and electronics applications lead the test benches market due to their crucial role in validating complex circuits, chips, and devices. With rising consumer electronics demand, miniaturization, and semiconductor innovations, these industries require advanced testing systems to ensure product performance and reliability. Meanwhile, automotive and transportation is showing rapid growth, fueled by trends such as electric vehicles (EVs), autonomous driving technologies, and stringent safety regulations. Testing batteries, powertrains, and sensors drives strong adoption, positioning the automotive sector as a key growth catalyst in the years ahead.
By Type, Valve Lead While Force Registers Fastest Growth
Valve test benches dominate the market owing to their widespread use in oil & gas, power generation, and industrial sectors. Their ability to ensure safety, durability, and performance of critical fluid-handling systems makes them highly sought-after. However, force test benches are registering the fastest growth, supported by rising applications in aerospace, automotive, and electronics industries where precision and load-bearing capacity validation is vital. Growing focus on material strength, structural testing, and performance optimization further strengthens demand, making force test benches an emerging high-potential segment globally.
By Test Stands, Manual Lead While Motorized Grow Fastest
Manual test stands currently lead the test benches market due to their cost-effectiveness, versatility, and adoption among small to mid-sized enterprises. These systems are widely used in applications where moderate precision and lower capital investment are sufficient. However, motorized test stands are witnessing the fastest growth as industries seek efficiency, automation, and high repeatability. Their integration with IoT, sensors, and digital control enhances productivity and accuracy. With increasing use in automotive, electronics, and industrial sectors, motorized test stands are rapidly transforming the testing landscape worldwide.
Test Benches Market Regional Analysis:
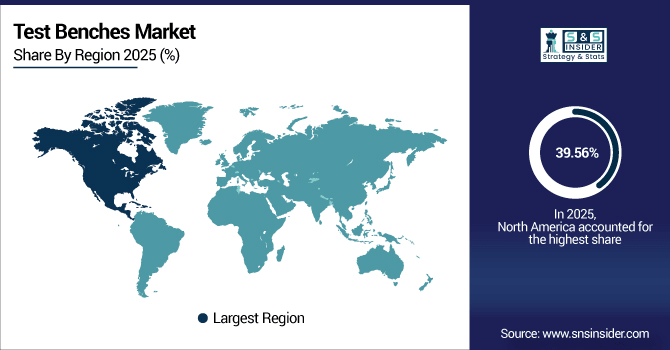
North America Test Benches Market Insights
In 2025E North America dominated the Test Benches Market and accounted for 39.56% of revenue share, this leadership is due to the high focus on innovation, strict safety standards, and quality assurance drive adoption of technologically advanced test benches. The presence of leading players and strong R&D culture boosts development of IoT-enabled and digital twin–integrated systems. Growth in EV production and electronics manufacturing adds further momentum. North America remains a hub for next-generation testing solutions.
Get Customized Report as Per Your Business Requirement - Enquiry Now
U.S. Test Benches Market Insights
The U.S. leads the North American market, supported by strong aerospace, defense, and semiconductor industries. High investments in EV technologies and clean energy drive demand for motorized and automated test benches.
Asia-pacific Test Benches Market Insights
Asia-pacific is expected to witness the fastest growth in the Test Benches Market over 2026-2033, with a projected CAGR of 6.31% due to rapid industrialization and strong manufacturing activity in automotive, electronics, and aerospace sectors. Countries like China, Japan, and South Korea lead in adopting automated testing systems to enhance efficiency. Expanding semiconductor and EV production further fuels market demand. The region also benefits from lower manufacturing costs and increasing R&D investments.
China Test Benches Market Insights
China is the single largest contributor within Asia-Pacific, owing to its robust electronics, automotive, and industrial manufacturing base. Government initiatives promoting industrial automation and energy efficiency support widespread test bench adoption.
Europe Test Benches Market Insights
Europe holds steady market growth, backed by advanced automotive and aerospace industries, particularly in Germany, France, and the U.K. Stringent EU regulations on safety and emissions accelerate the use of precision testing systems. The region also benefits from strong engineering expertise and adoption of Industry 4.0 technologies.
Germany Test Benches Market Insights
Germany dominates Europe’s test benches market, owing to its strong automotive and industrial engineering base. Leading OEMs and Tier-1 suppliers rely heavily on advanced testing systems for quality validation. The country’s leadership in Industry 4.0 supports integration of automation, robotics, and IoT into test benches.
Latin America (LATAM) and Middle East & Africa (MEA) Test Benches Market Insights
Latin America (LATAM) and the Middle East & Africa (MEA) are emerging regions in the test benches market, showing steady growth fueled by automotive expansion in Brazil, Mexico, and industrial diversification in the UAE and Saudi Arabia. Both regions benefit from rising demand across oil & gas, energy, aerospace, and utilities. Limited local manufacturing opens opportunities for global players to strengthen exports. Government investments in infrastructure and renewable energy accelerate adoption.
Test Benches Market Competitive Landscape:
Keysight Technologies provides advanced electronic design and testing solutions, including high-performance test benches. The company focuses on aerospace, defense, automotive, and semiconductor markets, leveraging IoT and 5G advancements. Its innovation in automated testing enhances precision, speed, and market competitiveness globally.
-
In March 2025, introduced a new fixture in its double-pulse test portfolio enabling dynamic testing of Wide-Bandgap (WBG) power semiconductor bare chips without soldering.
National Instruments (NI) is a leading provider of modular testing and measurement systems, offering versatile test benches for automotive, electronics, and aerospace industries. NI emphasizes software-defined, IoT-enabled testing platforms that accelerate product validation, improve scalability, and strengthen global engineering productivity.
-
In April 2025, At NI Connect, Emerson announced hardware and software enhancements including expanded DAQ line (FieldDAQ, CompactDAQ with USB-C), updated connectors, and improved modules for RF test benche.
ATEQ Corporation specializes in leak testing, pressure measurement, and quality control systems, delivering tailored test benches for automotive and industrial applications. With global presence, ATEQ emphasizes high accuracy, compliance with regulatory standards, and integration of automation to optimize industrial testing processes.
-
In April 2025, ATEQ Corporation hosted an Engineering Day in Michigan, focusing on leak testing fundamentals and showcasing their latest innovations in leak testing technologies
Teradyne, Inc. offers automated test equipment and benches supporting semiconductors, electronics, and industrial applications. Known for robotics integration, Teradyne advances flexible, high-precision testing solutions. Its systems cater to consumer electronics, automotive, and 5G markets, enabling efficiency, reliability, and reduced testing costs worldwide.
-
In April 2025, Teradyne announced the integration of its UltraFLEXplus automated test equipment with ficonTEC's advanced optical alignment and wafer handling technologies, enabling double-sided wafer probe testing for silicon photonics.
Test Benches Market Key Players:
Some of the Test Benches Market Companies are:
-
Keysight Technologies, Inc.
-
National Instruments Corporation
-
ATEQ Corporation
-
Teradyne, Inc.
-
Chroma ATE Inc.
-
Com-Ten Industries
-
EFCO Maschinenbau GmbH
-
ABL Automazione S.r.l.
-
AMETEK, Inc.
-
ANDILOG Technologies
-
Blum-Novotest GmbH
-
Bosch Rexroth AG
-
Moog Inc.
-
Rohde & Schwarz
-
Kistler Group
-
MTS Systems
-
PCE Instruments Americas, Inc.
-
dSPACE GmbH
-
Siemens Digital Industries Software
-
AVL List GmbH
| Report Attributes | Details |
|---|---|
| Market Size in 2025 | USD 1.87 Billion |
| Market Size by 2033 | USD 2.90 Billion |
| CAGR | CAGR of 5.72% From 2026 to 2033 |
| Base Year | 2025E |
| Forecast Period | 2026-2033 |
| Historical Data | 2022-2024 |
| Report Scope & Coverage | Market Size, Segments Analysis, Competitive Landscape, Regional Analysis, DROC & SWOT Analysis, Forecast Outlook |
| Key Segments | • By Component (Hardware and Software) • By Application (Semiconductor & Electronics, Industrial Manufacturing & Engineering, Automotive & Transportation, Power Generation & Utilities, Oil & Gas and Others) • By Type (Valve, Force, Torque and Others) • By Test Stands (Manual and Motorized) |
| Regional Analysis/Coverage | North America (US, Canada), Europe (Germany, UK, France, Italy, Spain, Russia, Poland, Rest of Europe), Asia Pacific (China, India, Japan, South Korea, Australia, ASEAN Countries, Rest of Asia Pacific), Middle East & Africa (UAE, Saudi Arabia, Qatar, South Africa, Rest of Middle East & Africa), Latin America (Brazil, Argentina, Mexico, Colombia, Rest of Latin America). |
| Company Profiles | Keysight Technologies, Inc., National Instruments Corporation, ATEQ Corporation, Teradyne, Inc., Chroma ATE Inc., Com-Ten Industries, EFCO Maschinenbau GmbH, ABL Automazione S.r.l., AMETEK, Inc., ANDILOG Technologies, Blum-Novotest GmbH, Bosch Rexroth AG, Moog Inc., Rohde & Schwarz, Kistler Group, MTS Systems, PCE Instruments Americas, Inc., dSPACE GmbH, Siemens Digital Industries Software, AVL List GmbH |
Frequently Asked Questions
Ans: North America dominated the Test Benches Market in 2025E.
Ans: The Hardware segment dominated during the projected period.
Ans: Growth is driven by Rising demand for automated, high-precision, and IoT-enabled test benches across automotive, aerospace, electronics, and industrial sectors drives market growth.
Ans: The market was valued at USD 1.87 Billion in 2025E and is projected to reach USD 2.90 Billion by 2033.
Ans: The Test Benches Market is expected to grow at a CAGR of 5.72% during 2026–2033.
Get in Touch
