Get E-PDF Sample Report on Smart Robot Market - Request Sample Report
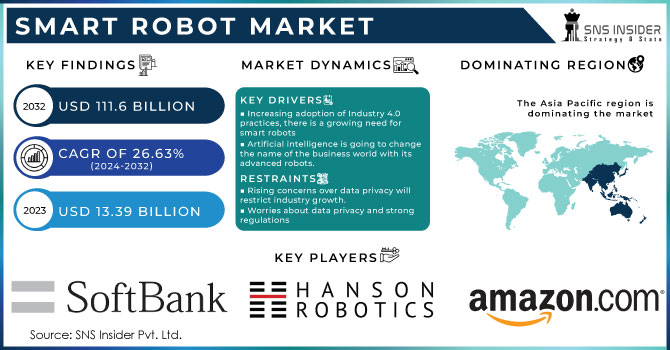
The Smart Robot Market size was valued at USD 13.39 billion in 2023. It is expected to hit USD 111.6 billion by 2032 and grow at a CAGR of 26.63% over the forecast period of 2024-2032.
Intelligent robots are willing to reform supply chain processes. This increased production is essential to manufacturing in that it reduces reliance on humans and allows for scale. The rapid advancements in robotics technology create new opportunities for increased efficiency and reduction of human labor. This, combining with the expanding preference for local production and consumption is likely to propel phenomenal expansion in smart robot market. Industrialization affects the adoption of robots which is then accelerated by automation. Manufacturers of any size can be positively impacted by automated robotics, because they are more accessible and affordable than ever before.
The 2024 World Intelligence Expo boasted the newest in high-tech gadgetry - highlighting robotics as a tool for production. This should have been my fate, but inexplicably I ended up marrying procreation and all its promises instead of the robots in Men-only Heaven with whom guests are encouraged to mess around - bionic robots and human-like ones as well as robotic dogs.
The show also featured remarkable aerial tech, like drones and flying vehicles of all sizes including a cargo-carrying helicopter from a German firm. While robotics are notably more than just the industrial arm off their old and new applications, robotic arms use 5G, AI along with many of today's latest technology to produce some incredibly sharp camera work. But the exhibition was more than a showcase - it also played host to events showcasing what these technologies are capable of, such as the Asia-Pacific Robotics World Cup andtheWorld Intelligent Driving Challenge. This event gave companies the chance to show off their new solutions and explore how far-reaching business opportunities are enabled by smart technology, including digital transformation.
Hyundai Motor Group is boosting smart offices with robots! The DAL-e delivery robot from Hyundai and Kia operating at Factorial Seongsu in Seoul, South Korea features AI facial recognition (claimed to be accurate up to 99.9%) for autonomously traveling inside building premises and delivering parcels directly into the hands of residents The Hyundai WIA Parking Robot parks itself as well, taking control of the wheel to park the car in multiple rows and save space. There is a Max of 50 they can handle for their Smart Parking Control System and in the future, will partner with Hyundai & Kia's Automatic Charging Robot service for EV charging. Hyundai plans to expand the "Robot Total Solution" in more buildings where evolution of workplaces begins with robotic transformation.
Market Dynamics
Drivers
Increasing adoption of Industry 4.0 practices, there is a growing need for smart robots
Increasing demand for smart robotics in the Non-Industrial sector will drive the global service and industrial robots market.
Those smart robots are now longer contained in factory walls anymore. The developers are building robots for different industries resulting in a boom of the market. Robots are a helping hand today while artificial intelligence (AI) and machine learning is taking over better than humans! You truly read this right, it's not sci-fi. Our healthcare sector has already started new surgeries with the help of these robots and they're becoming a part day-by-day in livesages folks. Imagine robots performing complex missions in the future! Robeta is just one more example of an area where robots will be prevalent in the future, with agriculture seeming to have particular promise for an industry that has trouble finding workers willing or able and also spends lots on. Money's no free. At the moment, cyborgs are harvesting crops where they carefully pick fruits and vegetables without damaging them. Ultra-intelligent robots and the best vision technology out there, only a robot with an excellent knowledge can make an accurate call on where produce is ripe. Drones and autonomous tractors are the now-common reality of the robotic revolution, buzzing overhead and checking on crops. Purpose-built robots are also fueling growth in the robot market outside factories, but to an extent rarely seen for automation products.
Artificial intelligence is going to change the name of the business world with its advanced robots.
AI is sort of a power booster for robots. This allows the robots to learn, adapt and deal with complex situations by simulating human-like intelligence. Imagine photo-realistic AI training grounds doing hundreds of challenges in seconds, one after the other whose data can be used to train robots more accurate and intelligent. The rising demand for AI in robots is a no brainer. These are as a part of the cognitive area, so that robots can learn to understand natural languages (natural language processing) etc. This is also used in robotics for free interaction with humans. Robots are becoming stringently precise, intelligent and commercially vogue setting a new benchmark in the intelligent robot industry while their upcoming boom is at par with all things future.
Restraints
Rising concerns over data privacy will restrict industry growth.
Increasing software services for robots are raising ethical concerns related to the ownership of data, which would hinder market growth. Use of domestic robots in not just for education, recreation, but also chores incremented the number of cloud-based data belonging to the individuals. And that data also leaves the companies premises often bought by unauthorized users or third party such as marketing agencies. The data from robots is access in proprietary way, sometimes enables enterprise confidential getting infringed and misused. In the military, defense and healthcare sectors, data breaches carry heavy consequences. Thus, growing data security is becoming a challenge for robots adoption recently and it could significantly suppress the market growth.
Worries about data privacy and strong regulations
With robot helpers appearing higher and better in households for jobs, education, or even simply mere leisure reasons ultimately a privacy alarm is growing. These robots also collect your personal data (such as what time you leave in the morning, or if you have a chronic health condition) that can be uploaded into cloud storage. This could then put your data in danger! It can be bought by third-parties, say marketing agencies for instance and this has led to your privacy being infringed upon directly. Think of voice-controlled robots such Amazon's Lynx and Google's Roomba, they are being recorded all the time. Ensuring data security is paramount. There's also many ethical questions to be considered by governments, as who gather the data that robots do and its possibilities for researching with it.
Segment Analysis
By Type
Personal/Domestic Robots
Professional Robots
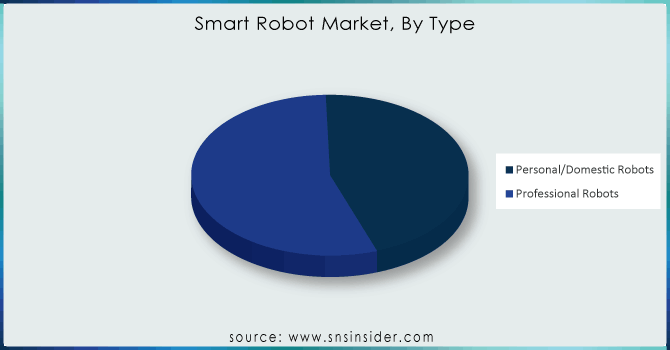
Professional robots presently claim 55% share of the market with respect to smart robots. They are very prevalent in industries like manufacturing, logistics and healthcare where their soundness as well strength is crucial. These robots are ideal for automating dull and dangerous tasks, as they demonstrate good performance in complex assignments at the highest level. A growing demand for these skilled assistants examined the use of automation is increasing, as well there simply are not enough workers. If you see robots in the factories or at hospitals - that's pretty much one of the most demanding things about intelligent robotics field.
Get Customized Report as Per Your Business Requirement - Request For Customized Report
By Mobility
Mobile
Fixed/Stationary
At 56% of the smart robot market, fixed robots now lead they have been around longer and many are traditional manufacturing tasks that occurred on the assembly lines. Basic tasks on these understandable yet affordable machines that are proven, hardworking). This is especially true when dealing with very complicated and nuanced movements that require precision and repeatability, something which mobile robots inherently struggle to accomplish due to the limitations of navigation/stability issues. Even so, the dominance of mobile robots is growing. Navigation technology and battery life are improving their capabilities, and new applications in areas such as logistics and healthcare have showcased the advantage of mobility. Well, the current title holder is actually stationary robots; however, mobile robots are holding Court to win it in future!
By Application
Inspection and Maintenance
Material Handling and Sorting
Security and Surveillance
Education and Entertainment
Sanitation and Disinfection
Others
By End-User
Manufacturing
Healthcare
Agriculture
Military and Defense
Logistics and Warehouse
Education and Entertainment
Others
Regional Analysis
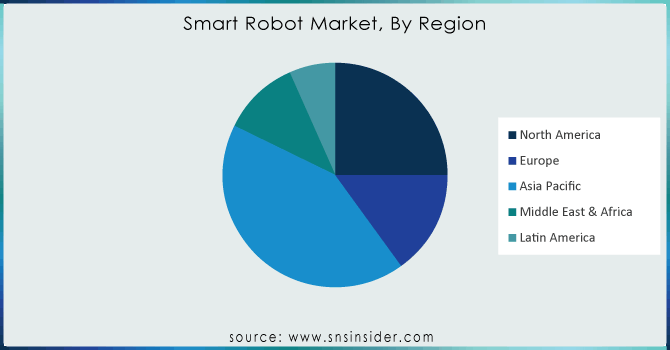
The Asia Pacific commands the largest share in this market with 45% of total smart robot industry. A rapidly growing industrial base in this region, is accelerating the necessity for robotics as it helps to cater huge requirement especially from manufacturing and logistics sector. In this region, governments are like parents of a prodigy - offering financial and regulatory help to robotics as it grows up. Innovation in technology! Indeed, some of the world's most advanced robotics research is taking place in countries like China, Japan and South Korea. That is how Asia Pacific commands the largest market share in smart robots - they have everything perfect to be ruling as robot overlords damn it!
The leading direct return market of the Smart robot industry in a 25% share, North America has maintained rapid growth as demand for industries such as car manufacturing / healthcare/ food production continues. Growth is primarily being driven by better robotics, trade rules work in countries' favor and the more workers make per hour. Use of automation in the region stimulates local robotic knowledge and appeals to investment
REGIONAL COVERAGE:
North America
US
Canada
Mexico
Europe
Eastern Europe
Poland
Romania
Hungary
Turkey
Rest of Eastern Europe
Western Europe
Germany
France
UK
Italy
Spain
Netherlands
Switzerland
Austria
Rest of Western Europe
Asia Pacific
China
India
Japan
South Korea
Vietnam
Singapore
Australia
Rest of Asia Pacific
Middle East & Africa
Middle East
UAE
Egypt
Saudi Arabia
Qatar
Rest of Middle East
Africa
Nigeria
South Africa
Rest of Africa
Latin America
Brazil
Argentina
Colombia
Rest of Latin America
Key Players
The major key players are Hanson Robotics Ltd., KUKA AG, Amazon Inc., SoftBank Corporation, ABB, Honda Motor Company Ltd., OMRON Adept Technology Inc., YASKAWA Electric Corporation, Blue Frog Robotics, DeLaval, Intuitive Surgical, Samsung Electronics Co. Ltd., Hyundai Motor Group and other.
Recent Development
In 2024, Hyundai deployed robots for deliveries and parking in a Seoul office building, showcasing their self-driving and AI capabilities.
In April 2022, Yaskawa Company developed an industrial robot equipped with artificial intelligence that can accurately identify the color and shape of objects, efficiently transporting them to their designated positions.
Report Attributes | Details |
---|---|
Market Size in 2023 | US$ 13.39 billion |
Market Size by 2031 | US$ 111.6 Billion |
CAGR | CAGR of 26.63% From 2024 to 2032 |
Base Year | 2023 |
Forecast Period | 2024-2031 |
Historical Data | 2020-2022 |
Report Scope & Coverage | Market Size, Segments Analysis, Competitive Landscape, Regional Analysis, DROC & SWOT Analysis, Forecast Outlook |
Key Segments | • By Type (Personal/Domestic Robots, Professional Robots) • By Mobility (Mobile, Fixed/Stationary) • By Application (Inspection and Maintenance, Material Handling and Sorting, Security and Surveillance, Education and Entertainment, Sanitation and Disinfection, Others) • By End User (Manufacturing, Healthcare, Agriculture, Military and Defense, Logistics and Warehouse, Education and Entertainment, Others) |
Regional Analysis/Coverage | North America (US, Canada, Mexico), Europe (Eastern Europe [Poland, Romania, Hungary, Turkey, Rest of Eastern Europe] Western Europe] Germany, France, UK, Italy, Spain, Netherlands, Switzerland, Austria, Rest of Western Europe]), Asia Pacific (China, India, Japan, South Korea, Vietnam, Singapore, Australia, Rest of Asia Pacific), Middle East & Africa (Middle East [UAE, Egypt, Saudi Arabia, Qatar, Rest of Middle East], Africa [Nigeria, South Africa, Rest of Africa], Latin America (Brazil, Argentina, Colombia, Rest of Latin America) |
Company Profiles | Hanson Robotics Ltd., KUKA AG, Amazon Inc., SoftBank Corporation, ABB, Honda Motor Company Ltd., OMRON Adept Technology Inc., YASKAWA Electric Corporation, Blue Frog Robotics, DeLaval, Intuitive Surgical, Samsung Electronics Co. Ltd., Hyundai Motor Group |
Key Drivers | • Increasing demand for smart robotics in the Non-Industrial sector will drive the global service and industrial robots market. • Artificial intelligence is going to change the name of the business world with its advanced robots. |
RESTRAINTS | • Rising concerns over data privacy will restrict industry growth. • Worries about data privacy and strong regulations |
Ans. Rising demand for HEVs/PHEVs and clean energy storage are driving the Smart Robot market.
Ans. The Smart Robot Market size was valued at USD 13.39 billion in 2023. It is expected to hit USD 111.6 billion by 2032 and grow at a CAGR of 26.63% over the forecast period of 2024-2032.
Ans North America region is anticipated to record the Fastest Growing in the Smart Robot Market.
Ans .The Professional Segment is leading in the market revenue share in 2023.
Ans. Asia Pacific is expected to hold the largest market share in the Smart Robot Market during the forecast period.
TABLE OF CONTENTS
1. Introduction
1.1 Market Definition
1.2 Scope
1.3 Research Assumptions
2. Industry Flowchart
3. Research Methodology
4. Market Dynamics
4.1 Drivers
4.2 Restraints
4.3 Opportunities
4.4 Challenges
5. Porter’s 5 Forces Model
6. Pest Analysis
7. Smart Robot Segmentation, By Type
7.1 Introduction
7.2 Personal/Domestic Robots
7.3 Professional Robots
8. Smart Robot Segmentation, By Mobility
8.1 Introduction
8.2 Mobile
8.3 Fixed/Stationary
9. Smart Robot Segmentation, By Application
9.1 Introduction
9.2 Inspection and Maintenance
9.3 Material Handling and Sorting
9.4 Security and Surveillance
9.5 Sanitation and Disinfection
9.6 Others
10. Smart Robot Segmentation, By End User
10.1 Introduction
10.2 Manufacturing
10.3 Healthcare
10.4 Agriculture
10.5 Military and Defense
10.6 Logistics and Warehouse
10.7 Education and Entertainment
10.8 Others
11. Regional Analysis
11.1 Introduction
11.2 North America
11.2.1 Trend Analysis
11.2.2 North America Smart Robot by Country
11.2.3 North America Smart Robot By Type
11.2.4 North America Smart Robot By Mobility
11.2.5 North America Smart Robot By Application
11.2.6 North America Smart Robot By End User
11.2.7 USA
11.2.7.1 USA Smart Robot By Type
11.2.7.2 USA Smart Robot By Mobility
11.2.7.3 USA Smart Robot By Application
11.2.7.4 USA Smart Robot By End User
11.2.8 Canada
11.2.8.1 Canada Smart Robot By Type
11.2.8.2 Canada Smart Robot By Mobility
11.2.8.3 Canada Smart Robot By Application
11.2.8.4 Canada Smart Robot By End User
11.2.9 Mexico
11.2.9.1 Mexico Smart Robot By Type
11.2.9.2 Mexico Smart Robot By Mobility
11.2.9.3 Mexico Smart Robot By Application
11.2.9.4 Mexico Smart Robot By End User
11.3 Europe
11.3.1 Trend Analysis
11.3.2 Eastern Europe
11.3.2.1 Eastern Europe Smart Robot by Country
11.3.2.2 Eastern Europe Smart Robot By Type
11.3.2.3 Eastern Europe Smart Robot By Mobility
11.3.2.4 Eastern Europe Smart Robot By Application
11.3.2.5 Eastern Europe Smart Robot By End User
11.3.2.6 Poland
11.3.2.6.1 Poland Smart Robot By Type
11.3.2.6.2 Poland Smart Robot By Mobility
11.3.2.6.3 Poland Smart Robot By Application
11.3.2.6.4 Poland Smart Robot By End User
11.3.2.7 Romania
11.3.2.7.1 Romania Smart Robot By Type
11.3.2.7.2 Romania Smart Robot By Mobility
11.3.2.7.3 Romania Smart Robot By Application
11.3.2.7.4 Romania Smart Robot By End User
11.3.2.8 Hungary
11.3.2.8.1 Hungary Smart Robot By Type
11.3.2.8.2 Hungary Smart Robot By Mobility
11.3.2.8.3 Hungary Smart Robot By Application
11.3.2.8.4 Hungary Smart Robot By End User
11.3.2.9 Turkey
11.3.2.9.1 Turkey Smart Robot By Type
11.3.2.9.2 Turkey Smart Robot By Mobility
11.3.2.9.3 Turkey Smart Robot By Application
11.3.2.9.4 Turkey Smart Robot By End User
11.3.2.10 Rest of Eastern Europe
11.3.2.10.1 Rest of Eastern Europe Smart Robot By Type
11.3.2.10.2 Rest of Eastern Europe Smart Robot By Mobility
11.3.2.10.3 Rest of Eastern Europe Smart Robot By Application
11.3.2.10.4 Rest of Eastern Europe Smart Robot By End User
11.3.3 Western Europe
11.3.3.1 Western Europe Smart Robot by Country
11.3.3.2 Western Europe Smart Robot By Type
11.3.3.3 Western Europe Smart Robot By Mobility
11.3.3.4 Western Europe Smart Robot By Application
11.3.3.5 Western Europe Smart Robot By End User
11.3.3.6 Germany
11.3.3.6.1 Germany Smart Robot By Type
11.3.3.6.2 Germany Smart Robot By Mobility
11.3.3.6.3 Germany Smart Robot By Application
11.3.3.6.4 Germany Smart Robot By End User
11.3.3.7 France
11.3.3.7.1 France Smart Robot By Type
11.3.3.7.2 France Smart Robot By Mobility
11.3.3.7.3 France Smart Robot By Application
11.3.3.7.4 France Smart Robot By End User
11.3.3.8 UK
11.3.3.8.1 UK Smart Robot By Type
11.3.3.8.2 UK Smart Robot By Mobility
11.3.3.8.3 UK Smart Robot By Application
11.3.3.8.4 UK Smart Robot By End User
11.3.3.9 Italy
11.3.3.9.1 Italy Smart Robot By Type
11.3.3.9.2 Italy Smart Robot By Mobility
11.3.3.9.3 Italy Smart Robot By Application
11.3.3.9.4 Italy Smart Robot By End User
11.3.3.10 Spain
11.3.3.10.1 Spain Smart Robot By Type
11.3.3.10.2 Spain Smart Robot By Mobility
11.3.3.10.3 Spain Smart Robot By Application
11.3.3.10.4 Spain Smart Robot By End User
11.3.3.11 Netherlands
11.3.3.11.1 Netherlands Smart Robot By Type
11.3.3.11.2 Netherlands Smart Robot By Mobility
11.3.3.11.3 Netherlands Smart Robot By Application
11.3.3.11.4 Netherlands Smart Robot By End User
11.3.3.12 Switzerland
11.3.3.12.1 Switzerland Smart Robot By Type
11.3.3.12.2 Switzerland Smart Robot By Mobility
11.3.3.12.3 Switzerland Smart Robot By Application
11.3.3.12.4 Switzerland Smart Robot By End User
11.3.3.13 Austria
11.3.3.13.1 Austria Smart Robot By Type
11.3.3.13.2 Austria Smart Robot By Mobility
11.3.3.13.3 Austria Smart Robot By Application
11.3.3.13.4 Austria Smart Robot By End User
11.3.3.14 Rest of Western Europe
11.3.3.14.1 Rest of Western Europe Smart Robot By Type
11.3.3.14.2 Rest of Western Europe Smart Robot By Mobility
11.3.3.14.3 Rest of Western Europe Smart Robot By Application
11.3.3.14.4 Rest of Western Europe Smart Robot By End User
11.4 Asia-Pacific
11.4.1 Trend Analysis
11.4.2 Asia-Pacific Smart Robot by Country
11.4.3 Asia-Pacific Smart Robot By Type
11.4.4 Asia-Pacific Smart Robot By Mobility
11.4.5 Asia-Pacific Smart Robot By Application
11.4.6 Asia-Pacific Smart Robot By End User
11.4.7 China
11.4.7.1 China Smart Robot By Type
11.4.7.2 China Smart Robot By Mobility
11.4.7.3 China Smart Robot By Application
11.4.7.4 China Smart Robot By End User
11.4.8 India
11.4.8.1 India Smart Robot By Type
11.4.8.2 India Smart Robot By Mobility
11.4.8.3 India Smart Robot By Application
11.4.8.4 India Smart Robot By End User
11.4.9 Japan
11.4.9.1 Japan Smart Robot By Type
11.4.9.2 Japan Smart Robot By Mobility
11.4.9.3 Japan Smart Robot By Application
11.4.9.4 Japan Smart Robot By End User
11.4.10 South Korea
11.4.10.1 South Korea Smart Robot By Type
11.4.10.2 South Korea Smart Robot By Mobility
11.4.10.3 South Korea Smart Robot By Application
11.4.10.4 South Korea Smart Robot By End User
11.4.11 Vietnam
11.4.11.1 Vietnam Smart Robot By Type
11.4.11.2 Vietnam Smart Robot By Mobility
11.4.11.3 Vietnam Smart Robot By Application
11.4.11.4 Vietnam Smart Robot By End User
11.4.12 Singapore
11.4.12.1 Singapore Smart Robot By Type
11.4.12.2 Singapore Smart Robot By Mobility
11.4.12.3 Singapore Smart Robot By Application
11.4.12.4 Singapore Smart Robot By End User
11.4.13 Australia
11.4.13.1 Australia Smart Robot By Type
11.4.13.2 Australia Smart Robot By Mobility
11.4.13.3 Australia Smart Robot By Application
11.4.13.4 Australia Smart Robot By End User
11.4.14 Rest of Asia-Pacific
11.4.14.1 Rest of Asia-Pacific Smart Robot By Type
11.4.14.2 Rest of Asia-Pacific Smart Robot By Mobility
11.4.14.3 Rest of Asia-Pacific Smart Robot By Application
11.4.14.4 Rest of Asia-Pacific Smart Robot By End User
11.5 Middle East & Africa
11.5.1 Trend Analysis
11.5.2 Middle East
11.5.2.1 Middle East Smart Robot by Country
11.5.2.2 Middle East Smart Robot By Type
11.5.2.3 Middle East Smart Robot By Mobility
11.5.2.4 Middle East Smart Robot By Application
11.5.2.5 Middle East Smart Robot By End User
11.5.2.6 UAE
11.5.2.6.1 UAE Smart Robot By Type
11.5.2.6.2 UAE Smart Robot By Mobility
11.5.2.6.3 UAE Smart Robot By Application
11.5.2.6.4 UAE Smart Robot By End User
11.5.2.7 Egypt
11.5.2.7.1 Egypt Smart Robot By Type
11.5.2.7.2 Egypt Smart Robot By Mobility
11.5.2.7.3 Egypt Smart Robot By Application
11.5.2.7.4 Egypt Smart Robot By End User
11.5.2.8 Saudi Arabia
11.5.2.8.1 Saudi Arabia Smart Robot By Type
11.5.2.8.2 Saudi Arabia Smart Robot By Mobility
11.5.2.8.3 Saudi Arabia Smart Robot By Application
11.5.2.8.4 Saudi Arabia Smart Robot By End User
11.5.2.9 Qatar
11.5.2.9.1 Qatar Smart Robot By Type
11.5.2.9.2 Qatar Smart Robot By Mobility
11.5.2.9.3 Qatar Smart Robot By Application
11.5.2.9.4 Qatar Smart Robot By End User
11.5.2.10 Rest of Middle East
11.5.2.10.1 Rest of Middle East Smart Robot By Type
11.5.2.10.2 Rest of Middle East Smart Robot By Mobility
11.5.2.10.3 Rest of Middle East Smart Robot By Application
11.5.2.10.4 Rest of Middle East Smart Robot By End User
11.5.3 Africa
11.5.3.1 Africa Smart Robot by Country
11.5.3.2 Africa Smart Robot By Type
11.5.3.3 Africa Smart Robot By Mobility
11.5.3.4 Africa Smart Robot By Application
11.5.3.5 Africa Smart Robot By End User
11.5.3.6 Nigeria
11.5.3.6.1 Nigeria Smart Robot By Type
11.5.3.6.2 Nigeria Smart Robot By Mobility
11.5.3.6.3 Nigeria Smart Robot By Application
11.5.3.6.4 Nigeria Smart Robot By End User
11.5.3.7 South Africa
11.5.3.7.1 South Africa Smart Robot By Type
11.5.3.7.2 South Africa Smart Robot By Mobility
11.5.3.7.3 South Africa Smart Robot By Application
11.5.3.7.4 South Africa Smart Robot By End User
11.5.3.8 Rest of Africa
11.5.3.8.1 Rest of Africa Smart Robot By Type
11.5.3.8.2 Rest of Africa Smart Robot By Mobility
11.5.3.8.3 Rest of Africa Smart Robot By Application
11.5.3.8.4 Rest of Africa Smart Robot By End User
11.6 Latin America
11.6.1 Trend Analysis
11.6.2 Latin America Smart Robot by Country
11.6.3 Latin America Smart Robot By Type
11.6.4 Latin America Smart Robot By Mobility
11.6.5 Latin America Smart Robot By Application
11.6.6 Latin America Smart Robot By End User
11.6.7 Brazil
11.6.7.1 Brazil Smart Robot By Type
11.6.7.2 Brazil Smart Robot By Mobility
11.6.7.3 Brazil Smart Robot By Application
11.6.7.4 Brazil Smart Robot By End User
11.6.8 Argentina
11.6.8.1 Argentina Smart Robot By Type
11.6.8.2 Argentina Smart Robot By Mobility
11.6.8.3 Argentina Smart Robot By Application
11.6.8.4 Argentina Smart Robot By End User
11.6.9 Colombia
11.6.9.1 Colombia Smart Robot By Type
11.6.9.2 Colombia Smart Robot By Mobility
11.6.9.3 Colombia Smart Robot By Application
11.6.9.4 Colombia Smart Robot By End User
11.6.10 Rest of Latin America
11.6.10.1 Rest of Latin America Smart Robot By Type
11.6.10.2 Rest of Latin America Smart Robot By Mobility
11.6.10.3 Rest of Latin America Smart Robot By Application
11.6.10.4 Rest of Latin America Smart Robot By End User
12. Company Profiles
12.1 Hanson Robotics Ltd.,
12.1.1 Company Overview
12.1.2 Financial
12.1.3 Products/ Services Offered
12.1.4 The SNS View
12.2 KUKA AG
12.2.1 Company Overview
12.2.2 Financial
12.2.3 Products/ Services Offered
12.2.4 The SNS View
12.3 Amazon Inc.
12.3.1 Company Overview
12.3.2 Financial
12.3.3 Products/ Services Offered
12.3.4 The SNS View
12.4 SoftBank Corporation
12.4.1 Company Overview
12.4.2 Financial
12.4.3 Products/ Services Offered
12.4.4 The SNS View
12.5 ABB, Honda Motor Company Ltd.
12.5.1 Company Overview
12.5.2 Financial
12.5.3 Products/ Services Offered
12.5.4 The SNS View
12.6 OMRON Adept Technology Inc.
12.6.1 Company Overview
12.6.2 Financial
12.6.3 Products/ Services Offered
12.6.4 The SNS View
12.7 YASKAWA Electric Corporation
12.7.1 Company Overview
12.7.2 Financial
12.7.3 Products/ Services Offered
12.7.4 The SNS View
12.8 Blue Frog Robotics
12.8.1 Company Overview
12.8.2 Financial
12.8.3 Products/ Services Offered
12.8.4 The SNS View
12.9 , DeLaval
12.9.1 Company Overview
12.9.2 Financial
12.9.3 Products/ Services Offered
12.9.4 The SNS View
12.10 Intuitive Surgical.
12.10.1 Company Overview
12.10.2 Financial
12.10.3 Products/ Services Offered
12.10.4 The SNS View
12.11 Samsung Electronics Co. Ltd
12.11.1 Company Overview
12.11.2 Financial
12.11.3 Products/ Services Offered
12.11.4 The SNS View
12.12 Hyundai Motor Group
12.12.1 Company Overview
12.12.2 Financial
12.12.3 Products/ Services Offered
12.12.4 The SNS View
12.13 Others
12.13.1 Company Overview
12.13.2 Financial
12.13.3 Products/ Services Offered
12.13.4 The SNS View
13. Competitive Landscape
13.1 Competitive Benchmarking
13.2 Market Share Analysis
13.3 Recent Developments
13.3.1 Industry News
13.3.2 Company News
13.3.3 Mergers & Acquisitions
14. Use Case and Best Practices
15. Conclusion
An accurate research report requires proper strategizing as well as implementation. There are multiple factors involved in the completion of good and accurate research report and selecting the best methodology to compete the research is the toughest part. Since the research reports we provide play a crucial role in any company’s decision-making process, therefore we at SNS Insider always believe that we should choose the best method which gives us results closer to reality. This allows us to reach at a stage wherein we can provide our clients best and accurate investment to output ratio.
Each report that we prepare takes a timeframe of 350-400 business hours for production. Starting from the selection of titles through a couple of in-depth brain storming session to the final QC process before uploading our titles on our website we dedicate around 350 working hours. The titles are selected based on their current market cap and the foreseen CAGR and growth.
The 5 steps process:
Step 1: Secondary Research:
Secondary Research or Desk Research is as the name suggests is a research process wherein, we collect data through the readily available information. In this process we use various paid and unpaid databases which our team has access to and gather data through the same. This includes examining of listed companies’ annual reports, Journals, SEC filling etc. Apart from this our team has access to various associations across the globe across different industries. Lastly, we have exchange relationships with various university as well as individual libraries.
Step 2: Primary Research
When we talk about primary research, it is a type of study in which the researchers collect relevant data samples directly, rather than relying on previously collected data. This type of research is focused on gaining content specific facts that can be sued to solve specific problems. Since the collected data is fresh and first hand therefore it makes the study more accurate and genuine.
We at SNS Insider have divided Primary Research into 2 parts.
Part 1 wherein we interview the KOLs of major players as well as the upcoming ones across various geographic regions. This allows us to have their view over the market scenario and acts as an important tool to come closer to the accurate market numbers. As many as 45 paid and unpaid primary interviews are taken from both the demand and supply side of the industry to make sure we land at an accurate judgement and analysis of the market.
This step involves the triangulation of data wherein our team analyses the interview transcripts, online survey responses and observation of on filed participants. The below mentioned chart should give a better understanding of the part 1 of the primary interview.
Part 2: In this part of primary research the data collected via secondary research and the part 1 of the primary research is validated with the interviews from individual consultants and subject matter experts.
Consultants are those set of people who have at least 12 years of experience and expertise within the industry whereas Subject Matter Experts are those with at least 15 years of experience behind their back within the same space. The data with the help of two main processes i.e., FGDs (Focused Group Discussions) and IDs (Individual Discussions). This gives us a 3rd party nonbiased primary view of the market scenario making it a more dependable one while collation of the data pointers.
Step 3: Data Bank Validation
Once all the information is collected via primary and secondary sources, we run that information for data validation. At our intelligence centre our research heads track a lot of information related to the market which includes the quarterly reports, the daily stock prices, and other relevant information. Our data bank server gets updated every fortnight and that is how the information which we collected using our primary and secondary information is revalidated in real time.
Step 4: QA/QC Process
After all the data collection and validation our team does a final level of quality check and quality assurance to get rid of any unwanted or undesired mistakes. This might include but not limited to getting rid of the any typos, duplication of numbers or missing of any important information. The people involved in this process include technical content writers, research heads and graphics people. Once this process is completed the title gets uploader on our platform for our clients to read it.
Step 5: Final QC/QA Process:
This is the last process and comes when the client has ordered the study. In this process a final QA/QC is done before the study is emailed to the client. Since we believe in giving our clients a good experience of our research studies, therefore, to make sure that we do not lack at our end in any way humanly possible we do a final round of quality check and then dispatch the study to the client.
The Microprocessor Market Size was valued at USD 62.67 billion in 2023 and is expected to reach USD 126.91 billion by 2032 and grow at a CAGR of 8.20% over the forecast period 2024-2032
The Marine Variable Frequency Drive Market size was valued at USD 850.22 million in 2022 and is expected to grow to USD 1365.38 million by 2030 and grow at a CAGR of 6.1% over the forecast period of 2023-2030.
The High-Frequency Transformer Market Size was valued at USD 1.95 billion in 2023, and expected to reach USD 3.1 billion by 2031, and grow at a CAGR of 5.86 % over the forecast period 2024-2031.
The AR and VR in Education Market size was valued at USD 3.9 billion in 2023 and is expected to grow to USD 30.7 billion by 2031 and grow at a CAGR of 26.4 % over the forecast period of 2024-2031.
The Power Over Ethernet Devices Market Size was valued at USD 0.96 billion in 2023 and is expected to reach USD 2.79 billion by 2032 and grow at a CAGR of 12.6% over the forecast period 2024-2032.
The AI in Networks Market Size was valued at USD 8.33 Billion in 2023 and is expected to reach USD 101.29 Billion by 2032, at 32.14% CAGR, during 2024-2032
Hi! Click one of our member below to chat on Phone