Connector Market Size & Trends:
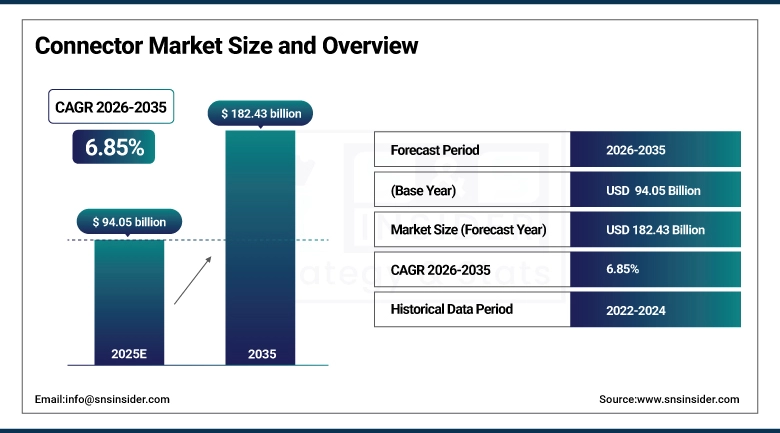
The Connector Market was valued at USD 94.05 billion in 2025 and is expected to reach USD 182.43 billion by 2035, growing at a CAGR of 6.85% from 2026-2035.
The global market report has been classified based on the product, technology, signal type, end-user, and region along with the competitive landscape analysis within the regions of North America, Europe, Asia Pacific, Latin America, and the Middle East & Africa. Connector Market analysis reveals shifting trends across industrial and consumer segments. Demand for faster, smaller and more rugged connectors is increasing in almost every sector as industrial automation & control, data center infrastructure, EV adoption & installation and proliferation of smart devices progress, creating innovation and growth opportunities with a strong international base.
For instance, over 60% of new connector designs released in 2024 were classified as compact or ultra-miniature, supporting space-constrained electronics.
Connector Market Size and Forecast
-
Market Size in 2025: USD 94.05 Billion
-
Market Size by 2035: USD 182.43 Billion
-
CAGR: 6.85% from 2026 to 2035
-
Base Year: 2025
-
Forecast Period: 2026–2035
-
Historical Data: 2022–2024
To Get more information On Connector Market - Request Free Sample Report
Connector Market Trends
-
Rising demand for electronic and electrical devices across automotive, telecom, and consumer electronics is driving the connector market.
-
Growing adoption of high-speed, miniaturized, and reliable connectors is boosting market growth.
-
Expansion of electric vehicles, renewable energy, and industrial automation is fueling connector deployment.
-
Increasing focus on durability, heat resistance, and signal integrity is shaping adoption trends.
-
Advancements in fiber optic, USB, and wireless connectors are enhancing performance and compatibility.
-
Rising industrialization and smart infrastructure development are supporting market expansion.
-
Collaborations between connector manufacturers, OEMs, and technology providers are accelerating innovation and global market reach.
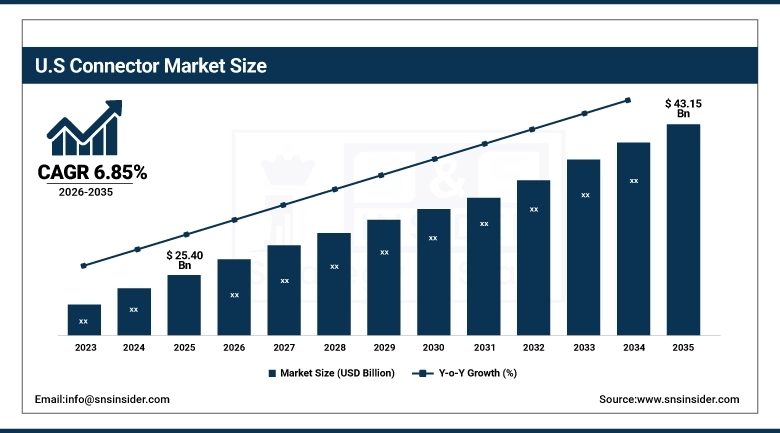
The U.S. Connector Market was valued at USD 25.40 billion in 2025 and is expected to reach USD 43.15 billion by 2035, growing at a CAGR of 6.85% from 2026-2035.
The U.S. market is witnessing strong connector market growth fueled by mass adoption of superior connectivity solutions across defense, aerospace, telecom, and electric automobile industries. New technologies such as automation, smart manufacturing, and 5G networks, are boosting the adoption of the connectors, which require high-speed data transmission and reliability. And moreover, market expansion and introduction of technology in India connector market are also propelled by nearshoring strategies, R&D spending and seamless government incentives in infrastructure and digital means of communication.
For instance, over 75% of connectors used in U.S. aerospace applications meet MIL-SPEC requirements for vibration resistance and extreme temperature tolerance.
Connector Market Growth Drivers:
-
Surging Data Traffic and Cloud Infrastructure Expansion Fuel Demand for High-Speed and High-Density Connector Technologies
The accelerated demand for high-performance, high-density connectors for enabling high capacity and speed data traffic globally, modern cloud-based environments, and growing hyperscale data centers. As a result, enterprises and service providers are upgrading infrastructure for support of significant bandwidth needs bringing about take-up of fiber optic and high repetition connectors. It is also spurring the demand for connection to specialized, low-latency, and edge computing and AI workloads. The growth of digital transformations is fueling need for relentless innovation in connector materials, designs, and signal integrity, making connectivity components critical enablers of future-proof IT and communication ecosystems.
For instance, over 35% of R&D efforts in connector manufacturing are focused on miniaturization to support AI chips and edge devices.
Connector Market Restraints:
-
Price Volatility and Cost Pressures from Raw Material Fluctuations Affect Profit Margins Across Connector Manufacturers
Connectors manufacturing cost is greatly influenced by how the prices of essential materials such as copper, gold, and polymers behave, thus making them fluctuate. Its volatility is difficult to predict and often changes quickly due to global economics, trade wars, or climate change policies. For manufacturers, balancing quality and cost is key challenge, especially when a high volume order is placed from the automotive or electronics sectors. Such fluctuations can constrict margins and make contracts more difficult to maintain, and require more price hedging, which invariably affects long-term profitability.
Connector Market Opportunities:
-
Miniaturization And Modular Designs in Medical Devices and Wearables Create High-Value Opportunities for Connector Innovation
Increasing demand for medical equipment in miniaturized form factors and wearable electronics coupled with the requirement for miniature and modular connectors is boosting the segmental growth of global connectors revenue for medical devices. This means these connectors needs to provide high signal integrity, reliability and ruggedness in smaller form factors. These include implantables, diagnostics, remote monitoring, and smart wearables. As patients turn to telehealth and remote patient care models, the demand for small, high performing connectors is increasing.
For instance, modern diagnostic equipment often requires connectors supporting up to 30 signal lines per square centimeter in miniaturized layouts.
Connector Market Challenges:
-
Increasing Counterfeit and Inferior Quality Connectors Represent Threats to Reliability and Quality Control for the OEM
Counterfeit or low-grade products are becoming more rampant in the global connector market, especially in price-sensitive countries and e-commerce platforms. Such low-quality connectors generally do not pass industry certifications and cause performance issues, overheating, or system failure. The quality assurance of huge supply chains, especially when components are sourced from different vendors, is a challenge for OEMs. In applications where reliability is a must (such as medical devices, automotive electronics, and aerospace systems), counterfeit components threaten brand reputation, warranty costs, and compliance. Connector Market trends highlight a growing emphasis on supply chain traceability.
Connector Market Segmentation Analysis:
By Product
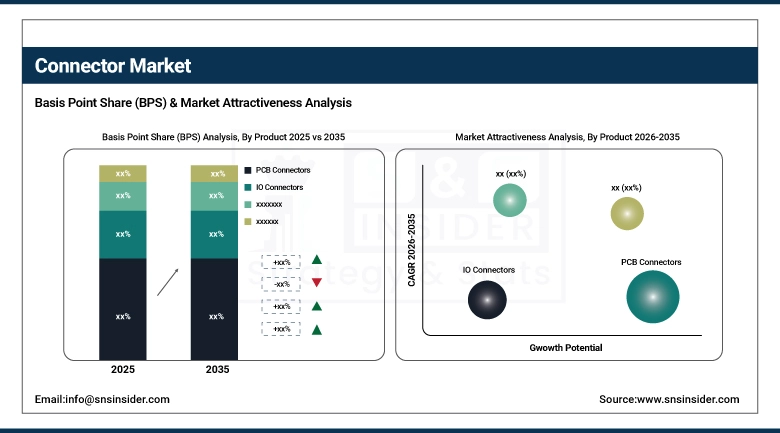
In 2025, PCB connectors held the largest revenue share of 28.20% owing to their widespread use across consumer electronics, industrial equipment, and automotive systems. One of the larger manufacturers, TE Connectivity, has continued to develop for this area to enable high speed and compact circuit architectures. Their versatility and cost-effectiveness guarantee steady demand in high-volume applications in number of industries.
The fastest CAGR (9.24%) for the forecast period, 2026 to 2035 has been estimated for Fiber optic connectors. This growth is driven by the expansion of broadband, 5G infrastructure and cloud-based networks. Corning has pioneered optical connectivity solutions, producing innovative connectors that enable low-loss and high-bandwidth transmission capabilities. Continued demand and need for higher-speed, lower-latency data keeps this segment on the rise.
By Signal Type
The revenue share of power connectors held a leading share of 52.50% in 2025, on account of extensive applications in electric power distribution, transportation, and automation. As a technology leader in this segment, Phoenix Contact has been a pioneer in rugged, efficient power connector solutions for industrial and heavy-duty applications. As they handle high voltage and current, they provide durability across all low to mission-critical systems.
The hybrid connectors will witness a growth of 7.34% CAGR between the years of 2026 and 2035, mainly due to the hybrid type connectors that can transmit the data and the power through a single interface. One of the leading innovators, Harting is working on hybrid connector systems for electric vehicles and robotics, which take up little space. They are being adopted more and more in small and multi-function designs needing both data and power channels.
By Technology
In 2025, 62.45% of the market was attributed to wired connectors as they feature higher durability, cost-effectiveness, and more stable performances. One mainstay is 3M, which still provides proven wired connects for medical, consumer, and industrial environments. Wired connectors are still important in environments where the fastest and most secure connections are required, despite increasing competition from wireless.
The market for wireless connectors is projected to increase at a CAGR of 8.03% until 2035, driven by increasing demand in smart wearables, IoT, and mobile devices. Laird Connectivity is helping drive this growth by delivering next gen wireless modules and connectors that are 5G and low-latency network-ready. Such solutions support high-speed data transfer without any traditional physical connections.
By End-User
In 2025, the largest connector market share of around 26.25% was held by the telecom sector due to rapid deployment of 5G and fiber-optic applications. CommScope is a global network infrastructure provider and supplier of Michigandependent connector components essential to cellular base station and data transmission systems. Telecom has maintained leading end-user demand as global mobile data usage approaches 100 exabytes a month.
The automotive is estimated to be the fastest growing segment with a CAGR of 7.96% during the forecast period (2026–2035) due to the EV adoption and vehicle electrification. Aptiv — A global technology company that develops safer, greener and more connected solutions enabling the advancement of automotive technology is developing high-reliability connectors designed for ADAS, infotainment and battery management systems. As electric and smart vehicles keep changing the landscape of mobility, this segment is flourishing.
Connector Market Regional Analysis
Asia Pacific Connector Market Insights
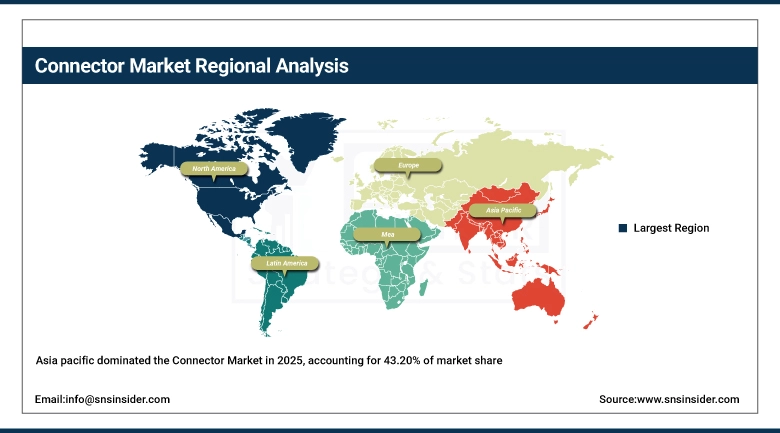
Asia pacific dominated the connector market and accounted for around 43.20% revenue share in 2025, owing to its position as the electronics manufacturing capital of the world. Largely OEMS and contract manufacturers and component suppliers are located in countries such as China, Japan, South Korea, and India. Demand across the telecom's, industrial's and automotive sector with the boom of infrastructure development and a favorable manufacturing ecosystem make the region a nerve center of the market.
-
China leads the Asia Pacific connector market as it hosts a vast electronics manufacturing ecosystem, global OEMs, and robust demand from telecom, consumer electronics, and automotive industries, driven by strong government support and rapid industrialization.
Get Customized Report as per Your Business Requirement - Enquiry Now
North America Connector Market Insights
In 2025, North America’s connector market is thriving due to rapid advancements in telecommunications, aerospace, automotive, and defense sectors. The region benefits from strong R&D capabilities, robust technological infrastructure, and increasing adoption of electric vehicles and 5G networks. Key players are focusing on innovation and local manufacturing to meet growing demand for high-speed, durable, and compact connectors across critical applications.
-
The U.S. dominates North America’s connector market due to its advanced defense, aerospace, and automotive sectors, extensive data center infrastructure, and strong domestic manufacturing base supported by high R&D investment and government-backed digital transformation initiatives.
Europe Connector Market Insights
Europe is expected to grow at the fastest CAGR of about 7.95% during 2026 to 2033 owing to the increasing production of electric vehicles and the adoption of smart factories. Rising demand for advanced connectors due to government-backed sustainable energy and digital infrastructure investments and intelligent transportation system is another factor driving the growth of specialty connector market. With nations throughout the region adopting Industry 4.0 and green technologies, Europe is a significant focal point for the disruption and assimilation of connectors.
-
Germany dominates the European connector market due to its advanced automotive sector, strong industrial automation, and presence of major OEMs and connector manufacturers. Its focus on electric vehicles and Industry 4.0 drives substantial demand for high-performance, reliable connectivity solutions.
Middle East & Africa and Latin America Connector Market Insights
The Middle East & Africa connector industry is led by the UAE, driven by infrastructure expansion, digital transformation, and defense modernization. In Latin America, Brazil dominates due to its strong automotive manufacturing base and rising investments in telecom and industrial automation, supporting consistent demand for reliable and advanced connector solutions.
Connector Market Competitive Landscape:
Molex LLC
Molex LLC develops advanced electronic, optical, and electrical interconnect solutions for automotive, industrial, and data communications applications. The company focuses on modular connectors, high-speed data terminals, and hybrid solutions that simplify wiring harnesses and support next-generation automotive architectures. Molex integrates power, signal, and data technologies to enhance efficiency, reduce complexity, and support emerging mobility and electric vehicle systems, while driving innovation in flexible, scalable, and reliable interconnect solutions across multiple industries.
-
2025 – Molex unveiled MX‑DaSH Modular Wire-to-Wire Connectors, combining power, signal, and high-speed data terminals to streamline automotive zonal architecture and wiring harness complexity.
Amphenol Corporation
Amphenol Corporation is a leading global provider of interconnect systems, including electrical, fiber-optic, and RF connectors, catering to automotive, industrial, telecommunications, and energy sectors. The company emphasizes reliable, high-performance, and environmentally robust connector solutions. Amphenol invests in electrification, EV infrastructure, and industrial automation, developing innovative technologies such as high-current connectors, concentric designs, and modular assemblies. Its global operations support diverse markets with scalable manufacturing and next-generation interconnect solutions for modern applications.
-
2025 – Amphenol launched DuraSwap concentric connectors and Type 6 charging gun solutions in India, advancing EV infrastructure and industrial connector technology.
-
2024 – Amphenol expanded the SurLok Plus® connector series for high-current EV battery and energy storage applications, improving amperage and reliability.
-
2023 – Amphenol Industrial Operations opened a new solar product factory, increasing production of solar junction boxes, connectors, and interconnect assemblies.
TE Connectivity Ltd.
TE Connectivity develops advanced connector systems, sensors, and electronic components for automotive, industrial, and data center applications. The company focuses on high-speed, high-density interconnect solutions that enable AI, HPC, and automated manufacturing systems. TE emphasizes sustainable, durable, and scalable designs for modern mobility, electrification, and digital infrastructure. Its innovations include modular connectors, optical/copper solutions, and automated assembly processes, driving efficiency, data-driven workflows, and reliable connectivity across diverse sectors worldwide.
-
2025 – TE showcased automated manufacturing for cable harnesses at Productronica 2025, demonstrating data-driven assembly of next-generation connector systems.
-
2025 – TE highlighted high-density interconnect solutions for AI and HPC data centers at OCP Global Summit 2025.
-
2024 – TE launched MCON 1.2 NextGen connector series, enhancing durability, reducing carbon footprint, and supporting automotive signal and power applications.
Key Players
Some of the Connector Market Companies
-
TE Connectivity Ltd.
-
Amphenol CorporationMolex LLC (Koch Industries)
-
Aptiv PLC
-
Hirose Electric Co., Ltd.
-
Japan Aviation Electronics Industry, Ltd. (JAE)
-
Samtec Inc.
-
Foxconn
-
JST Mfg. Co., Ltd.
-
Phoenix Contact GmbH & Co. KG
-
3M Company
-
Bel Fuse Inc.
-
LUXSHARE Precision Industry Co., Ltd.
-
Rosenberger Hochfrequenztechnik GmbH & Co. KG
-
Harting Technology Group
-
Radiall SA
-
Weidmüller Interface GmbH & Co. KG
-
ITT Inc.
-
Degson Electronics Co., Ltd
| Report Attributes | Details |
|---|---|
| Market Size in 2025 | USD 94.05 Billion |
| Market Size by 2035 | USD 182.43 Billion |
| CAGR | CAGR of 6.85% From 2026 to 2035 |
| Base Year | 2025 |
| Forecast Period | 2026-2035 |
| Historical Data | 2022-2024 |
| Report Scope & Coverage | Market Size, Segments Analysis, Competitive Landscape, Regional Analysis, DROC & SWOT Analysis, Forecast Outlook |
| Key Segments | • By Product (PCB Connectors, IO Connectors, Circular Connectors, Fiber Optic Connectors, RF Coaxial Connectors and Others) • By Signal Type (Power, Data and Hybrid) • By Technology (Wired Connectors, Wireless Connectors and Optical Connectors) • By End-User (Telecom, Transportation, Automotive, Industrial, Computer & Peripherals and Others) |
| Regional Analysis/Coverage | North America (US, Canada, Mexico), Europe (Germany, France, UK, Italy, Spain, Poland, Turkey, Rest of Europe), Asia Pacific (China, India, Japan, South Korea, Singapore, Australia,Taiwan, Rest of Asia Pacific), Middle East & Africa (UAE, Saudi Arabia, Qatar, South Africa, Rest of Middle East & Africa), Latin America (Brazil, Argentina, Rest of Latin America) |
| Company Profiles | TE Connectivity Ltd., Amphenol Corporation, Molex LLC (Koch Industries), Aptiv PLC, Hirose Electric Co., Ltd., Japan Aviation Electronics Industry, Ltd. (JAE), Samtec Inc., Foxconn, Yazaki Corporation, JST Mfg. Co., Ltd., Phoenix Contact GmbH & Co. KG, 3M Company, Bel Fuse Inc., LUXSHARE Precision Industry Co., Ltd., Rosenberger Hochfrequenztechnik GmbH & Co. KG, Harting Technology Group, Radiall SA, Weidmüller Interface GmbH & Co. KG, ITT Inc. and Degson Electronics Co., Ltd. |
Get in Touch
