Tracing Paper Market report scope & overview:
Get More Information on Tracing Paper Market - Request Sample Report
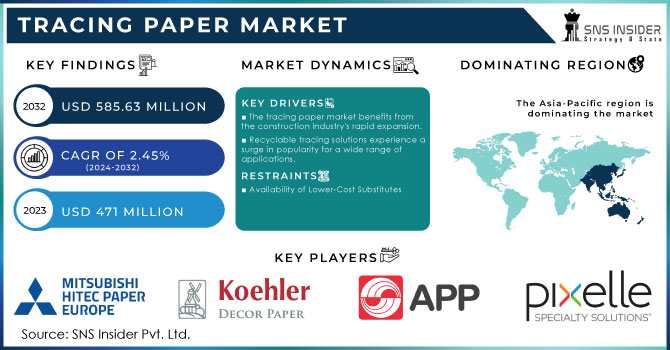
Tracing Paper Market Size was valued at USD 471 million in 2023 and is expected to reach USD 585.63 million by 2032 and grow at a CAGR of 2.45% over the forecast period 2024-2032
The tracing paper market looks bright with applications extending beyond its traditional use in architecture and engineering. The key driver is its low opacity, allowing for easy image tracing across various industries, with the textile sector in India opportunity as tracing paper facilitates pattern transfer onto fabrics.
Moreover, its smooth surface and non-toxic nature make it appealing to a wider range of end-users, contributing to a potential reduction in the global carbon footprint. The growing demand for moisture-resistant and recyclable options is another positive factor. This aligns with the rising interest in sustainable materials, as seen in the collaboration between Dezeen and Knauf on architectural presentations focused on digital reconstruction and sustainable materials.
Beyond these trends, the surging need for interior design solutions and a booming construction & architecture sector employing 7,706 individuals in the US with nearly 5,701 production and non-supervisory workers is expected to further propel the market for tracing paper and related solutions like carbonless paper. This growth is likely to be further fueled by the increasing interest in arts and crafts. This focus on eco-friendly solutions, coupled with the positive outlook for the construction industry, positions the tracing paper market for significant growth in the coming years.
MARKET DYNAMICS:
KEY DRIVERS:
The tracing paper market benefits from the construction industry's rapid expansion.
Tracing paper's strength lies in its unique blend of functionalities such as smooth texture, tear resistance, transparency, and moisture absorption. It's useful for architects, engineer’s drawings, blueprints, and even photographers and filmmakers. The construction boom, with more building and remodelling projects, further fuels the tracing paper market's growth.
Recyclable tracing solutions experience a surge in popularity for a wide range of applications.
RESTRAINTS:
Availability of Lower-Cost Substitutes
The tracing paper market faces competition from several lower-cost alternatives that offer varying degrees of transparency and functionality. These include transparent plastic film, often made from materials like polyester (Mylar) which can be more durable and water-resistant than tracing paper, and translucent vellum paper, a higher quality paper product made from calfskin or cotton linters that provides a smoother surface and better archival quality than standard tracing paper, but at a lower cost point than some cellulose fiber-based tracing papers.
OPPORTUNITIES:
A key strategy for many businesses is to drive growth through product innovation and diversification.
Tracing paper manufacturers can ignite market growth by strategically investing in product diversification and innovation. This could involve developing tracing paper with enhanced transparency, improved compatibility with various media, and increased durability. By addressing evolving industry needs, manufacturers can attract new customer segments and solidify their position in the market.
The growing adoption of coding in technical drawing, which streamlines workflows, is expected to significantly contribute to market expansion.
CHALLENGES:
The emergence of digital alternatives presents a challenge to the tracing paper market.
The rise of digital tracing pads and software presents a significant challenge to traditional tracing paper. Offering functionalities like easy editing, storage, and sharing, these digital solutions serve as a compelling alternative for designers, architects, and artists, potentially hindering the market growth of tracing paper.
IMPACT OF RUSSIA-UKRAINE WAR
The war in Ukraine has disrupted the already strained supply chain for the pulp and paper industry, impacting the tracing paper market indirectly. The conflict has caused shortages of various paper grades due to the critical role that Ukraine and Russia played in exporting timber over €12 billion annually. European mills are cut off from these resources, and some even have production facilities in the affected areas. Ukraine itself relied on European imports for paper and board, and this trade is likely to be suspended for the foreseeable future. Russia, a major importer from the EU, will also face a halt in its paper supply. While European mills may realign production to meet the needs of former Russian customers, the overall industry is grappling with rising energy prices and wood supply limitations due to the war's impact on these key resources. This disruption in the broader paper industry will likely flow through to the tracing paper market, potentially causing supply chain issues and price fluctuations.
IMPACT OF ECONOMIC SLOWDOWN
A recession caused by economic slowdowns and rising interest rates could reduce demand in the tracing paper market. To make their budgets go further, consumers and businesses would likely cut back on non-essential spending, including things like tracing paper used in construction, design, and other areas that aren't critical. Additionally, rising interest rates could increase production costs for tracing paper manufacturers, potentially leading to price hikes that further stifle demand. This scenario could be exacerbated by financial market stress, creating uncertainty and further discouraging spending on non-essential goods. Overall, a recession could lead to a decline in sales for the tracing paper market.
KEY MARKET SEGMENTS:
By Thickness
Up to 60 GSM
61 to 80 GSM
81 to 100 GSM
Above 100 GSM
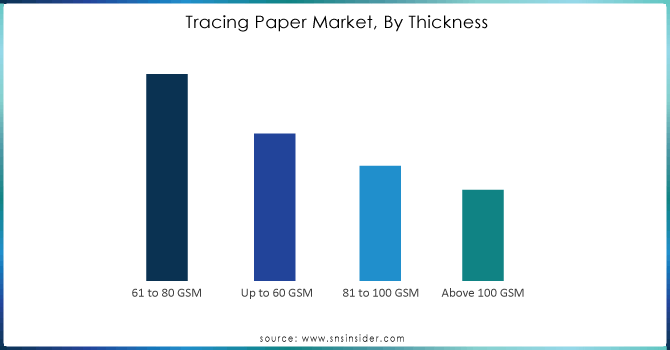
The tracing paper market is driven by thickness variations, with the 61 to 80 GSM segment leading the market at 57%. This mid-weight range is ideal for printing and reproduction tasks due to its compatibility with various printing methods while maintaining clear and high-quality printed content.
Need any customization research on Tracing Paper Market - Enquiry Now
By Material
Cellulose Fiber
Cotton Fiber
Recycled Fiber
Cellulose fiber holds dominant position with 56% market share in the tracing paper market due to its eco-friendly nature. Unlike plastic packaging, cellulose fibers biodegrade into natural substances, reducing waste and enriching soil with nutrients. Plus, their lighter weight compared to traditional materials lowers the carbon footprint during transportation and distribution.
By Application
Printing
Drawing
Photographic & Cinema Lighting
Embossing
Lamination
Others
Photographic and cinema lighting segment dominating with 58% market share. Tracing paper plays a crucial role in these industries as a light diffuser. Photographers and cinematographers use it to soften light sources, which is essential for various applications like portrait photography, product shoots, and specific lighting setups in films. This strategic use of tracing paper allows for greater control and versatility in achieving desired lighting effects.
REGIONAL ANALYSIS
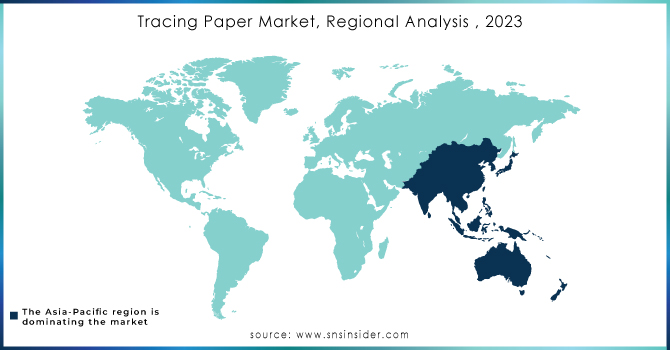
The Asia-Pacific region dominating in the global tracing paper market, holding a commanding 38% market share. This dominance can be attributed to the region's phenomenal growth in urbanization and infrastructure development, creating a constant demand for architects, engineers, and designers. India's booming textile industry is expected to fuel a $16.7 million opportunity for the tracing paper market. Tracing paper is used for pattern transfer onto fabrics, creating a demand boost alongside the textile sector's growth. China's relentless infrastructure development fuels the need for tracing paper. From high-speed rail networks to colossal bridges, these projects require intricate planning and blueprints, making tracing paper an indispensable tool.
Germany solidifies its dominance as the European tracing paper leader on the back of its thriving construction industry. Europe's construction sector, according to Euro Construct, saw a strong rebound in 2021, nearly reaching pre-pandemic levels in Germany. This positive trend is expected to continue, with growth projected across building & construction, civil engineering, and renovation activities. This translates to a promising outlook for Germany's tracing paper market, as these sectors rely heavily on tracing paper for architectural plans, blueprints, and technical drawings.
REGIONAL COVERAGE:
North America
US
Canada
Mexico
Europe
Eastern Europe
Poland
Romania
Hungary
Turkey
Rest of Eastern Europe
Western Europe
Germany
France
UK
Italy
Spain
Netherlands
Switzerland
Austria
Rest of Western Europe
Asia Pacific
China
India
Japan
South Korea
Vietnam
Singapore
Australia
Rest of Asia Pacific
Middle East & Africa
Middle East
UAE
Egypt
Saudi Arabia
Qatar
Rest of Middle East
Africa
Nigeria
South Africa
Rest of Africa
Latin America
Brazil
Argentina
Colombia
Rest of Latin America
KEY PLAYERS
The major key players are Domtar Corporation, Asia Pulp & Paper Ltd., Koehler Paper Group, Mitsubishi HiTec Paper Europe GmbH, Oji Papéis Especiais LTDA, Pixelle Specialty Solutions, Nippon Paper Industries Co. Ltd., Peters Papers, Papeles y Conversiones de México, Thermal Solutions International Inc., Reflex GmbH & Co. KG, Nekoosa Coated Products LLC, FILA-ARCHES sas and other players.
RECENT DEVELOPMENT
Responding to a surge in customer demand, Domtar Corporation announced the reactivation of its Ashdown, Arkansas paper machine in July 2021.
Pixelle Specialty Solutions made a strategic move in April 2021 to strengthen its product portfolio. They acquired Rollsource, a company from Veritiv Corporation, and the security papers & carbonless rolls business from Appvion Operations Inc. This acquisition is expected to significantly expand Pixelle's product offerings.
Report Attributes | Details |
---|---|
Market Size in 2023 | US$ 471 Mn |
Market Size by 2032 | US$ 585.63 Mn |
CAGR | CAGR of 2.45% From 2024 to 2032 |
Base Year | 2023 |
Forecast Period | 2024-2032 |
Historical Data | 2020-2022 |
Report Scope & Coverage | Market Size, Segments Analysis, Competitive Landscape, Regional Analysis, DROC & SWOT Analysis, Forecast Outlook |
Key Segments | • By Thickness (Up To 60 GSM, 61 To 80 GSM, 81 To 100 GSM, Above 100 GSM) • By Material (Cellulose Fiber, Cotton Fiber, Recycled Fiber) • By Application (Printing, Drawing, Photographic & Cinema Lighting, Embossing, Lamination, Others) |
Regional Analysis/Coverage | North America (US, Canada, Mexico), Europe (Eastern Europe [Poland, Romania, Hungary, Turkey, Rest of Eastern Europe] Western Europe] Germany, France, UK, Italy, Spain, Netherlands, Switzerland, Austria, Rest of Western Europe]), Asia Pacific (China, India, Japan, South Korea, Vietnam, Singapore, Australia, Rest of Asia Pacific), Middle East & Africa (Middle East [UAE, Egypt, Saudi Arabia, Qatar, Rest of Middle East], Africa [Nigeria, South Africa, Rest of Africa], Latin America (Brazil, Argentina, Colombia Rest of Latin America) |
Company Profiles | Domtar Corporation, Asia Pulp & Paper Ltd., Koehler Paper Group, Mitsubishi HiTec Paper Europe GmbH, Oji Papéis Especiais LTDA, Pixelle Specialty Solutions, Nippon Paper Industries Co. Ltd., Peters Papers, Papeles y Conversiones de México, Thermal Solutions International Inc., Reflex GmbH & Co. KG, Nekoosa Coated Products LLC, FILA-ARCHES sas |
Key Drivers | • The tracing paper market benefits from the construction industry's rapid expansion. • Recyclable tracing solutions experience a surge in popularity for a wide range of applications. |
Key Restraints | • Availability of Lower-Cost Substitutes |
Ans: The Tracing Paper Market is expected to grow at a CAGR of 2.45%.
Ans: Asia-Pacific holds the dominant position with the market share of 38
Ans: Availability of Lower-Cost Substitutes
Ans: The tracing paper market benefits from the construction industry's rapid expansion.
Ans: Tracing Paper Market size was USD 471 million in 2023 and is expected to Reach USD 571.63 million by 2031.
TABLE OF CONTENTS
1. Introduction
1.1 Market Definition
1.2 Scope
1.3 Research Assumptions
2. Industry Flowchart
3. Research Methodology
4. Market Dynamics
4.1 Drivers
4.2 Restraints
4.3 Opportunities
4.4 Challenges
5. Impact Analysis
5.1 Impact of Russia-Ukraine Crisis
5.2 Impact of Economic Slowdown on Major Countries
5.2.1 Introduction
5.2.2 United States
5.2.3 Canada
5.2.4 Germany
5.2.5 France
5.2.6 UK
5.2.7 China
5.2.8 Japan
5.2.9 South Korea
5.2.10 India
6. Value Chain Analysis
7. Porter’s 5 Forces Model
8. Pest Analysis
9. Tracing Paper Market Segmentation, By Thickness
9.1 Introduction
9.2 Trend Analysis
9.3 Up to 60 GSM
9.4 61 to 80 GSM
9.5 81 to 100 GSM
9.6 Above 100 GSM
10. Tracing Paper Market Segmentation, By Material
10.1 Introduction
10.2 Trend Analysis
10.3 Cellulose Fiber
10.4 Cotton Fiber
10.5 Recycled Fiber
11. Tracing Paper Market Segmentation, By Application
11.1 Introduction
11.2 Trend Analysis
11.3 Printing
11.4 Drawing
11.5 Photographic & Cinema Lighting
11.6 Embossing
11.7 Lamination
11.8 Others
12. Regional Analysis
12.1 Introduction
12.2 North America
12.2.1 Trend Analysis
12.2.2 North America Tracing Paper Market by Country
12.2.3 North America Tracing Paper Market By Thickness
12.2.4 North America Tracing Paper Market By Material
12.2.5 North America Tracing Paper Market By Application
12.2.6 USA
12.2.6.1 USA Tracing Paper Market By Thickness
12.2.6.2 USA Tracing Paper Market By Material
12.2.6.3 USA Tracing Paper Market By Application
12.2.7 Canada
12.2.7.1 Canada Tracing Paper Market By Thickness
12.2.7.2 Canada Tracing Paper Market By Material
12.2.7.3 Canada Tracing Paper Market By Application
12.2.8 Mexico
12.2.8.1 Mexico Tracing Paper Market By Thickness
12.2.8.2 Mexico Tracing Paper Market By Material
12.2.8.3 Mexico Tracing Paper Market By Application
12.3 Europe
12.3.1 Trend Analysis
12.3.2 Eastern Europe
12.3.2.1 Eastern Europe Tracing Paper Market by Country
12.3.2.2 Eastern Europe Tracing Paper Market By Thickness
12.3.2.3 Eastern Europe Tracing Paper Market By Material
12.3.2.4 Eastern Europe Tracing Paper Market By Application
12.3.2.5 Poland
12.3.2.5.1 Poland Tracing Paper Market By Thickness
12.3.2.5.2 Poland Tracing Paper Market By Material
12.3.2.5.3 Poland Tracing Paper Market By Application
12.3.2.6 Romania
12.3.2.6.1 Romania Tracing Paper Market By Thickness
12.3.2.6.2 Romania Tracing Paper Market By Material
12.3.2.6.4 Romania Tracing Paper Market By Application
12.3.2.7 Hungary
12.3.2.7.1 Hungary Tracing Paper Market By Thickness
12.3.2.7.2 Hungary Tracing Paper Market By Material
12.3.2.7.3 Hungary Tracing Paper Market By Application
12.3.2.8 Turkey
12.3.2.8.1 Turkey Tracing Paper Market By Thickness
12.3.2.8.2 Turkey Tracing Paper Market By Material
12.3.2.8.3 Turkey Tracing Paper Market By Application
12.3.2.9 Rest of Eastern Europe
12.3.2.9.1 Rest of Eastern Europe Tracing Paper Market By Thickness
12.3.2.9.2 Rest of Eastern Europe Tracing Paper Market By Material
12.3.2.9.3 Rest of Eastern Europe Tracing Paper Market By Application
12.3.3 Western Europe
12.3.3.1 Western Europe Tracing Paper Market by Country
12.3.3.2 Western Europe Tracing Paper Market By Thickness
12.3.3.3 Western Europe Tracing Paper Market By Material
12.3.3.4 Western Europe Tracing Paper Market By Application
12.3.3.5 Germany
12.3.3.5.1 Germany Tracing Paper Market By Thickness
12.3.3.5.2 Germany Tracing Paper Market By Material
12.3.3.5.3 Germany Tracing Paper Market By Application
12.3.3.6 France
12.3.3.6.1 France Tracing Paper Market By Thickness
12.3.3.6.2 France Tracing Paper Market By Material
12.3.3.6.3 France Tracing Paper Market By Application
12.3.3.7 UK
12.3.3.7.1 UK Tracing Paper Market By Thickness
12.3.3.7.2 UK Tracing Paper Market By Material
12.3.3.7.3 UK Tracing Paper Market By Application
12.3.3.8 Italy
12.3.3.8.1 Italy Tracing Paper Market By Thickness
12.3.3.8.2 Italy Tracing Paper Market By Material
12.3.3.8.3 Italy Tracing Paper Market By Application
12.3.3.9 Spain
12.3.3.9.1 Spain Tracing Paper Market By Thickness
12.3.3.9.2 Spain Tracing Paper Market By Material
12.3.3.9.3 Spain Tracing Paper Market By Application
12.3.3.10 Netherlands
12.3.3.10.1 Netherlands Tracing Paper Market By Thickness
12.3.3.10.2 Netherlands Tracing Paper Market By Material
12.3.3.10.3 Netherlands Tracing Paper Market By Application
12.3.3.11 Switzerland
12.3.3.11.1 Switzerland Tracing Paper Market By Thickness
12.3.3.11.2 Switzerland Tracing Paper Market By Material
12.3.3.11.3 Switzerland Tracing Paper Market By Application
12.3.3.1.12 Austria
12.3.3.12.1 Austria Tracing Paper Market By Thickness
12.3.3.12.2 Austria Tracing Paper Market By Material
12.3.3.12.3 Austria Tracing Paper Market By Application
12.3.3.13 Rest of Western Europe
12.3.3.13.1 Rest of Western Europe Tracing Paper Market By Thickness
12.3.3.13.2 Rest of Western Europe Tracing Paper Market By Material
12.3.3.13.3 Rest of Western Europe Tracing Paper Market By Application
12.4 Asia-Pacific
12.4.1 Trend Analysis
12.4.2 Asia-Pacific Tracing Paper Market by Country
12.4.3 Asia-Pacific Tracing Paper Market By Thickness
12.4.4 Asia-Pacific Tracing Paper Market By Material
12.4.5 Asia-Pacific Tracing Paper Market By Application
12.4.6 China
12.4.6.1 China Tracing Paper Market By Thickness
12.4.6.2 China Tracing Paper Market By Material
12.4.6.3 China Tracing Paper Market By Application
12.4.7 India
12.4.7.1 India Tracing Paper Market By Thickness
12.4.7.2 India Tracing Paper Market By Material
12.4.7.3 India Tracing Paper Market By Application
12.4.8 Japan
12.4.8.1 Japan Tracing Paper Market By Thickness
12.4.8.2 Japan Tracing Paper Market By Material
12.4.8.3 Japan Tracing Paper Market By Application
12.4.9 South Korea
12.4.9.1 South Korea Tracing Paper Market By Thickness
12.4.9.2 South Korea Tracing Paper Market By Material
12.4.9.3 South Korea Tracing Paper Market By Application
12.4.10 Vietnam
12.4.10.1 Vietnam Tracing Paper Market By Thickness
12.4.10.2 Vietnam Tracing Paper Market By Material
12.4.10.3 Vietnam Tracing Paper Market By Application
12.4.11 Singapore
12.4.11.1 Singapore Tracing Paper Market By Thickness
12.4.11.2 Singapore Tracing Paper Market By Material
12.4.11.3 Singapore Tracing Paper Market By Application
12.4.12 Australia
12.4.12.1 Australia Tracing Paper Market By Thickness
12.4.12.2 Australia Tracing Paper Market By Material
12.4.12.3 Australia Tracing Paper Market By Application
12.4.13 Rest of Asia-Pacific
12.4.13.1 Rest of Asia-Pacific Tracing Paper Market By Thickness
12.4.13.2 Rest of Asia-Pacific Tracing Paper Market By Material
12.4.13.3 Rest of Asia-Pacific Tracing Paper Market By Application
12.5 Middle East & Africa
12.5.1 Trend Analysis
12.5.2 Middle East
12.5.2.1 Middle East Tracing Paper Market by Country
12.5.2.2 Middle East Tracing Paper Market By Thickness
12.5.2.3 Middle East Tracing Paper Market By Material
12.5.2.4 Middle East Tracing Paper Market By Application
12.5.2.5 UAE
12.5.2.5.1 UAE Tracing Paper Market By Thickness
12.5.2.5.2 UAE Tracing Paper Market By Material
12.5.2.5.3 UAE Tracing Paper Market By Application
12.5.2.6 Egypt
12.5.2.6.1 Egypt Tracing Paper Market By Thickness
12.5.2.6.2 Egypt Tracing Paper Market By Material
12.5.2.6.3 Egypt Tracing Paper Market By Application
12.5.2.7 Saudi Arabia
12.5.2.7.1 Saudi Arabia Tracing Paper Market By Thickness
12.5.2.7.2 Saudi Arabia Tracing Paper Market By Material
12.5.2.7.3 Saudi Arabia Tracing Paper Market By Application
12.5.2.8 Qatar
12.5.2.8.1 Qatar Tracing Paper Market By Thickness
12.5.2.8.2 Qatar Tracing Paper Market By Material
12.5.2.8.3 Qatar Tracing Paper Market By Application
12.5.2.9 Rest of Middle East
12.5.2.9.1 Rest of Middle East Tracing Paper Market By Thickness
12.5.2.9.2 Rest of Middle East Tracing Paper Market By Material
12.5.2.9.3 Rest of Middle East Tracing Paper Market By Application
12.5.3 Africa
12.5.3.1 Africa Tracing Paper Market by Country
12.5.3.2 Africa Tracing Paper Market By Thickness
12.5.3.3 Africa Tracing Paper Market By Material
12.5.3.4 Africa Tracing Paper Market By Application
12.5.3.5 Nigeria
12.5.3.5.1 Nigeria Tracing Paper Market By Thickness
12.5.3.5.2 Nigeria Tracing Paper Market By Material
12.5.3.5.3 Nigeria Tracing Paper Market By Application
12.5.3.6 South Africa
12.5.3.6.1 South Africa Tracing Paper Market By Thickness
12.5.3.6.2 South Africa Tracing Paper Market By Material
12.5.3.6.3 South Africa Tracing Paper Market By Application
12.5.3.7 Rest of Africa
12.5.3.7.1 Rest of Africa Tracing Paper Market By Thickness
12.5.3.7.2 Rest of Africa Tracing Paper Market By Material
12.5.3.7.3 Rest of Africa Tracing Paper Market By Application
12.6 Latin America
12.6.1 Trend Analysis
12.6.2 Latin America Tracing Paper Market by country
12.6.3 Latin America Tracing Paper Market By Thickness
12.6.4 Latin America Tracing Paper Market By Material
12.6.5 Latin America Tracing Paper Market By Application
12.6.6 Brazil
12.6.6.1 Brazil Tracing Paper Market By Thickness
12.6.6.2 Brazil Tracing Paper Market By Material
12.6.6.3 Brazil Tracing Paper Market By Application
12.6.7 Argentina
12.6.7.1 Argentina Tracing Paper Market By Thickness
12.6.7.2 Argentina Tracing Paper Market By Material
12.6.7.3 Argentina Tracing Paper Market By Application
12.6.8 Colombia
12.6.8.1 Colombia Tracing Paper Market By Thickness
12.6.8.2 Colombia Tracing Paper Market By Material
12.6.8.3 Colombia Tracing Paper Market By Application
12.6.9 Rest of Latin America
12.6.9.1 Rest of Latin America Tracing Paper Market By Thickness
12.6.9.2 Rest of Latin America Tracing Paper Market By Material
12.6.9.3 Rest of Latin America Tracing Paper Market By Application
13. Company Profiles
13.1 Domtar Corporation
13.1.1 Company Overview
13.1.2 Financial
13.1.3 Products/ Services Offered
13.1.4 SWOT Analysis
13.1.5 The SNS View
13.2 Asia Pulp & Paper Ltd.
13.2.1 Company Overview
13.2.2 Financial
13.2.3 Products/ Services Offered
13.2.4 SWOT Analysis
13.2.5 The SNS View
13.3 Koehler Paper Group
13.3.1 Company Overview
13.3.2 Financial
13.3.3 Products/ Services Offered
13.3.4 SWOT Analysis
13.3.5 The SNS View
13.4 Mitsubishi HiTec Paper Europe GmbH
13.4.1 Company Overview
13.4.2 Financial
13.4.3 Products/ Services Offered
13.4.4 SWOT Analysis
13.4.5 The SNS View
13.5 Oji Papéis Especiais LTDA
13.5.1 Company Overview
13.5.2 Financial
13.5.3 Products/ Services Offered
13.5.4 SWOT Analysis
13.5.5 The SNS View
13.6 Pixelle Specialty Solutions
13.6.1 Company Overview
13.6.2 Financial
13.6.3 Products/ Services Offered
13.6.4 SWOT Analysis
13.6.5 The SNS View
13.7 Nippon Paper Industries Co. Ltd.
13.7.1 Company Overview
13.7.2 Financial
13.7.3 Products/ Services Offered
13.7.4 SWOT Analysis
13.7.5 The SNS View
13.8 Peters Papers
13.8.1 Company Overview
13.8.2 Financial
13.8.3 Products/ Services Offered
13.8.4 SWOT Analysis
13.8.5 The SNS View
13.9 Papeles y Conversiones de México
13.9.1 Company Overview
13.9.2 Financial
13.9.3 Products/ Services Offered
13.9.4 SWOT Analysis
13.9.5 The SNS View
13.10 Thermal Solutions International Inc.
13.10.1 Company Overview
13.10.2 Financial
13.10.3 Products/ Services Offered
13.10.4 SWOT Analysis
13.10.5 The SNS View
13.11 Reflex GmbH & Co. KG
13.11.1 Company Overview
13.11.2 Financial
13.11.3 Products/ Services Offered
13.11.4 SWOT Analysis
13.11.5 The SNS View
13.12 Nekoosa Coated Products LLC
13.12.1 Company Overview
13.12.2 Financial
13.12.3 Products/ Services Offered
13.12.4 SWOT Analysis
13.12.5 The SNS View
13.13 FILA-ARCHES sas
13.13.1 Company Overview
13.13.2 Financial
13.13.3 Products/ Services Offered
13.13.4 SWOT Analysis
13.13.5 The SNS View
14. Competitive Landscape
14.1 Competitive Benchmarking
14.2 Market Share Analysis
14.3 Recent Developments
14.3.1 Industry News
14.3.2 Company News
14.3.3 Mergers & Acquisitions
15. Use Case and Best Practices
16. Conclusion
An accurate research report requires proper strategizing as well as implementation. There are multiple factors involved in the completion of good and accurate research report and selecting the best methodology to compete the research is the toughest part. Since the research reports we provide play a crucial role in any company’s decision-making process, therefore we at SNS Insider always believe that we should choose the best method which gives us results closer to reality. This allows us to reach at a stage wherein we can provide our clients best and accurate investment to output ratio.
Each report that we prepare takes a timeframe of 350-400 business hours for production. Starting from the selection of titles through a couple of in-depth brain storming session to the final QC process before uploading our titles on our website we dedicate around 350 working hours. The titles are selected based on their current market cap and the foreseen CAGR and growth.
The 5 steps process:
Step 1: Secondary Research:
Secondary Research or Desk Research is as the name suggests is a research process wherein, we collect data through the readily available information. In this process we use various paid and unpaid databases which our team has access to and gather data through the same. This includes examining of listed companies’ annual reports, Journals, SEC filling etc. Apart from this our team has access to various associations across the globe across different industries. Lastly, we have exchange relationships with various university as well as individual libraries.
Step 2: Primary Research
When we talk about primary research, it is a type of study in which the researchers collect relevant data samples directly, rather than relying on previously collected data. This type of research is focused on gaining content specific facts that can be sued to solve specific problems. Since the collected data is fresh and first hand therefore it makes the study more accurate and genuine.
We at SNS Insider have divided Primary Research into 2 parts.
Part 1 wherein we interview the KOLs of major players as well as the upcoming ones across various geographic regions. This allows us to have their view over the market scenario and acts as an important tool to come closer to the accurate market numbers. As many as 45 paid and unpaid primary interviews are taken from both the demand and supply side of the industry to make sure we land at an accurate judgement and analysis of the market.
This step involves the triangulation of data wherein our team analyses the interview transcripts, online survey responses and observation of on filed participants. The below mentioned chart should give a better understanding of the part 1 of the primary interview.
Part 2: In this part of primary research the data collected via secondary research and the part 1 of the primary research is validated with the interviews from individual consultants and subject matter experts.
Consultants are those set of people who have at least 12 years of experience and expertise within the industry whereas Subject Matter Experts are those with at least 15 years of experience behind their back within the same space. The data with the help of two main processes i.e., FGDs (Focused Group Discussions) and IDs (Individual Discussions). This gives us a 3rd party nonbiased primary view of the market scenario making it a more dependable one while collation of the data pointers.
Step 3: Data Bank Validation
Once all the information is collected via primary and secondary sources, we run that information for data validation. At our intelligence centre our research heads track a lot of information related to the market which includes the quarterly reports, the daily stock prices, and other relevant information. Our data bank server gets updated every fortnight and that is how the information which we collected using our primary and secondary information is revalidated in real time.
Step 4: QA/QC Process
After all the data collection and validation our team does a final level of quality check and quality assurance to get rid of any unwanted or undesired mistakes. This might include but not limited to getting rid of the any typos, duplication of numbers or missing of any important information. The people involved in this process include technical content writers, research heads and graphics people. Once this process is completed the title gets uploader on our platform for our clients to read it.
Step 5: Final QC/QA Process:
This is the last process and comes when the client has ordered the study. In this process a final QA/QC is done before the study is emailed to the client. Since we believe in giving our clients a good experience of our research studies, therefore, to make sure that we do not lack at our end in any way humanly possible we do a final round of quality check and then dispatch the study to the client.
The Edible Water Bottles Market Size was valued at USD 128.12 million in 2023 and is expected to reach USD 283.75 million by 2031 and grow at a CAGR of 10.45% over the forecast period 2024-2031
Packaging Material Market Size was valued at USD 1136 billion in 2023 and is expected to reach USD 1433.47 billion by 2031 and grow at a CAGR of 2.95% over the forecast period 2024-2031.
The Tamper-proof packaging Market is experiencing substantial growth on a global scale, driven by heightened consumer awareness regarding product safety, stringent regulations mandating tamper-evident features, and its expanding use across diverse industr
The Composite Packaging Market was USD 73.57 billion in 2023 and will reach USD 112.96 billion by 2032 reflecting a remarkable CAGR of 5.28% by 2024 to 2032
The Polyester Straps Market size was USD 1.55 billion in 2023 and is expected to Reach USD 2.04 billion by 2031 and grow at a CAGR of 3.5% over the forecast period of 2024-2031.
The market size of In-Mold Labels market was US $ 3.75 billion in 2023 and is set to reach US $5.54 billion by 2031, at a compound annual growth rate of 4.91 % over the forecast period between 2024 and 2031.
Hi! Click one of our member below to chat on Phone