Trade Finance Market Report Scope & Overview:

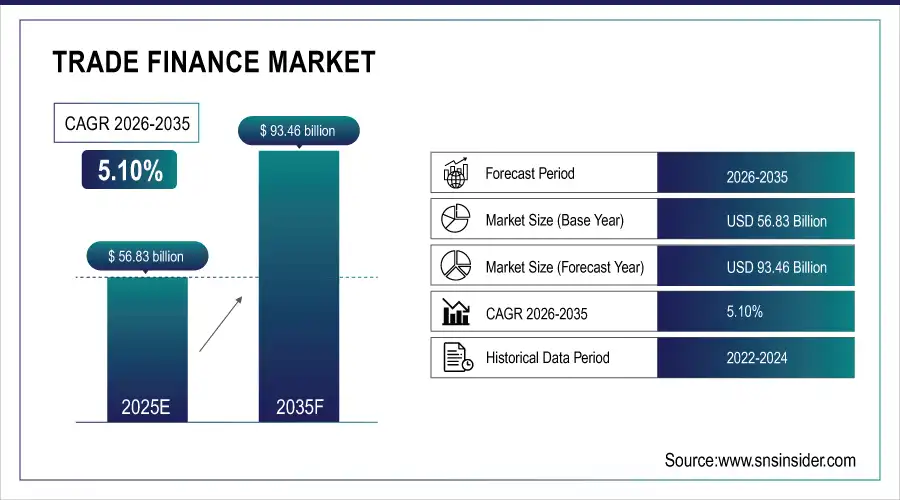
Trade Finance Market was valued at USD 51.43 billion in 2024 and is expected to reach USD 76.07 billion by 2032, growing at a CAGR of 5.10% from 2025-2032. 

The growth of the Trade Finance Market is driven by increasing globalization, which has expanded cross-border trade and heightened the need for secure financing mechanisms. Rising demand for supply chain financing among SMEs and large enterprises is enhancing market activity. The adoption of digital platforms, blockchain, and automation is streamlining operations, reducing documentation errors, and accelerating transaction speeds. According to the U.S. International Trade Administration, digitization is helping SMEs streamline trade finance by improving access to working capital, lowering costs, and accelerating processes. Additionally, financial institutions are developing tailored trade finance solutions to manage payment risks and optimize liquidity.

The U.S. Quadrennial Supply Chain Review (2025) further underscores investments in digital infrastructure, automation, and supply chain finance tools to enhance resilience against disruptions such as pandemics or trade shocks. The shift toward paperless trade and compliance with international trade regulations is further boosting efficiency, transparency, and trust, supporting the sustained growth of the trade finance ecosystem.

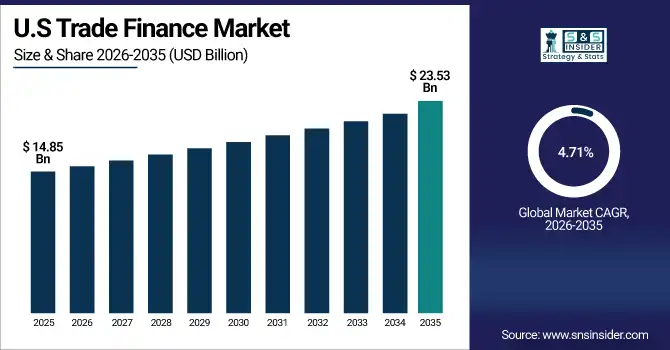
U.S. Trade Finance Market was valued at USD 13.44 billion in 2024 and is expected to reach USD 19,42 billion by 2032, growing at a CAGR of 4.71% from 2025-2032. 

The U.S. Trade Finance Market is growing due to increased international trade activity, rising adoption of digital financing platforms, greater demand for supply chain financing, and enhanced regulatory frameworks that promote transparency, risk mitigation, and efficiency in trade-related financial transactions.

Trade Finance Market Dynamics

Drivers

  • Digital transformation and automation are accelerating trade finance operations with improved efficiency, transparency, and faster transaction processing.

Growing adoption of blockchain, AI, and cloud platforms is revolutionizing trade finance by streamlining document handling and reducing manual errors. Automation enhances speed and accuracy while cutting operational costs. This digital shift is especially vital for global trade participants seeking real-time updates, end-to-end visibility, and secure transaction tracking. Technologies like smart contracts and e-invoicing are replacing paper-based systems, minimizing fraud and compliance risks. Financial institutions are increasingly investing in digital trade platforms to meet the evolving demands of cross-border commerce and facilitate seamless financing for exporters and importers across global markets.

  • The 2024 U.S.–EU Joint Statement outlines that increasing the use of digital technologies including e‑invoicing, AI, and cloud platforms simplifies trade for SMEs, reducing regulatory friction and overall trade-related costs.

Restraints

  • Complex regulatory compliance requirements across borders hinder trade finance accessibility and increase operational costs for stakeholders.

Trade finance is heavily regulated, involving strict anti-money laundering (AML), know-your-customer (KYC), and counter-terrorism financing (CTF) protocols that vary across jurisdictions. This complexity burdens financial institutions with significant administrative tasks, often resulting in delayed processing and limited service access for SMEs. Regulatory fragmentation increases legal uncertainty, deterring new market entrants and complicating international trade flows. Moreover, evolving global sanctions and compliance audits require constant system updates, training, and legal oversight. The lack of harmonized standards across nations adds cost and inefficiency, discouraging smaller institutions from actively participating in global trade finance networks.

Opportunities

  • Integration of fintech innovations in trade finance is transforming access, speed, and risk management for global stakeholders.

Fintech firms are modernizing trade finance through digital tools like blockchain, APIs, and AI-driven credit assessments, enhancing transparency and reducing fraud. These innovations simplify onboarding, automate document verification, and lower operational costs. Collaborative ecosystems between banks and fintechs are unlocking capital access for underserved businesses. Digital marketplaces and platforms offer real-time tracking, instant payment settlement, and streamlined compliance checks. As digital trade infrastructure scales, more exporters and importers particularly SMEs can access affordable financing solutions. This digital disruption positions fintech as a strategic partner in bridging global trade finance gaps and boosting financial efficiency.

  • Over 60% of banks worldwide have implemented or are in the process of adopting digital technologies to modernize trade finance operations, including fintech tools like APIs, blockchain, and AI-based verification though only 9% have so far realized measurable cost or time savings. Meanwhile, 65% have reduced the use of paper in documentation/advising and settlement; yet 52% still rely on paper for document verification.

Challenges

  • Cybersecurity threats and digital fraud risks present growing concerns as trade finance moves toward fully digital ecosystems.

The digitization of trade finance exposes financial institutions and businesses to sophisticated cyberattacks, phishing scams, and data breaches. Given the high transaction values and sensitive documentation involved, any breach can lead to significant financial and reputational losses. Hackers increasingly target trade systems, exploiting vulnerabilities in APIs, blockchain networks, or third-party platforms. Regulatory bodies are demanding tighter cybersecurity protocols, raising compliance costs. Maintaining digital trust requires continuous investment in cybersecurity tools, employee training, and multi-layered defenses. Ensuring data integrity, identity verification, and system resilience remains an ongoing challenge in digital trade finance transformation.

Trade Finance Market Segments
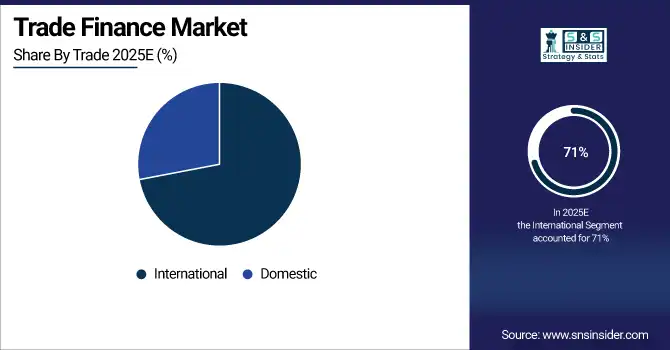
By Trade

The international segment dominated the Trade Finance Market with a 71% revenue share in 2024 due to the rising complexity and volume of cross-border transactions. Global trade expansion, demand for secure payment mechanisms, and involvement of multiple currencies, jurisdictions, and intermediaries contributed to the high reliance on international trade finance services. Banks and financial institutions prioritized these transactions to mitigate credit risk and ensure timely settlement of global commerce.

The domestic segment is expected to grow at the fastest CAGR of 6.66% from 2025 to 2032, driven by the surge in intra-country trade activities and growing participation of local SMEs in supply chains. Simplified regulatory requirements and increased digitization are making domestic trade finance more accessible. Governments and financial institutions are promoting localized credit facilities to stimulate internal economic growth and strengthen the resilience of national supply networks.

By Enterprise Size

Large enterprises dominated the Trade Finance Market in 2024 with a 64% revenue share due to their frequent involvement in high-value international transactions. These firms typically have stronger credit ratings, enabling easier access to structured finance products like letters of credit and export credit. Their global presence, robust compliance mechanisms, and established relationships with financial institutions further strengthen their ability to leverage trade finance tools efficiently.

SMEs are expected to grow at the fastest CAGR of 6.16% from 2025 to 2032, as fintech-driven innovations and government support programs improve access to trade finance. Increasing integration of SMEs into global supply chains and adoption of digital platforms are enabling quicker onboarding, credit assessment, and financing. These trends are closing the historic financing gap and empowering SMEs to expand their trade activities both domestically and internationally.

By Vertical

The construction segment led the Trade Finance Market in 2024 with a 20% revenue share owing to its capital-intensive nature and long project cycles. Projects often involve multiple contractors, imports of raw materials, and high-value cross-border transactions requiring structured financing solutions. Trade finance ensures timely procurement of supplies and effective cash flow management, which is critical for meeting deadlines and minimizing risks in large-scale infrastructure and development projects.

Shipping & logistics is projected to grow at the fastest CAGR of 7.87% from 2025 to 2032 due to the sector's increasing digitization and central role in global e-commerce. As global trade grows, logistics companies need flexible, real-time financing to manage complex delivery networks. Trade finance helps optimize working capital, streamline cross-border operations, and improve inventory cycles, making it a critical enabler for growth in the highly dynamic logistics environment.

By Instrument

The letter of credit segment dominated with a 36% revenue share in 2024 due to its wide use in mitigating non-payment risks in cross-border trade. It provides a secure payment mechanism between buyers and sellers who may lack a prior relationship, especially in high-risk markets. Banks guarantee the buyer’s payment upon compliance with documentary terms, making it a preferred tool for ensuring transaction trust and financial security in global trade.

Receivables financing/invoice discounting is expected to grow at the fastest CAGR of 7.97% from 2025 to 2032 due to its increasing use among SMEs seeking faster liquidity. By converting unpaid invoices into working capital, companies can maintain cash flow and avoid credit constraints. The rise of digital platforms that automate invoice processing and risk assessment has made this financing method more accessible, efficient, and attractive across various sectors and enterprise sizes.

By Service Provider

Banks held the largest revenue share of 52% in the Trade Finance Market in 2024, supported by their global networks, capital reserves, and regulatory experience. Their long-standing relationships with traders, ability to underwrite large transactions, and robust compliance frameworks make them the preferred providers of trade finance instruments such as letters of credit and bank guarantees. Their role in enabling cross-border trust further reinforces their dominance in the sector.

Financial institutions are projected to grow at the fastest CAGR of 7.11% from 2025 to 2032, driven by increased involvement of fintechs, trade finance platforms, and non-bank lenders. These entities offer faster, more flexible, and tech-enabled solutions that appeal to SMEs and underserved markets. As traditional banks face regulatory pressure and capacity limits, alternative financial institutions are stepping in to close funding gaps and deliver innovative trade finance products.

By End Use

Importers led the Trade Finance Market with a 48% revenue share in 2024, owing to their need to manage payment risk, currency exposure, and supplier relationships in international procurement. Importers rely on trade finance tools such as letters of credit and import loans to ensure timely goods delivery and to optimize working capital. Their dependency on overseas sourcing and complex logistics makes trade finance critical to operational efficiency.

Trade intermediaries are expected to grow at the fastest CAGR of 8.01% from 2025 to 2032, as they play a crucial role in facilitating global commerce for multiple parties. These intermediaries such as agents, brokers, and third-party logistics providers increasingly use trade finance to manage risk, secure inventory, and coordinate international transactions. Digitization and platform-based trade models are further enhancing their ability to access, utilize, and scale financing solutions effectively.

Trade Finance Market Regional Analysis
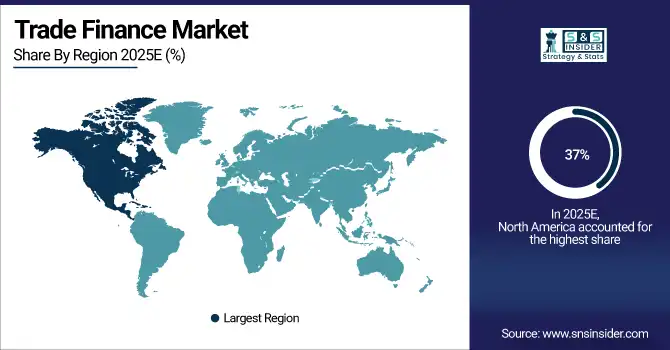
North America dominated the Trade Finance Market with a 37% revenue share in 2024 due to its well-established financial infrastructure, strong presence of multinational corporations, and advanced regulatory frameworks. The region’s mature banking sector supports high volumes of cross-border trade, especially between the U.S., Canada, and Mexico. Robust technological integration and widespread adoption of digital trade finance tools further reinforced North America's leadership in facilitating secure and efficient international transactions.

The United States is dominating the Trade Finance Market in North America due to its strong banking infrastructure and high volume of international trade activities.

Asia Pacific is expected to grow at the fastest CAGR of 6.87% from 2025 to 2032, driven by rapid economic development, export-led growth strategies, and expanding intra-regional trade. Countries like China, India, Vietnam, and Indonesia are witnessing a surge in manufacturing and global supply chain integration. Supportive government trade policies, infrastructure investments, and growing fintech ecosystems are also enhancing access to trade finance, especially for small and medium-sized enterprises in the region.

China is dominating the Trade Finance Market in Asia Pacific due to its massive export volume, manufacturing strength, and government-backed trade finance initiatives.

Europe holds a significant share in the Trade Finance Market due to its strong intra-regional trade, advanced banking systems, and export-driven economies like Germany and France. Harmonized regulatory frameworks and cross-border financial integration further enhance market efficiency and growth potential.

Germany is dominating the Trade Finance Market in Europe due to its strong export-oriented economy, advanced manufacturing sector, and robust trade finance infrastructure.

The Middle East & Africa region is witnessing growing trade finance demand due to infrastructure development and increased export activities, particularly in oil and minerals. Latin America is expanding steadily, supported by regional trade agreements, agricultural exports, and improving access to financial services.

Key Players

Trade Finance Market companies are Standard Chartered PLC, BNP Paribas, Citigroup Inc., TD Bank, UBS, Arab Bank, DBS Bank Ltd, JPMorgan Chase & Co., Santander Bank / Banco Santander S.A., Deutsche Bank AG, Bank of America Corporation, HSBC Holdings plc, Commerzbank AG, Morgan Stanley, Mitsubishi Corporation, ANZ Bank, Rabobank Group, SunTrust Bank Holding Company, UniCredit S.p.A, Wells Fargo & Company.

Recent Developments:

  • 2025: Standard Chartered PLC announced plans to issue an HKD‑backed stablecoin and join the Partior DLT network, advancing tokenisation and blockchain‑based enhancements to global trade finance

  • 2024: HSBC Holdings plc launched the rebranded “Global Trade Solutions (GTS)”, transforming its Global Trade and Receivables Finance business into a unified digital platform simplifying cross‑border corporate trade services

  • 2023: HSBC Holdings plc introduced HSBC TradePay, enabling instant, straight‑through trade loan drawdown and supplier payment, completing in under a minute and improving working capital efficiencies.

Trade Finance Market Report Scope:

Report Attributes Details
Market Size in 2024 USD 51.43 Billion 
Market Size by 2032 USD 76.07 Billion 
CAGR CAGR of 5.10% From 2025 to 2032
Base Year 2024
Forecast Period 2025-2032
Historical Data 2021-2023
Report Scope & Coverage Market Size, Segments Analysis, Competitive Landscape, Regional Analysis, DROC & SWOT Analysis, Forecast Outlook
Key Segments • By Instrument (Letter of Credit, Supply Chain Financing, Documentary Collections, Receivables Financing/Invoice Discounting, Others)
• By Service Provider (Banks, Financial Institutions, Trading Houses, Others)
• By Trade (Domestic, International)
• By Enterprise Size (Large Enterprises, SMEs)
• By Vertical (BFSI, Construction, Wholesale/Retail, Manufacturing, Automobile, Shipping & Logistics, Others)
• By End Use (Importer, Exporter, Trade Intermediaries)
Regional Analysis/Coverage North America (US, Canada), Europe (Germany, UK, France, Italy, Spain, Russia, Poland, Rest of Europe), Asia Pacific (China, India, Japan, South Korea, Australia, ASEAN Countries, Rest of Asia Pacific), Middle East & Africa (UAE, Saudi Arabia, Qatar, South Africa, Rest of Middle East & Africa), Latin America (Brazil, Argentina, Mexico, Colombia, Rest of Latin America).
Company Profiles Standard Chartered PLC, BNP Paribas, Citigroup Inc., TD Bank, UBS, Arab Bank, DBS Bank Ltd, JPMorgan Chase & Co., Santander Bank / Banco Santander S.A., Deutsche Bank AG, Bank of America Corporation, HSBC Holdings plc, Commerzbank AG, Morgan Stanley, Mitsubishi Corporation, ANZ Bank, Rabobank Group, SunTrust Bank Holding Company (now Truist Financial Corporation), UniCredit S.p.A, Wells Fargo & Company

Table Of Contents

1. Introduction

1.1 Market Definition & Scope

 1.2 Research Assumptions & Abbreviations

 1.3 Research Methodology

2. Executive Summary

2.1 Market Snapshot

 2.2 Market Absolute $ Opportunity Assessment & Y-o-Y Analysis, 2021–2032

 2.3 Market Size & Forecast, By Segmentation, 2021–2032

  2.3.1 Market Size By Instrument

  2.3.2 Market Size By Service Provider

  2.3.3 Market Size By Trade

  2.3.4 Market Size By Enterprise Size

  2.3.5 Market Size By Vertical

  2.3.6 Market Size By End Use

 2.4 Market Share & Bps Analysis By Region, 2024

 2.5 Industry Growth Scenarios – Conservative, Likely & Optimistic

 2.6 Industry CxO’s Perspective

3. Market Overview

3.1 Market Dynamics

  3.1.1 Drivers

  3.1.2 Restraints

  3.1.3 Opportunities

  3.1.4 Key Market Trends

 3.2 Industry PESTLE Analysis

 3.3 Key Industry Forces (Porter’s) Impacting Market Growth

 3.4 Industry Supply Chain Analysis

  3.4.1 Raw Material Suppliers

  3.4.2 Manufacturers

  3.4.3 Distributors/Suppliers

  3.4.4 Customers/End-Users

 3.5 Industry Life Cycle Assessment

 3.6 Parent Market Overview

 3.7 Market Risk Assessment

4. Statistical Insights & Trends Reporting

4.1 Technology & Digitalization

4.1.1 Digital Trade Finance Penetration Rate (%)

4.1.2 Blockchain-Based Trade Finance Adoption (%)

4.1.3 Number of Platforms Offering Digital Trade Finance Services

4.1.4 Percentage Reduction in Processing Time Due to Automation (%)

4.1.5 Share of Banks Using AI/RPA in Trade Finance Operations (%)

4.2 Financial Performance Metrics

4.2.1 Average Interest Rate Charged for Trade Finance Loans (%)

4.2.2 Non-Performing Loan (NPL) Ratio in Trade Finance (%)

4.2.3 Default Rate on Trade Finance Transactions (%)

4.2.4 Average Cost of Trade Finance per Transaction (USD)

4.2.5 Profit Margin from Trade Finance Products (Banks & FinTechs) (%)

4.3 User & Industry Insights

4.3.1 Share of Corporates Using Multibank Trade Finance Portals (%)

4.3.2 SME Access to Trade Finance (%)

4.3.3 Customer Satisfaction Rate for Trade Finance Services (%)

4.3.4 Number of New Trade Finance Customers Onboarded (YoY Growth)

4.3.5 Average Processing Time (in Days) for Trade Finance Approvals

4.4 Risk, Compliance & Regulation

4.4.1 Share of Trade Finance Transactions Screened for AML/KYC (%)

4.4.2 Cost of Compliance per Trade Finance Transaction (USD)

4.4.3 Number of Fraudulent Trade Finance Cases Reported (Annually)

4.4.4 Percentage of Trade Finance Denials Due to Risk Scoring (%)

4.4.5 Trade Finance Claims Settled vs. Filed (% Ratio)

5. Trade Finance Market Segmental Analysis & Forecast, By Instrument, 2021 – 2032, Value (USD Billion)

5.1 Introduction

 5.2 Letter of Credit

  5.2.1 Key Trends

  5.2.2 Market Size & Forecast, 2021 – 2032

 5.3 Supply Chain Financing

  5.3.1 Key Trends

  5.3.2 Market Size & Forecast, 2021 – 2032

 5.4 Documentary Collections

  5.4.1 Key Trends

  5.4.2 Market Size & Forecast, 2021 – 2032

 5.5 Receivables Financing/Invoice Discounting

  5.5.1 Key Trends

  5.5.2 Market Size & Forecast, 2021 – 2032

 5.6 Others

  5.6.1 Key Trends

  5.6.2 Market Size & Forecast, 2021 – 2032

6. Trade Finance Market Segmental Analysis & Forecast, By Service Provider, 2021 – 2032, Value (USD Billion)

    6.1 Introduction

 6.2 Banks

  6.2.1 Key Trends

  6.2.2 Market Size & Forecast, 2021 – 2032

 6.3 Financial Institutions

  6.3.1 Key Trends

  6.3.2 Market Size & Forecast, 2021 – 2032

 6.4 Trading Houses

  6.4.1 Key Trends

  6.4.2 Market Size & Forecast, 2021 – 2032

 6.5 Others

  6.5.1 Key Trends

  6.5.2 Market Size & Forecast, 2021 – 2032

7. Trade Finance Market Segmental Analysis & Forecast, By Trade, 2021 – 2032, Value (USD Billion)

    7.1 Introduction

 7.2 Domestic

  7.2.1 Key Trends

  7.2.2 Market Size & Forecast, 2021 – 2032

 7.3 International

  7.3.1 Key Trends

  7.3.2 Market Size & Forecast, 2021 – 2032

8. Trade Finance Market Segmental Analysis & Forecast, By Vertical, 2021 – 2032, Value (USD Billion)

    8.1 Introduction

 8.2 BFSI

  8.2.1 Key Trends

  8.2.2 Market Size & Forecast, 2021 – 2032

 8.3 Construction

  8.3.1 Key Trends

  8.3.2 Market Size & Forecast, 2021 – 2032

 8.4 Wholesale/Retail

  8.4.1 Key Trends

  8.4.2 Market Size & Forecast, 2021 – 2032

 8.5 Manufacturing

  8.5.1 Key Trends

  8.5.2 Market Size & Forecast, 2021 – 2032

 8.6 Automobile

  8.6.1 Key Trends

  8.6.2 Market Size & Forecast, 2021 – 2032

 8.7 Shipping & Logistics

  8.7.1 Key Trends

  8.7.2 Market Size & Forecast, 2021 – 2032

 8.8 Others

  8.8.1 Key Trends

  8.8.2 Market Size & Forecast, 2021 – 2032

9. Trade Finance Market Segmental Analysis & Forecast, By Enterprise Size, 2021 – 2032, Value (USD Billion)

    9.1 Introduction 

  9.2 Large Enterprises

   9.2.1 Key Trends 

   9.2.2 Market Size & Forecast, 2021 – 2032 

  9.3 SMEs

   9.3.1 Key Trends 

   9.3.2 Market Size & Forecast, 2021 – 2032

10. Trade Finance Market Segmental Analysis & Forecast, By End Use, 2021 – 2032, Value (USD Billion)

 10.1 Introduction

 10.2 Importer

  10.2.1 Key Trends

  10.2.2 Market Size & Forecast, 2021 – 2032

 10.3 Exporter

  10.3.1 Key Trends

  10.3.2 Market Size & Forecast, 2021 – 2032

 10.4 Trade Intermediaries

  10.4.1 Key Trends

  10.4.2 Market Size & Forecast, 2021 – 2032

11. Trade Finance Market Segmental Analysis & Forecast By Region, 2021 – 2032, Value (USD Billion)

 11.1 Introduction

 11.2 North America

  11.2.1 Key Trends

  11.2.2 Trade Finance Market Size & Forecast, By Instrument, 2021 – 2032

  11.2.3 Trade Finance Market Size & Forecast, By Service Provider, 2021 – 2032

  11.2.4 Trade Finance Market Size & Forecast, By Trade, 2021 – 2032

  11.2.5 Trade Finance Market Size & Forecast, By Vertical, 2021 – 2032

  11.2.6 Trade Finance Market Size & Forecast, By Enterprise Size, 2021 – 2032

  11.2.7 Trade Finance Market Size & Forecast, By End Use, 2021 – 2032

  11.2.8 Trade Finance Market Size & Forecast, By Country, 2021 – 2032

   11.2.8.1 USA

    11.2.8.1.1 Trade Finance Market Size & Forecast, By Instrument, 2021 – 2032

    11.2.8.1.2 Trade Finance Market Size & Forecast, By Service Provider, 2021 – 2032

    11.2.8.1.3 Trade Finance Market Size & Forecast, By Trade, 2021 – 2032

    11.2.8.1.4 Trade Finance Market Size & Forecast, By Vertical, 2021 – 2032

    11.2.8.1.5 Trade Finance Market Size & Forecast, By Enterprise Size, 2021 – 2032

    11.2.8.1.6 Trade Finance Market Size & Forecast, By End Use, 2021 – 2032

   11.2.8.2 Canada

    11.2.8.2.1 Trade Finance Market Size & Forecast, By Instrument, 2021 – 2032

    11.2.8.2.2 Trade Finance Market Size & Forecast, By Service Provider, 2021 – 2032

    11.2.8.2.3 Trade Finance Market Size & Forecast, By Trade, 2021 – 2032

    11.2.8.2.4 Trade Finance Market Size & Forecast, By Vertical, 2021 – 2032

    11.2.8.2.5 Trade Finance Market Size & Forecast, By Enterprise Size, 2021 – 2032

    11.2.8.2.6 Trade Finance Market Size & Forecast, By End Use, 2021 – 2032

11.3 Europe

 11.3.1 Key Trends

 11.3.2 Trade Finance Market Size & Forecast, By Instrument, 2021 – 2032

 11.3.3 Trade Finance Market Size & Forecast, By Service Provider, 2021 – 2032

 11.3.4 Trade Finance Market Size & Forecast, By Trade, 2021 – 2032

 11.3.5 Trade Finance Market Size & Forecast, By Vertical, 2021 – 2032

 11.3.6 Trade Finance Market Size & Forecast, By Enterprise Size, 2021 – 2032

 11.3.7 Trade Finance Market Size & Forecast, By End Use, 2021 – 2032

 11.3.8 Trade Finance Market Size & Forecast, By Country, 2021 – 2032

  11.3.8.1 Germany

   11.3.8.1.1 Trade Finance Market Size & Forecast, By Instrument, 2021 – 2032

   11.3.8.1.2 Trade Finance Market Size & Forecast, By Service Provider, 2021 – 2032

   11.3.8.1.3 Trade Finance Market Size & Forecast, By Trade, 2021 – 2032

   11.3.8.1.4 Trade Finance Market Size & Forecast, By Vertical, 2021 – 2032

   11.3.8.1.5 Trade Finance Market Size & Forecast, By Enterprise Size, 2021 – 2032

   11.3.8.1.6 Trade Finance Market Size & Forecast, By End Use, 2021 – 2032

  11.3.8.2 UK

   11.3.8.2.1 Trade Finance Market Size & Forecast, By Instrument, 2021 – 2032

   11.3.8.2.2 Trade Finance Market Size & Forecast, By Service Provider, 2021 – 2032

   11.3.8.2.3 Trade Finance Market Size & Forecast, By Trade, 2021 – 2032

   11.3.8.2.4 Trade Finance Market Size & Forecast, By Vertical, 2021 – 2032

   11.3.8.2.5 Trade Finance Market Size & Forecast, By Enterprise Size, 2021 – 2032

   11.3.8.2.6 Trade Finance Market Size & Forecast, By End Use, 2021 – 2032

  11.3.8.3 France

   11.3.8.3.1 Trade Finance Market Size & Forecast, By Instrument, 2021 – 2032

   11.3.8.3.2 Trade Finance Market Size & Forecast, By Service Provider, 2021 – 2032

   11.3.8.3.3 Trade Finance Market Size & Forecast, By Trade, 2021 – 2032

   11.3.8.3.4 Trade Finance Market Size & Forecast, By Vertical, 2021 – 2032

   11.3.8.3.5 Trade Finance Market Size & Forecast, By Enterprise Size, 2021 – 2032

   11.3.8.3.6 Trade Finance Market Size & Forecast, By End Use, 2021 – 2032

  11.3.8.4 Italy

   11.3.8.4.1 Trade Finance Market Size & Forecast, By Instrument, 2021 – 2032

   11.3.8.4.2 Trade Finance Market Size & Forecast, By Service Provider, 2021 – 2032

   11.3.8.4.3 Trade Finance Market Size & Forecast, By Trade, 2021 – 2032

   11.3.8.4.4 Trade Finance Market Size & Forecast, By Vertical, 2021 – 2032

   11.3.8.4.5 Trade Finance Market Size & Forecast, By Enterprise Size, 2021 – 2032

   11.3.8.4.6 Trade Finance Market Size & Forecast, By End Use, 2021 – 2032

  11.3.8.5 Spain

   11.3.8.5.1 Trade Finance Market Size & Forecast, By Instrument, 2021 – 2032

   11.3.8.5.2 Trade Finance Market Size & Forecast, By Service Provider, 2021 – 2032

   11.3.8.5.3 Trade Finance Market Size & Forecast, By Trade, 2021 – 2032

   11.3.8.5.4 Trade Finance Market Size & Forecast, By Vertical, 2021 – 2032

   11.3.8.5.5 Trade Finance Market Size & Forecast, By Enterprise Size, 2021 – 2032

   11.3.8.5.6 Trade Finance Market Size & Forecast, By End Use, 2021 – 2032

  11.3.8.6 Russia

   11.3.8.6.1 Trade Finance Market Size & Forecast, By Instrument, 2021 – 2032

   11.3.8.6.2 Trade Finance Market Size & Forecast, By Service Provider, 2021 – 2032

   11.3.8.6.3 Trade Finance Market Size & Forecast, By Trade, 2021 – 2032

   11.3.8.6.4 Trade Finance Market Size & Forecast, By Vertical, 2021 – 2032

   11.3.8.6.5 Trade Finance Market Size & Forecast, By Enterprise Size, 2021 – 2032

   11.3.8.6.6 Trade Finance Market Size & Forecast, By End Use, 2021 – 2032

  11.3.8.7 Poland

   11.3.8.7.1 Trade Finance Market Size & Forecast, By Instrument, 2021 – 2032

   11.3.8.7.2 Trade Finance Market Size & Forecast, By Service Provider, 2021 – 2032

   11.3.8.7.3 Trade Finance Market Size & Forecast, By Trade, 2021 – 2032

   11.3.8.7.4 Trade Finance Market Size & Forecast, By Vertical, 2021 – 2032

   11.3.8.7.5 Trade Finance Market Size & Forecast, By Enterprise Size, 2021 – 2032

   11.3.8.7.6 Trade Finance Market Size & Forecast, By End Use, 2021 – 2032

  11.3.8.8 Rest of Europe

   11.3.8.8.1 Trade Finance Market Size & Forecast, By Instrument, 2021 – 2032

   11.3.8.8.2 Trade Finance Market Size & Forecast, By Service Provider, 2021 – 2032

   11.3.8.8.3 Trade Finance Market Size & Forecast, By Trade, 2021 – 2032

   11.3.8.8.4 Trade Finance Market Size & Forecast, By Vertical, 2021 – 2032

   11.3.8.8.5 Trade Finance Market Size & Forecast, By Enterprise Size, 2021 – 2032

   11.3.8.8.6 Trade Finance Market Size & Forecast, By End Use, 2021 – 2032

11.4 Asia-Pacific

 11.4.1 Key Trends

 11.4.2 Trade Finance Market Size & Forecast, By Instrument, 2021 – 2032

 11.4.3 Trade Finance Market Size & Forecast, By Service Provider, 2021 – 2032

 11.4.4 Trade Finance Market Size & Forecast, By Trade, 2021 – 2032

 11.4.5 Trade Finance Market Size & Forecast, By Vertical, 2021 – 2032

 11.4.6 Trade Finance Market Size & Forecast, By Enterprise Size, 2021 – 2032

 11.4.7 Trade Finance Market Size & Forecast, By End Use, 2021 – 2032

 11.4.8 Trade Finance Market Size & Forecast, By Country, 2021 – 2032

  11.4.8.1 China

   11.4.8.1.1 Trade Finance Market Size & Forecast, By Instrument, 2021 – 2032

   11.4.8.1.2 Trade Finance Market Size & Forecast, By Service Provider, 2021 – 2032

   11.4.8.1.3 Trade Finance Market Size & Forecast, By Trade, 2021 – 2032

   11.4.8.1.4 Trade Finance Market Size & Forecast, By Vertical, 2021 – 2032

   11.4.8.1.5 Trade Finance Market Size & Forecast, By Enterprise Size, 2021 – 2032

   11.4.8.1.6 Trade Finance Market Size & Forecast, By End Use, 2021 – 2032

  11.4.8.2 India

   11.4.8.2.1 Trade Finance Market Size & Forecast, By Instrument, 2021 – 2032

   11.4.8.2.2 Trade Finance Market Size & Forecast, By Service Provider, 2021 – 2032

   11.4.8.2.3 Trade Finance Market Size & Forecast, By Trade, 2021 – 2032

   11.4.8.2.4 Trade Finance Market Size & Forecast, By Vertical, 2021 – 2032

   11.4.8.2.5 Trade Finance Market Size & Forecast, By Enterprise Size, 2021 – 2032

   11.4.8.2.6 Trade Finance Market Size & Forecast, By End Use, 2021 – 2032

  11.4.8.3 Japan

   11.4.8.3.1 Trade Finance Market Size & Forecast, By Instrument, 2021 – 2032

   11.4.8.3.2 Trade Finance Market Size & Forecast, By Service Provider, 2021 – 2032

   11.4.8.3.3 Trade Finance Market Size & Forecast, By Trade, 2021 – 2032

   11.4.8.3.4 Trade Finance Market Size & Forecast, By Vertical, 2021 – 2032

   11.4.8.3.5 Trade Finance Market Size & Forecast, By Enterprise Size, 2021 – 2032

   11.4.8.3.6 Trade Finance Market Size & Forecast, By End Use, 2021 – 2032

  11.4.8.4 South Korea

   11.4.8.4.1 Trade Finance Market Size & Forecast, By Instrument, 2021 – 2032

   11.4.8.4.2 Trade Finance Market Size & Forecast, By Service Provider, 2021 – 2032

   11.4.8.4.3 Trade Finance Market Size & Forecast, By Trade, 2021 – 2032

   11.4.8.4.4 Trade Finance Market Size & Forecast, By Vertical, 2021 – 2032

   11.4.8.4.5 Trade Finance Market Size & Forecast, By Enterprise Size, 2021 – 2032

   11.4.8.4.6 Trade Finance Market Size & Forecast, By End Use, 2021 – 2032

  11.4.8.5 Australia

   11.4.8.5.1 Trade Finance Market Size & Forecast, By Instrument, 2021 – 2032

   11.4.8.5.2 Trade Finance Market Size & Forecast, By Service Provider, 2021 – 2032

   11.4.8.5.3 Trade Finance Market Size & Forecast, By Trade, 2021 – 2032

   11.4.8.5.4 Trade Finance Market Size & Forecast, By Vertical, 2021 – 2032

   11.4.8.5.5 Trade Finance Market Size & Forecast, By Enterprise Size, 2021 – 2032

   11.4.8.5.6 Trade Finance Market Size & Forecast, By End Use, 2021 – 2032

  11.4.8.6 ASEAN Countries

   11.4.8.6.1 Trade Finance Market Size & Forecast, By Instrument, 2021 – 2032

   11.4.8.6.2 Trade Finance Market Size & Forecast, By Service Provider, 2021 – 2032

   11.4.8.6.3 Trade Finance Market Size & Forecast, By Trade, 2021 – 2032

   11.4.8.6.4 Trade Finance Market Size & Forecast, By Vertical, 2021 – 2032

   11.4.8.6.5 Trade Finance Market Size & Forecast, By Enterprise Size, 2021 – 2032

   11.4.8.6.6 Trade Finance Market Size & Forecast, By End Use, 2021 – 2032

  11.4.8.7 Rest of Asia-Pacific

   11.4.8.7.1 Trade Finance Market Size & Forecast, By Instrument, 2021 – 2032

   11.4.8.7.2 Trade Finance Market Size & Forecast, By Service Provider, 2021 – 2032

   11.4.8.7.3 Trade Finance Market Size & Forecast, By Trade, 2021 – 2032

   11.4.8.7.4 Trade Finance Market Size & Forecast, By Vertical, 2021 – 2032

   11.4.8.7.5 Trade Finance Market Size & Forecast, By Enterprise Size, 2021 – 2032

   11.4.8.7.6 Trade Finance Market Size & Forecast, By End Use, 2021 – 2032

11.5 Latin America

 11.5.1 Key Trends

 11.5.2 Trade Finance Market Size & Forecast, By Instrument, 2021 – 2032

 11.5.3 Trade Finance Market Size & Forecast, By Service Provider, 2021 – 2032

 11.5.4 Trade Finance Market Size & Forecast, By Trade, 2021 – 2032

 11.5.5 Trade Finance Market Size & Forecast, By Vertical, 2021 – 2032

 11.5.6 Trade Finance Market Size & Forecast, By Enterprise Size, 2021 – 2032

 11.5.7 Trade Finance Market Size & Forecast, By End Use, 2021 – 2032

 11.5.8 Trade Finance Market Size & Forecast, By Country, 2021 – 2032

  11.5.8.1 Brazil

   11.5.8.1.1 Trade Finance Market Size & Forecast, By Instrument, 2021 – 2032

   11.5.8.1.2 Trade Finance Market Size & Forecast, By Service Provider, 2021 – 2032

   11.5.8.1.3 Trade Finance Market Size & Forecast, By Trade, 2021 – 2032

   11.5.8.1.4 Trade Finance Market Size & Forecast, By Vertical, 2021 – 2032

   11.5.8.1.5 Trade Finance Market Size & Forecast, By Enterprise Size, 2021 – 2032

   11.5.8.1.6 Trade Finance Market Size & Forecast, By End Use, 2021 – 2032

  11.5.8.2 Argentina

   11.5.8.2.1 Trade Finance Market Size & Forecast, By Instrument, 2021 – 2032

   11.5.8.2.2 Trade Finance Market Size & Forecast, By Service Provider, 2021 – 2032

   11.5.8.2.3 Trade Finance Market Size & Forecast, By Trade, 2021 – 2032

   11.5.8.2.4 Trade Finance Market Size & Forecast, By Vertical, 2021 – 2032

   11.5.8.2.5 Trade Finance Market Size & Forecast, By Enterprise Size, 2021 – 2032

   11.5.8.2.6 Trade Finance Market Size & Forecast, By End Use, 2021 – 2032

  11.5.8.3 Mexico

   11.5.8.3.1 Trade Finance Market Size & Forecast, By Instrument, 2021 – 2032

   11.5.8.3.2 Trade Finance Market Size & Forecast, By Service Provider, 2021 – 2032

   11.5.8.3.3 Trade Finance Market Size & Forecast, By Trade, 2021 – 2032

   11.5.8.3.4 Trade Finance Market Size & Forecast, By Vertical, 2021 – 2032

   11.5.8.3.5 Trade Finance Market Size & Forecast, By Enterprise Size, 2021 – 2032

   11.5.8.3.6 Trade Finance Market Size & Forecast, By End Use, 2021 – 2032

  11.5.8.4 Colombia

   11.5.8.4.1 Trade Finance Market Size & Forecast, By Instrument, 2021 – 2032

   11.5.8.4.2 Trade Finance Market Size & Forecast, By Service Provider, 2021 – 2032

   11.5.8.4.3 Trade Finance Market Size & Forecast, By Trade, 2021 – 2032

   11.5.8.4.4 Trade Finance Market Size & Forecast, By Vertical, 2021 – 2032

   11.5.8.4.5 Trade Finance Market Size & Forecast, By Enterprise Size, 2021 – 2032

   11.5.8.4.6 Trade Finance Market Size & Forecast, By End Use, 2021 – 2032

  11.5.8.5 Rest of Latin America

   11.5.8.5.1 Trade Finance Market Size & Forecast, By Instrument, 2021 – 2032

   11.5.8.5.2 Trade Finance Market Size & Forecast, By Service Provider, 2021 – 2032

   11.5.8.5.3 Trade Finance Market Size & Forecast, By Trade, 2021 – 2032

   11.5.8.5.4 Trade Finance Market Size & Forecast, By Vertical, 2021 – 2032

   11.5.8.5.5 Trade Finance Market Size & Forecast, By Enterprise Size, 2021 – 2032

   11.5.8.5.6 Trade Finance Market Size & Forecast, By End Use, 2021 – 2032

11.6 Middle East & Africa

 11.6.1 Key Trends

 11.6.2 Trade Finance Market Size & Forecast, By Instrument, 2021 – 2032

 11.6.3 Trade Finance Market Size & Forecast, By Service Provider, 2021 – 2032

 11.6.4 Trade Finance Market Size & Forecast, By Trade, 2021 – 2032

 11.6.5 Trade Finance Market Size & Forecast, By Vertical, 2021 – 2032

 11.6.6 Trade Finance Market Size & Forecast, By Enterprise Size, 2021 – 2032

 11.6.7 Trade Finance Market Size & Forecast, By End Use, 2021 – 2032

 11.6.8 Trade Finance Market Size & Forecast, By Country, 2021 – 2032

  11.6.8.1 UAE

   11.6.8.1.1 Trade Finance Market Size & Forecast, By Instrument, 2021 – 2032

   11.6.8.1.2 Trade Finance Market Size & Forecast, By Service Provider, 2021 – 2032

   11.6.8.1.3 Trade Finance Market Size & Forecast, By Trade, 2021 – 2032

   11.6.8.1.4 Trade Finance Market Size & Forecast, By Vertical, 2021 – 2032

   11.6.8.1.5 Trade Finance Market Size & Forecast, By Enterprise Size, 2021 – 2032

   11.6.8.1.6 Trade Finance Market Size & Forecast, By End Use, 2021 – 2032

  11.6.8.2 Saudi Arabia

   11.6.8.2.1 Trade Finance Market Size & Forecast, By Instrument, 2021 – 2032

   11.6.8.2.2 Trade Finance Market Size & Forecast, By Service Provider, 2021 – 2032

   11.6.8.2.3 Trade Finance Market Size & Forecast, By Trade, 2021 – 2032

   11.6.8.2.4 Trade Finance Market Size & Forecast, By Vertical, 2021 – 2032

   11.6.8.2.5 Trade Finance Market Size & Forecast, By Enterprise Size, 2021 – 2032

   11.6.8.2.6 Trade Finance Market Size & Forecast, By End Use, 2021 – 2032

  11.6.8.3 Qatar

   11.6.8.3.1 Trade Finance Market Size & Forecast, By Instrument, 2021 – 2032

   11.6.8.3.2 Trade Finance Market Size & Forecast, By Service Provider, 2021 – 2032

   11.6.8.3.3 Trade Finance Market Size & Forecast, By Trade, 2021 – 2032

   11.6.8.3.4 Trade Finance Market Size & Forecast, By Vertical, 2021 – 2032

   11.6.8.3.5 Trade Finance Market Size & Forecast, By Enterprise Size, 2021 – 2032

   11.6.8.3.6 Trade Finance Market Size & Forecast, By End Use, 2021 – 2032

  11.6.8.4 Egypt

   11.6.8.4.1 Trade Finance Market Size & Forecast, By Instrument, 2021 – 2032

   11.6.8.4.2 Trade Finance Market Size & Forecast, By Service Provider, 2021 – 2032

   11.6.8.4.3 Trade Finance Market Size & Forecast, By Trade, 2021 – 2032

   11.6.8.4.4 Trade Finance Market Size & Forecast, By Vertical, 2021 – 2032

   11.6.8.4.5 Trade Finance Market Size & Forecast, By Enterprise Size, 2021 – 2032

   11.6.8.4.6 Trade Finance Market Size & Forecast, By End Use, 2021 – 2032

  11.6.8.5 South Africa

   11.6.8.5.1 Trade Finance Market Size & Forecast, By Instrument, 2021 – 2032

   11.6.8.5.2 Trade Finance Market Size & Forecast, By Service Provider, 2021 – 2032

   11.6.8.5.3 Trade Finance Market Size & Forecast, By Trade, 2021 – 2032

   11.6.8.5.4 Trade Finance Market Size & Forecast, By Vertical, 2021 – 2032

   11.6.8.5.5 Trade Finance Market Size & Forecast, By Enterprise Size, 2021 – 2032

   11.6.8.5.6 Trade Finance Market Size & Forecast, By End Use, 2021 – 2032

  11.6.8.6 Rest of Middle East & Africa

   11.6.8.6.1 Trade Finance Market Size & Forecast, By Instrument, 2021 – 2032

   11.6.8.6.2 Trade Finance Market Size & Forecast, By Service Provider, 2021 – 2032

   11.6.8.6.3 Trade Finance Market Size & Forecast, By Trade, 2021 – 2032

   11.6.8.6.4 Trade Finance Market Size & Forecast, By Vertical, 2021 – 2032

   11.6.8.6.5 Trade Finance Market Size & Forecast, By Enterprise Size, 2021 – 2032

   11.6.8.6.6 Trade Finance Market Size & Forecast, By End Use, 2021 – 2032

12. Competitive Landscape

 12.1 Key Players' Positioning

 12.2 Competitive Developments

  12.2.1 Key Strategies Adopted (%), By Key Players, 2024

  12.2.2 Year-Wise Strategies & Development, 2021 – 2025

  12.2.3 Number Of Strategies Adopted By Key Players, 2024

 12.3 Market Share Analysis, 2024

 12.4 Product/Service & Application Benchmarking

  12.4.1 Product/Service Specifications & Features By Key Players

  12.4.2 Product/Service Heatmap By Key Players

  12.4.3 Application Heatmap By Key Players

 12.5 Industry Start-Up & Innovation Landscape

 12.6 Key Company Profiles

12.6 Key Company Profiles

 12.6.1 Standard Chartered PLC

  12.6.1.1 Company Overview & Snapshot

  12.6.1.2 Product/Service Portfolio

  12.6.1.3 Key Company Financials

  12.6.1.4 SWOT Analysis

 12.6.2 BNP Paribas

  12.6.2.1 Company Overview & Snapshot

  12.6.2.2 Product/Service Portfolio

  12.6.2.3 Key Company Financials

  12.6.2.4 SWOT Analysis

 12.6.3 Citigroup Inc.

  12.6.3.1 Company Overview & Snapshot

  12.6.3.2 Product/Service Portfolio

  12.6.3.3 Key Company Financials

  12.6.3.4 SWOT Analysis

 12.6.4 TD Bank

  12.6.4.1 Company Overview & Snapshot

  12.6.4.2 Product/Service Portfolio

  12.6.4.3 Key Company Financials

  12.6.4.4 SWOT Analysis

 12.6.5 UBS

  12.6.5.1 Company Overview & Snapshot

  12.6.5.2 Product/Service Portfolio

  12.6.5.3 Key Company Financials

  12.6.5.4 SWOT Analysis

 12.6.6 Arab Bank

  12.6.6.1 Company Overview & Snapshot

  12.6.6.2 Product/Service Portfolio

  12.6.6.3 Key Company Financials

  12.6.6.4 SWOT Analysis

 12.6.7 DBS Bank Ltd

  12.6.7.1 Company Overview & Snapshot

  12.6.7.2 Product/Service Portfolio

  12.6.7.3 Key Company Financials

  12.6.7.4 SWOT Analysis

 12.6.8 JPMorgan Chase & Co.

  12.6.8.1 Company Overview & Snapshot

  12.6.8.2 Product/Service Portfolio

  12.6.8.3 Key Company Financials

  12.6.8.4 SWOT Analysis

 12.6.9 Santander Bank / Banco Santander S.A.

  12.6.9.1 Company Overview & Snapshot

  12.6.9.2 Product/Service Portfolio

  12.6.9.3 Key Company Financials

  12.6.9.4 SWOT Analysis

 12.6.10 Deutsche Bank AG

  12.6.10.1 Company Overview & Snapshot

  12.6.10.2 Product/Service Portfolio

  12.6.10.3 Key Company Financials

  12.6.10.4 SWOT Analysis

 12.6.11 Bank of America Corporation

  12.6.11.1 Company Overview & Snapshot

  12.6.11.2 Product/Service Portfolio

  12.6.11.3 Key Company Financials

  12.6.11.4 SWOT Analysis

 12.6.12 HSBC Holdings plc

  12.6.12.1 Company Overview & Snapshot

  12.6.12.2 Product/Service Portfolio

  12.6.12.3 Key Company Financials

  12.6.12.4 SWOT Analysis

 12.6.13 Commerzbank AG

  12.6.13.1 Company Overview & Snapshot

  12.6.13.2 Product/Service Portfolio

  12.6.13.3 Key Company Financials

  12.6.13.4 SWOT Analysis

 12.6.14 Morgan Stanley

  12.6.14.1 Company Overview & Snapshot

  12.6.14.2 Product/Service Portfolio

  12.6.14.3 Key Company Financials

  12.6.14.4 SWOT Analysis

 12.6.15 Mitsubishi Corporation

  12.6.15.1 Company Overview & Snapshot

  12.6.15.2 Product/Service Portfolio

  12.6.15.3 Key Company Financials

  12.6.15.4 SWOT Analysis

 12.6.16 ANZ Bank

  12.6.16.1 Company Overview & Snapshot

  12.6.16.2 Product/Service Portfolio

  12.6.16.3 Key Company Financials

  12.6.16.4 SWOT Analysis

 12.6.17 Rabobank Group

  12.6.17.1 Company Overview & Snapshot

  12.6.17.2 Product/Service Portfolio

  12.6.17.3 Key Company Financials

  12.6.17.4 SWOT Analysis

 12.6.18 SunTrust Bank Holding Company

  12.6.18.1 Company Overview & Snapshot

  12.6.18.2 Product/Service Portfolio

  12.6.18.3 Key Company Financials

  12.6.18.4 SWOT Analysis

 12.6.19 UniCredit S.p.A

  12.6.19.1 Company Overview & Snapshot

  12.6.19.2 Product/Service Portfolio

  12.6.19.3 Key Company Financials

  12.6.19.4 SWOT Analysis

 12.6.20 Wells Fargo & Company

  12.6.20.1 Company Overview & Snapshot

  12.6.20.2 Product/Service Portfolio

  12.6.20.3 Key Company Financials

  12.6.20.4 SWOT Analysis

13. Analyst Recommendations

 13.1 SNS Insider Opportunity Map

 13.2 Industry Low-Hanging Fruit Assessment

 13.3 Market Entry & Growth Strategy

 13.4 Analyst Viewpoint & Suggestions On Market Growth

14. Assumptions

15. Disclaimer

16. Appendix

 16.1 List Of Tables

 16.2 List Of Figures

Key Segments: 

By Instrument

    • Letter of Credit

    • Supply Chain Financing

    • Documentary Collections

    • Receivables Financing/Invoice Discounting

    • Others

By Service Provider

    • Banks

    • Financial Institutions

    • Trading Houses

    • Others

By Trade

    • Domestic

    • International

By Enterprise Size

    • Large Enterprises

    • SMEs

By Vertical

    • BFSI

    • Construction

    • Wholesale/Retail

    • Manufacturing

    • Automobile

    • Shipping & Logistics

    • Others

By End Use

    • Importer

    • Exporter

    • Trade Intermediaries


Request for Segment Customization as per your Business Requirement: Segment Customization Request

Regional Coverage: 

North America

  • US

  • Canada

Europe

  • Germany

  • France

  • UK

  • Italy

  • Spain

  • Poland

  • Russia

  • Rest of Europe

Asia Pacific

  • China

  • India

  • Japan

  • South Korea

  • Australia

  • ASEAN Countries

  • Rest of Asia Pacific

Middle East & Africa

  • UAE

  • Saudi Arabia

  • Qatar

  • South Africa

  • Rest of Middle East & Africa

Latin America

  • Brazil

  • Argentina

  • Mexico

  • Colombia

  • Rest of Latin America

Request for Country Level Research Report: Country Level Customization Request

Available Customization 

With the given market data, SNS Insider offers customization as per the company’s specific needs. The following customization options are available for the report: 

  • Detailed Volume Analysis 

  • Criss-Cross segment analysis (e.g. Product X Application) 

  • Competitive Product Benchmarking 

  • Geographic Analysis 

  • Additional countries in any of the regions 

  • Customized Data Representation 

  • Detailed analysis and profiling of additional market players

An accurate research report requires proper strategizing as well as implementation. There are multiple factors involved in the completion of good and accurate research report and selecting the best methodology to compete the research is the toughest part. Since the research reports we provide play a crucial role in any company’s decision-making process, therefore we at SNS Insider always believe that we should choose the best method which gives us results closer to reality. This allows us to reach at a stage wherein we can provide our clients best and accurate investment to output ratio.

Each report that we prepare takes a timeframe of 350-400 business hours for production. Starting from the selection of titles through a couple of in-depth brain storming session to the final QC process before uploading our titles on our website we dedicate around 350 working hours. The titles are selected based on their current market cap and the foreseen CAGR and growth.


The 5 steps process:

Step 1: Secondary Research:

Secondary Research or Desk Research is as the name suggests is a research process wherein, we collect data through the readily available information. In this process we use various paid and unpaid databases which our team has access to and gather data through the same. This includes examining of listed companies’ annual reports, Journals, SEC filling etc. Apart from this our team has access to various associations across the globe across different industries. Lastly, we have exchange relationships with various university as well as individual libraries.

Secondary Research

Step 2: Primary Research

When we talk about primary research, it is a type of study in which the researchers collect relevant data samples directly, rather than relying on previously collected data.  This type of research is focused on gaining content specific facts that can be sued to solve specific problems. Since the collected data is fresh and first hand therefore it makes the study more accurate and genuine.

We at SNS Insider have divided Primary Research into 2 parts.

Part 1 wherein we interview the KOLs of major players as well as the upcoming ones across various geographic regions. This allows us to have their view over the market scenario and acts as an important tool to come closer to the accurate market numbers. As many as 45 paid and unpaid primary interviews are taken from both the demand and supply side of the industry to make sure we land at an accurate judgement and analysis of the market.

This step involves the triangulation of data wherein our team analyses the interview transcripts, online survey responses and observation of on filed participants. The below mentioned chart should give a better understanding of the part 1 of the primary interview.

Primary Research

Part 2: In this part of primary research the data collected via secondary research and the part 1 of the primary research is validated with the interviews from individual consultants and subject matter experts.

Consultants are those set of people who have at least 12 years of experience and expertise within the industry whereas Subject Matter Experts are those with at least 15 years of experience behind their back within the same space. The data with the help of two main processes i.e., FGDs (Focused Group Discussions) and IDs (Individual Discussions). This gives us a 3rd party nonbiased primary view of the market scenario making it a more dependable one while collation of the data pointers.

Step 3: Data Bank Validation

Once all the information is collected via primary and secondary sources, we run that information for data validation. At our intelligence centre our research heads track a lot of information related to the market which includes the quarterly reports, the daily stock prices, and other relevant information. Our data bank server gets updated every fortnight and that is how the information which we collected using our primary and secondary information is revalidated in real time.

Data Bank Validation

Step 4: QA/QC Process

After all the data collection and validation our team does a final level of quality check and quality assurance to get rid of any unwanted or undesired mistakes. This might include but not limited to getting rid of the any typos, duplication of numbers or missing of any important information. The people involved in this process include technical content writers, research heads and graphics people. Once this process is completed the title gets uploader on our platform for our clients to read it.

Step 5: Final QC/QA Process:

This is the last process and comes when the client has ordered the study. In this process a final QA/QC is done before the study is emailed to the client. Since we believe in giving our clients a good experience of our research studies, therefore, to make sure that we do not lack at our end in any way humanly possible we do a final round of quality check and then dispatch the study to the client.