App Analytics Market Size and Overview:
Get more information on App Analytics Market - Request Free Sample Report
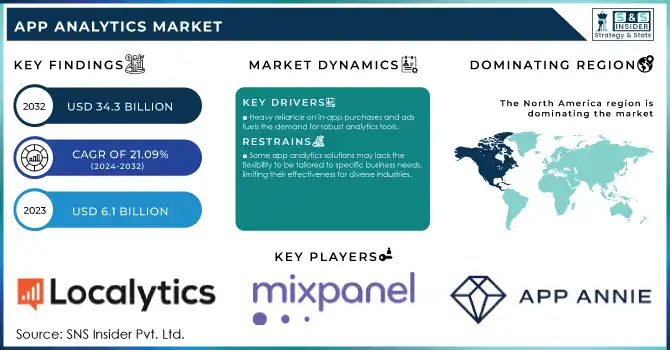
The App Analytics Market was valued at USD 6.1 Billion in 2023 and is expected to reach USD 34.3 Billion by 2032, growing at a CAGR of 21.09% from 2024-2032.
The App Analytics Market is rising due to mobile applications being used across many industries like e-commerce, gaming, healthcare, finance, etc. These tools are crucial for businesses to understand user behavior, test app effectiveness, and improve engagement, increasing customer satisfaction and driving revenue. The market's development is complemented by increased penetration of smartphones and mobile internet and increasing attention to data-driven methodologies in app development and marketing.
Mobile app downloads serve as a primary growth engine, with more than 255 billion downloads around the globe during 2023, showing the need for apps across every category continues to grow. This trend has prepared the advanced analytics solution that can process data through user interactions necessary due to the large volumes of data. Moreover, the high emphasis on personalization has led to a shift towards analytics platforms that provide insights into real-time user preferences and behaviors that can be rapidly converted into tailored offerings.
Another key factor driving the growth of the market is the rapid growth of global in-app advertising revenue which amounted to USD 250 billion in 2023. With analytics, developers, and advertisers can minimize placements while optimizing performance and ROI. Freemium app models with their dependence on in-app purchases and ads seemed to take the world by storm — leading to even more usage of analytic tools to properly monetize.
Regulations like GDPR and CCPA have spurred the creation of privacy-centric analytics solutions
These regulations have encouraged the use of tools that not just comply but also deliver insights and empower innovation in the market. The App Analytics Market is thriving, backed by increasing mobile app usage trends, technological development in AI and ML, and increasing focus on user-specific development. As the app ecosystem continues to develop and investments in mobile technologies increase, there are many reasons to believe the market is ripe for continued growth and innovation.
App Analytics Market Dynamics
Drivers
- Expanding mobile user base drives app usage and analytics adoption.
The growing number of mobile users is one of the main reasons for the growth of the app analytics market, resulting in a rise in app usage and cost-effective adoption of advanced analytics solutions. However, with the ever-increasing number of smartphones flooding the market and a decent amount of mobile internet being a lot more affordable, people are now spending more time using mobile applications in areas as diverse as e-commerce, social media, gaming, healthcare, finance, etc. In 2023, smartphone users worldwide exceeded 6.9 billion. As a result, it has created massive amounts of user activity data that companies now leverage to improve application experience and maximize user retention. With this growing user base comes more and more complex datasets that require app analytics tools to keep track of and analyze. Such solutions enable organizations to gain insights into user activity, discover patterns, and analyze other important KPIs such as time on site, retention, and conversion rates. For instance: retail apps can utilize analytics to understand how users navigate through the app, simplify the checkout process, and provide personalized product recommendations to maximize customer satisfaction and revenue.
-
Heavy reliance on in-app purchases and ads fuels the demand for robust analytics tools.
-
Enable predictive analytics, anomaly detection, and real-time insights to enhance app performance and user retention.
Restraints
- Some app analytics solutions may lack the flexibility to be tailored to specific business needs, limiting their effectiveness for diverse industries.
Some app analytics solutions may lack the flexibility needed to address the specific requirements of different industries, reducing their effectiveness. While many platforms offer a broad set of features, they may not be customizable enough to meet the distinct goals of various businesses. For example, an e-commerce app requires detailed insights into customer purchasing behavior, whereas a healthcare app may need analytics focused on user engagement and treatment adherence. If the analytics tool cannot be adjusted to capture these industry-specific metrics, it may fail to deliver the actionable insights necessary for optimization. Moreover, the inability to customize can hinder the integration of analytics with other business systems, creating inefficiencies.
Industries with stringent regulatory requirements, such as finance or healthcare, may also need specialized compliance features, which are often missing in generic solutions. This lack of adaptability can prevent businesses from fully leveraging app analytics, leading to missed opportunities and less effective decision-making.
-
Advanced app analytics tools can be expensive, particularly for small and medium-sized businesses, restricting adoption.
-
Integrating app analytics with existing systems and platforms can be complex, requiring significant technical expertise and resources.
App Analytics Market Segment Analysis
By Type
The Mobile App segment dominated the market and represented a significant revenue share of 72% in 2023. Mobile applications are extensively used in various domains like e-commerce, social media, games, and health systems (among others), producing large amounts of user data. The growing mobile internet and an exponentially growing number of mobile users solidify this dominance. In line with the growing complexity of mobile apps such as in-app purchases, tailored experiences, and mobile advertising more analytics tools are required to monitor user behavior and app performance. Going forward, the mobile app segment is expected to grow considerably, propelled by the development of AI, machine learning, and mobile app monetization.
The Website/Desktop Apps is expected to have the fastest growth rate during the forecast period. As businesses are progressively employing omnichannel methods, website and desktop apps are becoming as essential as mobile apps. As remote work, e-commerce, and cloud-based services continue to grow, business analytics requirements to enable user behavior analysis on any platform have also increased. Increasing demand for real-time insights, user engagement, and personalization of websites and desktop applications further fuels the growth of this segment.
By Application
The marketing/advertising Analytics segment dominated the App Analytics Market and represented a revenue share of more than 45% in 2023 due to their increased focus on targeted advertising campaigns and user acquisition plans. With companies investing more in digital marketing, understanding user behavior and optimizing sign ads accordingly is crucial for ROI. Through marketing and advertising analytics, firms and advertisers can monitor the potency of campaigns, segment audiences, and optimize ad experiences with content personalization, leading to greater user engagement and conversion rates.
In-app Performance Analytics is expected to gain the fastest CAGR during the forecast period. With businesses focusing more on user experience and engagement, in-app performance analytics has become necessary to monitor metrics such as load times, crashes, and user retention. These kinds of analytics help provide immediate insight into app workings enabling rapid developer fixing for performance improvement and thus more optimization for user experience. This segment is fueled primarily by increased usage of mobile apps, as well as the growth of the freemium model, which is entirely dependent on user retention.
Regional Analysis
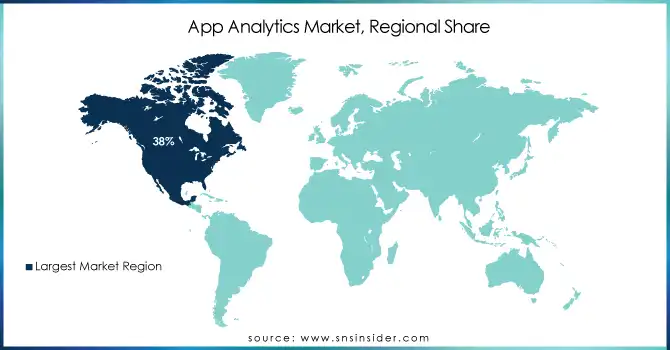
North America dominated the market and represented a significant revenue share of more than 38% in 2023. Fueled by the modern technological infrastructure of the country, widespread smartphone ownership, and the presence of global technology Giants. As businesses from e-commerce to finance, healthcare, and entertainment are becoming more and more dependent on mobile apps, the need for app analytics solutions is rapidly increasing. In addition, the presence of various analytic companies in North America also drives the growth of the market.
Asia Pacific region is expected to register the fastest CAGR in the forecast period. Some of these factors include the region experiencing a rapid digital transformation, the growing mobile user base, and mobile app adoption in the region. In China, India, Japan, etc., mobile app usage is growing in several industries, including e-commerce, gaming, and finance. The increasing number of personalized experiences along with the rapid growth of mobile advertising are some of the growing factors fuelling the demand for app analytics solutions.
Need any customization research on App Analytics Market - Enquiry Now
Key Players
The major key players along with their products are
-
Adobe
-
Flurry
-
Amplitude
-
Appsflyer
-
Localytics
-
Kissmetrics
-
Adjust
-
CleverTap
-
Piwik PRO
-
Segment
-
Smartlook
-
MoEngage
-
App Annie
-
Bugsnag
-
New Relic
-
Sentry
-
Countly
Recent Developments
-
In July 2024, Google announced the integration of advanced machine learning algorithms into Firebase Analytics, enhancing real-time user behavior tracking and predictive analytics capabilities.
-
In June 2024, Adobe introduced AI-powered insights in Adobe Analytics, enabling businesses to gain deeper understanding of customer journeys and optimize marketing strategies.
| Report Attributes | Details |
| Market Size in 2023 | USD 6.1 Billion |
| Market Size by 2032 | USD 34.3 Billion |
| CAGR | CAGR of 21.09% from 2024-2032 |
| Base Year | 2023 |
| Forecast Period | 2024-2032 |
| Historical Data | 2020-2022 |
| Report Scope & Coverage | Market Size, Segments Analysis, Competitive Landscape, Regional Analysis, DROC & SWOT Analysis, Forecast Outlook |
| Key Segments | • By Type (Mobile App Analytics, Web App Analytics) • By Application (Marketing/Advertising Analytics, In-app Analytics, Revenue Analytics) • By Industry Vertical (Gaming, Media Entertainment, IT, Telecom, Health, Fitness, Hospitality, Retail, E-Commerce, Education, BFSI, Others) |
| Regional Analysis/Coverage | North America (US, Canada, Mexico), Europe (Eastern Europe [Poland, Romania, Hungary, Turkey, Rest of Eastern Europe] Western Europe] Germany, France, UK, Italy, Spain, Netherlands, Switzerland, Austria, Rest of Western Europe]), Asia Pacific (China, India, Japan, South Korea, Vietnam, Singapore, Australia, Rest of Asia Pacific), Middle East & Africa (Middle East [UAE, Egypt, Saudi Arabia, Qatar, Rest of Middle East], Africa [Nigeria, South Africa, Rest of Africa], Latin America (Brazil, Argentina, Colombia, Rest of Latin America) |
| Company Profiles | Localytics, App Annie, Mixpanel, Countly, AppDynamics (Cisco), Appsee, AppsFlyer, CleverTap, Adobe, International Business Machines Corporation |
| Key Drivers |
• Expanding mobile user base drives app usage and analytics adoption |
| Market Restraints |
• Some app analytics solutions may lack the flexibility to be tailored to specific business needs, limiting their effectiveness for diverse industries. |
Frequently Asked Questions
Ans The App Analytics Market was valued at USD 6.1 Billion in 2023 and is expected to reach USD 34.3 Billion by 2032, growing at a CAGR of 21.09% from 2024-2032.
Ans- the CAGR of the App Analytics Market during the forecast period is 21.09% from 2024-2032.
Ans- the North America dominated the market and represented a significant revenue share in 2023
Ans- Heavy reliance on in-app purchases and ads fuels the demand for robust analytics tools.
Ans- Advanced app analytics tools can be expensive, particularly for small and medium-sized businesses, restricting adoption.
Get in Touch
