Utility Vegetation Management Market Report Scope & Overview:
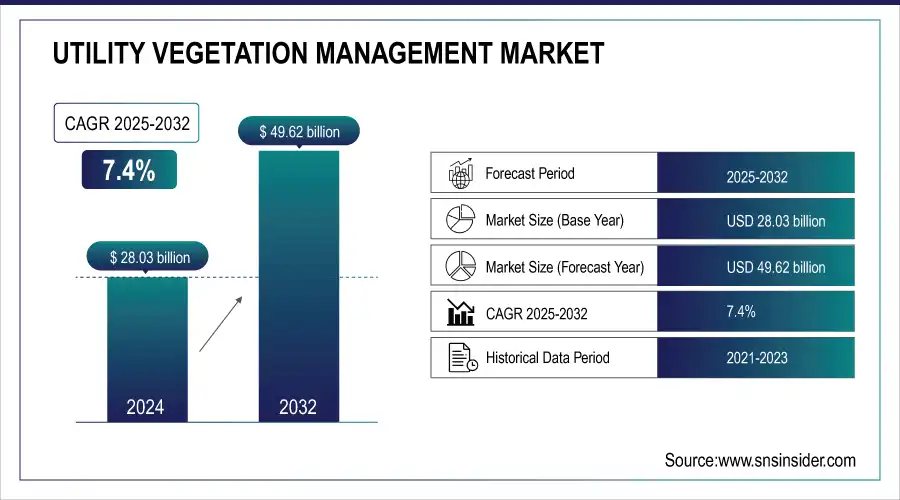
The Utility Vegetation Management Market size was valued at USD 28.03 billion in 2024 and is expected to grow to USD 49.62 billion by 2032 and grow at a CAGR of 7.4% over the forecast period of 2025-2032.
Get more information on Utility Vegetation Management Market - Request Sample Report
Utility vegetation management, in its simplest form, refers to many procedures that help utilities remove undesirable and dangerous vegetation from structures, electricity lines, and other assets. Tree damage may have a large financial impact on towns by affecting electrical lines, resulting in fires and power outages. In addition to obstructing basic utilities, overgrown vegetation also provides a haven for bugs and other dangerous species.
Utility Vegetation Management Market Size and Forecast:
-
Market Size in 2024: USD 28.03 Billion
-
Market Size by 2032: USD 49.62 Billion
-
CAGR: 7.4% from 2025 to 2032
-
Base Year: 2024
-
Forecast Period: 2025–2032
-
Historical Data: 2021–2023
Utility Vegetation Management Market Key Trends:
-
Adoption of advanced vegetation monitoring technologies – Utilities are increasingly using drones, LiDAR, and satellite imagery for real-time monitoring, improving accuracy, efficiency, and risk mitigation.
-
Shift towards integrated vegetation management (IVM) practices – Combining mechanical, chemical, and biological methods promotes sustainable, eco-friendly vegetation control while ensuring compliance with environmental regulations.
-
Regulatory pressures driving proactive management – Stricter guidelines on vegetation clearance around power lines compel utilities to adopt comprehensive management programs to prevent wildfires and outages.
-
Increased investment in vegetation management programs – Utilities are allocating more resources for equipment, skilled personnel, and technology, reducing outages and ensuring grid reliability.
-
Focus on climate resilience and wildfire mitigation – Enhanced vegetation management strategies help mitigate wildfire risks, particularly in drought-prone and high-wind regions.
Communities may suffer when vegetation grows too close to infrastructure, such as electricity lines, generators, railroads, and other assets, leading to service interruptions and safety issues. For improved safety and convenience, it's crucial to manage the vegetation around roads, railroads, and industrial areas. Additionally, invasive plant species can harm property's structural integrity and provide serious safety risks if the plants.
Utility Vegetation Management Market Driver:
-
Increasing Frequency of Extreme Weather Events Enhances the Need for Utility Vegetation Management
The escalating frequency and severity of extreme weather events have significantly heightened the risk of vegetation-related power outages. As storms and wildfires become more common, overgrown trees and plants are more likely to interfere with power lines, leading to service disruptions. This trend has intensified the demand for proactive vegetation management strategies to maintain grid reliability. In response, utilities are investing in advanced technologies and services to mitigate these risks. For instance, the adoption of LiDAR and AI-powered analytics allows for precise vegetation monitoring and management, enabling utilities to identify and address potential hazards before they cause outages. These technological advancements not only improve safety but also enhance operational efficiency, contributing to the overall growth of the UVM market.
Example: In November 2024, severe storms in Canada led to widespread power outages, affecting nearly 330,000 residents. This event underscored the critical need for effective vegetation management to prevent such disruptions.
Utility Vegetation Management Market Restraints:
-
High Operational Costs Associated with Advanced Vegetation Management Technologies
The integration of advanced technologies like LiDAR, drones, and AI analytics into vegetation management practices has introduced substantial operational costs. These technologies require significant capital investment and ongoing maintenance, which can be a financial burden for utilities, especially smaller ones with limited budgets. Additionally, the complexity of these systems necessitates specialized training for personnel, further increasing expenses. While these technologies offer long-term benefits in terms of efficiency and safety, the initial and recurring costs pose a significant challenge to widespread adoption. Utilities must carefully evaluate the cost-benefit ratio to determine the feasibility of implementing such advanced solutions.
A mid-sized utility company faced challenges in adopting LiDAR technology due to the high initial investment and the need for specialized training, delaying its implementation.
Utility Vegetation Management Market Opportunities:
-
Adoption of AI-Powered Analytics for Predictive Vegetation Management
The integration of AI-powered analytics into vegetation management presents a significant opportunity for utilities to enhance operational efficiency and safety. By leveraging machine learning algorithms, utilities can predict vegetation growth patterns and potential interference with power lines, allowing for proactive maintenance and timely interventions. This predictive approach not only reduces the risk of outages but also optimizes resource allocation, leading to cost savings. The growing emphasis on digital transformation within the energy sector is driving the adoption of such technologies, positioning AI as a key enabler in the evolution of vegetation management practices.
In 2024, a leading utility company implemented an AI-based vegetation management system, resulting in a 15% reduction in vegetation-related outages within the first year of deployment.
Utility Vegetation Management Market Segmentation Analysis:
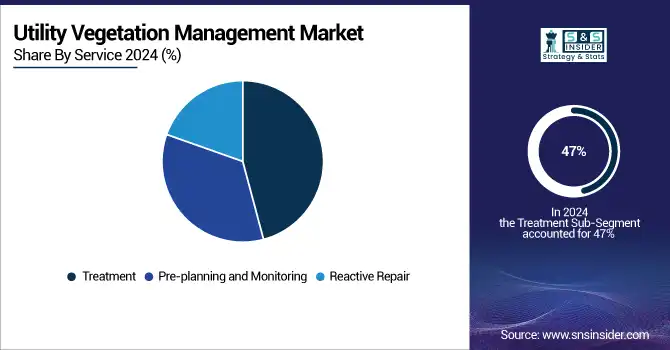
By Service, Treatment dominates with 47% share in 2024, Pre-planning & Monitoring segment to grow fastest with 9.55% CAGR
The Treatment segment held the largest share of revenue, 47% in 2024, and continues to lead due to the critical need for controlling vegetation near utility assets such as power lines and substations. Treatment methods, including herbicide application and mechanical removal, prevent outages and protect infrastructure reliability. Utilities rely on these interventions to ensure uninterrupted service. Proactive product development in chemical solutions and mechanized tools further enhances operational efficiency and safety, supporting sustained market dominance.
The Pre-planning & Monitoring segment is projected to grow at a CAGR of 9.55% during the forecast period. The adoption of Geographic Information Systems (GIS), remote sensing, and drone technologies enables utilities to map, assess, and predict vegetation growth and potential hazards. Early detection of risks allows for timely interventions, reducing maintenance costs and improving service reliability. The integration of predictive analytics and monitoring platforms drives innovation and accelerates growth in this segment.
By Technology, Insecticides & Herbicides dominates with 53% share in 2024, LiDAR segment to grow fastest CAGR.
The Insecticides & Herbicides segment held the largest revenue share, 53% in 2024, and continues to dominate due to their effectiveness in controlling invasive plants and pests that threaten utility infrastructure. These chemical solutions are cost-efficient and provide quick results, making them a preferred choice for vegetation management. Ongoing product development focuses on safer, eco-friendly formulations, enhancing reliability and reducing environmental impact, which strengthens the segment’s leadership in the market.
The LiDAR segment is projected to grow at a CAGR of 8.4% during the forecast period. LiDAR technology enables high-resolution, three-dimensional mapping of vegetation and terrain, allowing utilities to assess and manage vegetation risks accurately. By integrating LiDAR with Geographic Information Systems (GIS) and predictive analytics, utilities can implement precise, data-driven vegetation management strategies. The adoption of this advanced technology improves efficiency, reduces maintenance costs, and drives market growth in the rapidly evolving UVM sector.
Utility Vegetation Management Market Regional Analysis
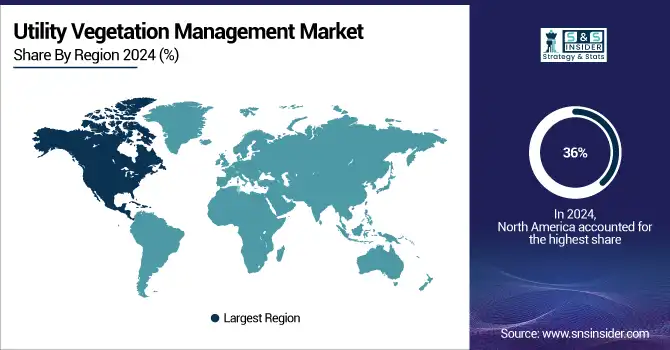
North America dominates the Utility Vegetation Management market in 2024
In 2024, North America holds an estimated 36% share of the Utility Vegetation Management (UVM) market, driven by stringent wildfire regulations, aging infrastructure, and rising demand for reliable electricity. Utilities are investing heavily in advanced vegetation management services to prevent outages and reduce fire risks. Sophisticated technologies, including drones, LiDAR, and AI-based monitoring systems, enhance operational efficiency. Leading U.S. service providers implement proactive clearance strategies, predictive maintenance, and environmentally compliant practices. These factors collectively sustain North America’s leadership position and reinforce its critical role in advancing vegetation management practices.
Get Customized Report as per your Business Requirement - Request For Customized Report
-
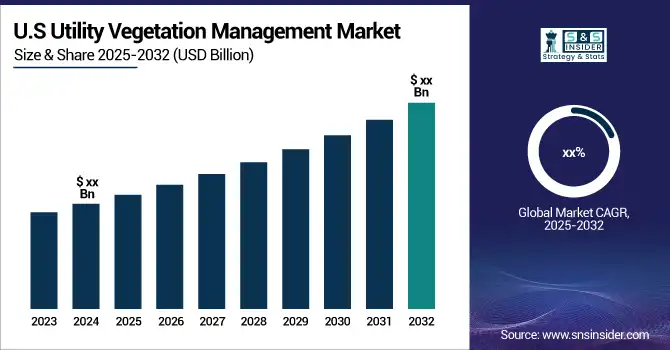
United States leads North America’s Utility Vegetation Management market
The United States dominates due to its vast and aging power infrastructure and the high risk of wildfires in regions like California and the Pacific Northwest. Regulatory mandates from agencies such as FERC and NERC require utilities to maintain strict vegetation clearance. Integration of advanced monitoring technologies and predictive analytics helps utilities optimize maintenance schedules and reduce service disruptions. High investment in grid modernization, combined with a focus on safety and operational reliability, positions the U.S. as the largest contributor to North America’s UVM market in 2024.
Asia Pacific is the fastest-growing region in the Utility Vegetation Management market in 2024
The Asia Pacific UVM market is projected to grow rapidly, with an estimated CAGR of 6.4% from 2025 to 2032, fueled by urbanization, expanding power grids, and rising electricity demand in developing economies. Utilities are adopting advanced vegetation management technologies to maintain grid reliability and prevent outages caused by overgrown vegetation. Governments’ infrastructure expansion projects and focus on disaster preparedness further accelerate market growth. Service providers integrate remote monitoring, GIS mapping, and drone surveillance to enhance operational efficiency. Collectively, these factors position Asia Pacific as the fastest-growing region in the forecast period.
-
India leads Asia Pacific’s Utility Vegetation Management market
India dominates the Asia Pacific market due to its rapid urbanization, growing electricity consumption, and large-scale power infrastructure expansion. Government initiatives for grid modernization and renewable energy integration require efficient vegetation management to prevent service disruptions. The adoption of drone and LiDAR technology for vegetation monitoring, combined with regional utility companies’ proactive maintenance programs, strengthens India’s market position. Increasing investment in safety, operational reliability, and regulatory compliance ensures India remains the key contributor to Asia Pacific’s UVM market growth in 2024.
Europe Utility Vegetation Management market insights, 2024
Europe shows steady growth in 2024, supported by infrastructure modernization, regulatory compliance, and environmental sustainability initiatives. Utilities are investing in proactive vegetation control and monitoring technologies to minimize outages and wildfire risks. Countries are leveraging integrated vegetation management (IVM) practices, combining mechanical, chemical, and biological methods.
-
Germany leads Europe’s Utility Vegetation Management market
Germany dominates due to its robust energy infrastructure, strong regulatory framework, and proactive approach to vegetation control. Government emphasis on grid reliability, renewable energy integration, and environmental compliance drives demand for advanced vegetation management services, making Germany the largest contributor to Europe’s UVM market in 2024.
Middle East & Africa and Latin America Utility Vegetation Management market insights, 2024
The UVM market in the Middle East & Africa and Latin America is experiencing moderate growth in 2024. In the Middle East, rapid urbanization and investments in power infrastructure, particularly in Saudi Arabia and the UAE, fuel demand for vegetation management. Africa’s emerging urban centers are gradually adopting advanced monitoring practices as electricity demand rises. In Latin America, Brazil and Mexico lead the market due to extensive transmission networks and increasing investments in vegetation management to prevent outages and ensure grid reliability.
Competitive Landscape for the Utility Vegetation Management Market:
Asplundh Tree Expert LLC
Asplundh Tree Expert LLC is a U.S.-based leader in utility vegetation management, specializing in tree trimming, brush clearing, and power line maintenance services. With over 90 years of experience, the company provides advanced solutions for utility infrastructure protection, storm damage mitigation, and right-of-way maintenance. Asplundh operates nationwide, managing project planning, execution, and safety compliance from its headquarters in Pennsylvania. Its role in the UVM market is vital, as it ensures reliable power delivery by preventing vegetation-related outages and hazards while integrating technology-driven solutions for monitoring and maintenance.
-
In 2024, Asplundh launched a new LiDAR-assisted vegetation mapping program, enabling precise risk assessment and proactive tree trimming along major transmission corridors.
Davey Tree Expert Company
Davey Tree Expert Company is a U.S.-based vegetation management service provider, offering tree care, utility line clearance, and ecological restoration services. Founded in 1880, Davey integrates sustainability practices with advanced monitoring technologies, including GIS mapping and drone surveillance, to support utilities and municipalities. Its role in the UVM market is critical, providing comprehensive vegetation control strategies that minimize service disruptions and maintain environmental compliance. By combining traditional arboriculture expertise with modern technology, Davey enhances reliability and efficiency across diverse utility networks.
-
In July 2024, Davey Tree Expert Company implemented AI-powered predictive vegetation analytics for the first time, improving service planning and outage prevention in high-risk areas.
Lewis Tree Service Inc.
Lewis Tree Service Inc. is a U.S.-based provider of utility vegetation management, specializing in power line clearance, right-of-way maintenance, and storm response. With decades of operational expertise, the company delivers safety-driven solutions for large-scale electrical grids across North America. Its role in the UVM market is pivotal, as it combines skilled workforce deployment with advanced equipment and mapping technologies to reduce outages, enhance grid reliability, and protect critical infrastructure. Lewis Tree Service also emphasizes environmental stewardship, integrating sustainable practices into routine operations.
-
In 2024, Lewis Tree Service introduced drone-enabled aerial inspection services to identify vegetation threats efficiently, reducing manual assessment time by 40%.
Nelson Tree Service LLC
Nelson Tree Service LLC is a U.S.-based utility vegetation management firm specializing in tree trimming, vegetation monitoring, and power line safety solutions. The company serves utility providers across the country, focusing on reducing outage risks and supporting infrastructure resilience. Nelson integrates advanced technology such as GIS, drones, and predictive software to enhance operational efficiency and compliance. Its role in the UVM market is essential, providing utilities with proactive management strategies, storm preparedness services, and sustainable vegetation control to ensure consistent and safe energy delivery.
-
In early 2024, Nelson Tree Service launched a remote sensing program combining drone imagery with GIS analysis to proactively manage high-risk vegetation zones along transmission lines.
Utility Vegetation Management Market Kay Players:
-
Asplundh Tree Expert LLC
-
Davey Tree Expert Company
-
Lewis Tree Service Inc.
-
Nelson Tree Service LLC
-
Wright Tree Service
-
ACRT Services Inc.
-
Corteva Agriscience
-
BASF SE
-
Boultbee Vegetation Management
-
Helena Professional Products
-
TRC Companies, Inc.
-
Leidos
-
IBM
-
Capgemini
-
Cyient
-
GETAC
-
ArborMetrics Solutions Inc.
-
Environmental Consultants Inc. (ECI)
-
Precision Vegetation Management (PVM)
-
Xylem Tree Experts
| Report Attributes | Details |
| Market Size in 2024 | US$ 28.03 Bn |
| Market Size by 2032 | US$ 49.62 Bn |
| CAGR | CAGR of 7.4% From 2025 to 2032 |
| Base Year | 2024 |
| Forecast Period | 2025-2032 |
| Historical Data | 2021-2023 |
| Report Scope & Coverage | Market Size, Segments Analysis, Competitive Landscape, Regional Analysis, DROC & SWOT Analysis, Forecast Outlook |
| Key Segments | • By Service (Treatment, Pre-planning and Monitoring, Reactive Repair) • By Technology (Insecticides & Herbicides, Plant Growth Regulators, LIDAR, Others) |
| Regional Analysis/Coverage | North America (US, Canada, Mexico), Europe (Germany, France, UK, Italy, Spain, Poland, Turkey, Rest of Europe), Asia Pacific (China, India, Japan, South Korea, Singapore, Australia, Taiwan, Rest of Asia Pacific), Middle East & Africa (UAE, Saudi Arabia, Qatar, South Africa, Rest of Middle East & Africa), Latin America (Brazil, Argentina, Rest of Latin America) |
| Company Profiles | Asplundh Tree Expert LLC, Davey Tree Expert Company, Lewis Tree Service Inc., Nelson Tree Service LLC, Wright Tree Service, ACRT Services Inc., Corteva Agriscience, BASF SE, Boultbee Vegetation Management, Helena Professional Products, TRC Companies, Inc., Leidos, IBM, Capgemini, Cyient, GETAC, ArborMetrics Solutions Inc., Environmental Consultants Inc. (ECI), Precision Vegetation Management (PVM), Xylem Tree Experts |
Frequently Asked Questions
Ans: Difficult to strike a balance between the requirement for vegetation management and environmental preservation and Public Relations and Community Engagement.
Ans: North America is dominating the market.
Ans: Utility Vegetation Management Market size was valued at USD 28.03 billion in 2024.
Ans: USD 49.62 billion is expected to grow by 2032.
Ans: Utility Vegetation Management Market is anticipated to expand by 7.4 % from 2025 to 2032.
Get in Touch
