Utility Vehicle Market Report Scope & Overview:

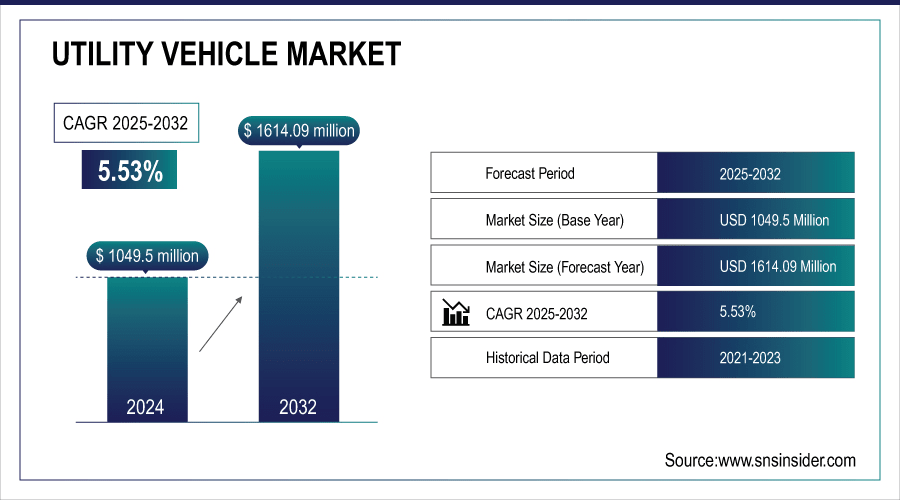
The Utility Vehicle Market size was valued at USD 1049.5 Million in 2024 and is projected to reach USD 1614.09 Million by 2032, growing at a CAGR of 5.53% during 2025–2032.

The Utility Vehicle Market is witnessing strong growth driven by increasing demand across agriculture, construction, government, and recreational sectors. Key factors include the need for versatile, durable, and efficient vehicles capable of handling diverse terrains and heavy-duty tasks. Technological advancements such as electric propulsion, 4WD drivetrains, and enhanced safety features are reshaping product offerings. Expanding applications in hospitality, entertainment, and municipalities are further fueling market adoption. Additionally, sustainability initiatives and the shift toward low-emission and electric vehicles are driving innovation and influencing purchasing decisions, making utility vehicles an essential tool across multiple industries.

August 26, 2025 – Can-Am unveiled the 2026 Defender HD11 and Outlander Electric at the Farm Progress Show in Decatur, Illinois, offering improved performance, quieter cabins, reduced maintenance, and the first mass-produced electric ATV.

Utility-Vehicle-Market

To Get More Information On Utility Vehicle Market - Request Free Sample Report

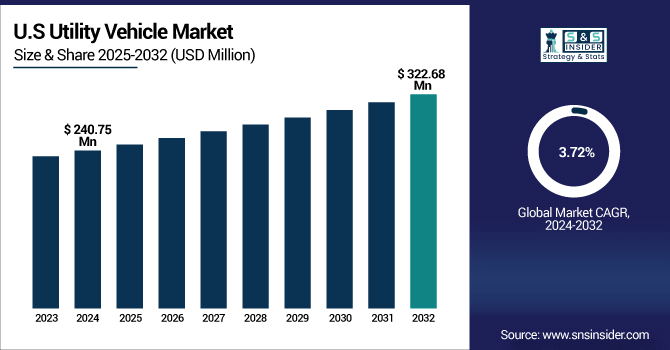
The U.S. Utility Vehicle Market size was valued at USD 240.75 Million in 2024 and is projected to reach USD 322.68 Million by 2032, growing at a CAGR of 3.72% during 2025–2032. growth is fueled by rising demand for versatile and durable vehicles across agriculture, construction, government, and recreational sectors. Technological advancements, including electric propulsion and 4WD drivetrains, along with increasing focus on sustainability, are driving adoption and innovation in the market.

Utility-Vehicle-Market-Us

Utility Vehicle Market Highlights:

  • Rising electrification and advanced features are accelerating utility vehicle adoption.

  • High costs, limited charging infrastructure, and strict regulations constrain market growth.

  • Innovations in autonomous driving, smart controls, and displays create new opportunities.

  • Electric drivetrains meet sustainability demands by reducing emissions and operational costs.

  • Kia launched the EV5 with advanced features, and Hyundai Mobis showcased 20+ mobility technologies at IAA Mobility 2025.

Utility Vehicle Market Drivers:

  • Rising Electrification and Advanced Features Drive Utility Vehicle Adoption

The increasing shift toward electric propulsion and integration of advanced safety and convenience features is accelerating the adoption of utility vehicles. Enhanced battery technology, efficient drivetrain systems, and improved cabin comfort allow vehicles to handle diverse tasks across agriculture, construction, government, and recreational applications. High-performance electric drivetrains reduce operational costs and emissions, meeting growing sustainability demands. Additionally, innovations like smart climate controls, spacious storage, and user-friendly interfaces improve usability and appeal. These technological advancements create a compelling value proposition for consumers, driving market growth and encouraging broader acceptance of modern utility vehicles worldwide.

Sept. 3, 2025 – Kia launched the EV5, a compact electric SUV built on the E-GMP platform, in South Korea, featuring an 81.4 kWh battery, advanced safety and convenience features, and plans for exports to Europe and Canada.

Utility Vehicle Market Restraints:

  • High Costs and Regulatory Hurdles Constrain Utility Vehicle Expansion

Rising production costs, especially for electric and technologically advanced utility vehicles, limit market growth by making vehicles less affordable for small-scale farmers, construction operators, and recreational users. Insufficient charging infrastructure and extended battery charging times reduce the convenience of electric models, slowing adoption. Stringent safety and emission regulations increase compliance expenses and lengthen development timelines, delaying market entry. These factors collectively restrict widespread adoption, hinder investment in new technologies, and temper the pace of market expansion, despite growing demand for versatile, durable, and efficient utility vehicles across multiple sectors.

Utility Vehicle Market Opportunities:

  • Advancements in Mobility Technology Transform Utility Vehicle Market

Rapid innovations in electrification, autonomous driving, and advanced display technologies are reshaping the utility vehicle market. Integration of smart control systems, enhanced safety features, and holographic displays improves vehicle efficiency, user experience, and operational capabilities, increasing adoption across agriculture, construction, and recreational applications. Collaboration between automotive manufacturers and technology providers accelerates innovation and supports the development of next-generation vehicles. As consumers demand versatile, high-tech, and environmentally friendly solutions, these technological advancements enable manufacturers to expand product portfolios, enter new segments, and meet evolving market requirements while enhancing competitiveness across multiple sectors.

Sept. 3, 2025 – Hyundai Mobis will participate in IAA Mobility 2025 in Munich, showcasing over 20 technologies in electrification, electronics, lighting, chassis, and safety. The company will feature Kia’s EV9 with a holographic windshield display, promote autonomous driving solutions, and engage European automakers to highlight technological competitiveness and explore collaboration opportunities.

Utility Vehicle Market Segment Highlights:

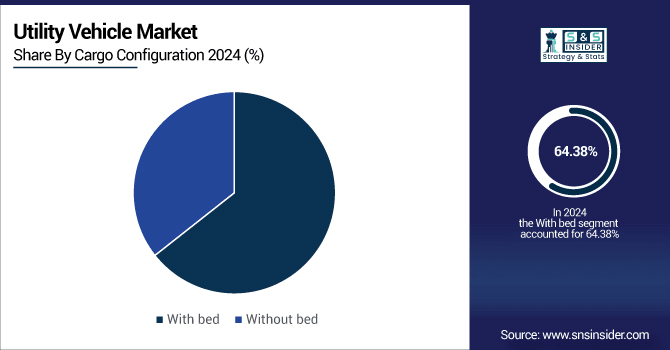
  • By Cargo Configuration: Dominant With bed (64.38%), Fastest-Growing: Without bed (CAGR-6.85%)

  • By Propulsion: Dominant (2024 & 2032): Gasoline (48.25%), Fastest-Growing: Electric (CAGR-10.74%)

  • By Application: Dominant (2024 & 2032): Construction (39.38% → 35.63%), Fastest-Growing: Entertainment (CAGR - 8.12%)

  • By Drivetrain Configuration: Dominant (2024 & 2032): 2WD (59.38% → 55.63%), Fastest-Growing: 4WD (CAGR- 6.70%)

By Cargo Configuration, With Bed Lead While Vehicles Without Bed Show Fastest Growth

In the cargo configuration segment, with-bed setups continue to lead due to their ability to handle heavy loads and support a wide range of utility applications. At the same time, without-bed configurations are showing the fastest growth, driven by increasing demand for more compact and versatile options that can navigate smaller spaces and serve both work and recreational purposes. This trend reflects a shift in preference toward flexible configurations that balance functionality and convenience across diverse operational needs.

Utility-Vehicle-Market-By-Cargo-Configuration

By Propulsion, Gasoline Remains Dominant While Electric Shows Fastest Growth

Gasoline continues to dominate the propulsion segment, reflecting its widespread use across traditional applications. Meanwhile, electric propulsion is experiencing the fastest growth, driven by increasing demand for sustainable, low-emission, and energy-efficient solutions. This shift highlights the market’s gradual transition toward cleaner and more advanced propulsion technologies.

By Application, Construction Leads While Entertainment Shows Fastest Growth

Construction remains the dominant application segment, driven by ongoing demand for heavy-duty and task-oriented solutions. In contrast, the entertainment segment is witnessing the fastest growth, fueled by increasing adoption for recreational and leisure purposes. This trend reflects a diversification of use cases and evolving consumer preferences across applications.

By Drivetrain Configuration, 2WD Remains Dominant While 4WD Shows Fastest Growth

The 2WD configuration continues to lead due to its efficiency and suitability for standard applications. Meanwhile, 4WD is experiencing the fastest growth, driven by increasing demand for enhanced traction, versatility, and performance in challenging terrains. This trend reflects evolving preferences toward more capable and adaptable drivetrain options.

Utility Vehicle Market Regional Highlights:
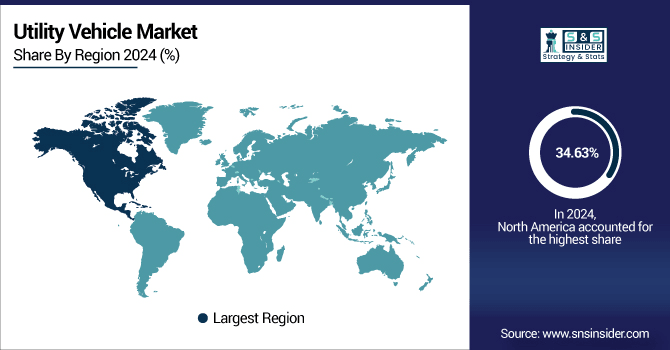
  • North America – Dominant: 34.63% in 2024 → 32.38% in 2032; CAGR 4.64%

  • Asia-Pacific – Fastest-Growing: 20.88% in 2024 → 26.13% in 2032; CAGR 8.49%

  • Europe – 24.88% in 2024 → 24.13% in 2032; CAGR 5.13%

  • South America – 9.88% in 2024 → 9.13% in 2032; CAGR 4.49%

  • Middle East & Africa – 9.75% in 2024 → 8.25% in 2032; CAGR 3.33%

Utility Vehicle Market Regional Analysis:

North America Utility Vehicle Market Insights:

North America leads the Utility Vehicle Market, driven by strong demand across agriculture, construction, and recreational sectors. Well-established infrastructure, advanced technology adoption, and supportive regulations contribute to its dominant position. Meanwhile, growing mechanization and increasing demand in other regions are reshaping the competitive landscape, highlighting evolving market dynamics.

Utility-Vehicle-Market-By-Region

Get Customized Report as Per Your Business Requirement - Enquiry Now

  • U.S. Utility Vehicle Market Insights:

The U.S. leads North America’s Utility Vehicle Market, supported by high demand across agriculture, construction, and recreational sectors, advanced infrastructure, technological adoption, and favorable regulations driving widespread use and market dominance.

Asia-Pacific Utility Vehicle Market Insights:

Asia-Pacific is the fastest-growing region in the Utility Vehicle Market, fueled by increasing mechanization in agriculture, expanding construction activities, rising infrastructure development, and growing demand for versatile, durable, and efficient utility solutions across multiple sectors.

  • China Utility Vehicle Market Insights:

China leads Asia-Pacific in Utility Vehicle adoption, driven by rapid industrialization, agricultural mechanization, infrastructure expansion, and increasing demand for versatile and efficient solutions across multiple sectors.

Europe Utility Vehicle Market Insights:

The European Utility Vehicle Market is expanding steadily, supported by infrastructure development, technological advancements, and growing adoption across agriculture, construction, and municipal applications. Increasing focus on efficiency, safety, and low-emission solutions is encouraging investment, driving consistent market demand, and promoting the adoption of advanced and versatile utility solutions across the region.

  • Germany and Norway Utility Vehicle Market Insights:

Germany leads Europe’s utility vehicle market, driven by a strong automotive industry, advanced infrastructure, high demand across agriculture and construction, and increasing adoption of sustainable and electric utility solutions.

Latin America Utility Vehicle Market Insights:

The Latin American Utility Vehicle Market is emerging, supported by growing agricultural mechanization, expanding construction activities, and increasing infrastructure development. Rising demand for versatile, durable, and cost-effective solutions is driving adoption across multiple sectors. Although growth is moderate compared to other regions, ongoing investments and modernization efforts are gradually strengthening the market and expanding its potential.

  • Brazil Utility Vehicle Market Insights:

Brazil leads Latin America’s Utility Vehicle Market, driven by strong demand in agriculture, tourism, and recreational sectors. The country’s large, urbanized population and a growing middle class contribute to its dominance. Brazil's automotive industry benefits from a robust manufacturing base, housing major automotive giants like Volkswagen and Fiat, which supports local production and drives sales.

Middle East & Africa Utility Vehicle Market Insights:

The Middle East & Africa Utility Vehicle Market is gradually expanding, driven by growing demand in agriculture, construction, and mining sectors. Infrastructure development, rising mechanization, and increasing adoption of versatile, durable solutions are supporting market growth. Although expansion is slower compared to other regions, ongoing investments and modernization efforts are steadily enhancing market potential across the region.

  • Saudi Arabia Utility Vehicle Market Insights:

Saudi Arabia leads the Middle East & Africa utility vehicle market, driven by large-scale infrastructure projects, growing adventure tourism, and expanding agricultural activities, while the UAE follows with strong recreational and construction demand.

Utility Vehicle Market Competitive Landscape:

Club Car Established in 1958, Club Car is a global leader in small-wheel, zero-emission vehicles, specializing in golf and utility vehicles. Known for innovation, performance, and safety, the company delivers advanced technology, premium design, and customizable solutions for golf courses, resorts, and commercial operators worldwide.

  • In March 2025, Club Car launched updated Tempo golf cars featuring an Automatic Park Brake with StopSmart™ Technology, redesigned dashboards, premium storage, and integrated USB/charging options, enhancing performance, safety, and on-course convenience.

The Toro Company – Established in 1914, Toro is a leading manufacturer of commercial and residential utility vehicles, turf maintenance equipment, and irrigation solutions. Renowned for innovation, durability, and performance, Toro delivers versatile, customizable vehicles and equipment that enhance productivity across sports fields, resorts, campuses, and commercial operations worldwide.

  • In January 2024, Toro showcased the Vista® Shuttle, a versatile utility vehicle offering gas or battery power, customizable capacity, HyperCell® lithium-ion batteries, ergonomic seating, and a smooth ride for sports complexes, resorts, and campuses

Utility Vehicle Market Key Players:

  • Club Car

  • Columbia Vehicle Group Inc.

  • Cushman

  • Garia

  • John Deere

  • Kubota

  • Star EV Corporation, USA

  • The Toro Company

  • Yamaha

  • Polaris Industries

  • Textron Specialized Vehicles

  • Mahindra & Mahindra

  • Arctic Cat

  • Mitsubishi Heavy Industries

  • Honda Motor Co., Ltd.

  • Suzuki Motor Corporation

  • Peugeot Motocycles

  • Bollinger Motors

  • Nikola Corporation

  • Ford Motor Company

Utility Vehicle Market Report Scope:

Report Attributes Details
Market Size in 2024 USD 1049.5 Million
Market Size by 2032 USD 1614.09 Million
CAGR CAGR of 5.53% From 2024 to 2032
Base Year 2024
Forecast Period 2025-2032
Historical Data 2021-2023
Report Scope & Coverage Market Size, Segments Analysis, Competitive Landscape, Regional Analysis, DROC & SWOT Analysis, Forecast Outlook
Key Segments • By Cargo Configuration (With Bed, Without Bed)
• By Propulsion (Gasoline, Diesel, Electric)
• By Application (Construction, Universities, Government/Municipalities, Entertainment, Hospitality, Others)
• By Drivetrain Configuration (2WD, 4WD)
Regional Analysis/Coverage North America (US, Canada), Europe (Germany, UK, France, Italy, Spain, Russia, Poland, Rest of Europe), Asia Pacific (China, India, Japan, South Korea, Australia, ASEAN Countries, Rest of Asia Pacific), Middle East & Africa (UAE, Saudi Arabia, Qatar, South Africa, Rest of Middle East & Africa), Latin America (Brazil, Argentina, Mexico, Colombia, Rest of Latin America).
Company Profiles Club Car, Columbia Vehicle Group Inc., Cushman, Garia, John Deere, Kubota, Star EV Corporation USA, The Toro Company, Yamaha, Polaris Industries, Textron Specialized Vehicles, Mahindra & Mahindra, Arctic Cat, Mitsubishi Heavy Industries, Honda Motor Co Ltd, Suzuki Motor Corporation, Peugeot Motocycles, Bollinger Motors, Nikola Corporation, Ford Motor Company

Table Of Contents

1. Introduction

1.1 Market Definition & Scope

 1.2 Research Assumptions & Abbreviations

 1.3 Research Methodology

2. Executive Summary

2.1 Market Snapshot

 2.2 Market Absolute $ Opportunity Assessment & Y-o-Y Analysis, 2021–2032

 2.3 Market Size & Forecast, By Segmentation, 2021–2032

  2.3.1 Market Size By Cargo Configuration

  2.3.2 Market Size By Propulsion

  2.3.3 Market Size  By Application

  2.3.4 Market Size By Drivetrain Configuration

 2.4 Market Share & Bps Analysis By Region, 2024

 2.5 Industry Growth Scenarios – Conservative, Likely & Optimistic

 2.6 Industry CxO’s Perspective

3. Market Overview

3.1 Market Dynamics

  3.1.1 Drivers

  3.1.2 Restraints

  3.1.3 Opportunities

  3.1.4 Key Market Trends

 3.2 Industry PESTLE Analysis

 3.3 Key Industry Forces (Porter’s) Impacting Market Growth

 3.4 Industry Supply Chain Analysis

  3.4.1 Raw Material Suppliers

  3.4.2 Manufacturers

  3.4.3 Distributors/Suppliers

  3.4.4 Customers/End-Users

 3.5 Industry Life Cycle Assessment

 3.6 Parent Market Overview

 3.7 Market Risk Assessment

4. Statistical Insights & Trends Reporting

4.1 Vehicle Performance & Efficiency Metrics

4.1.1 Average engine power (HP/kW) and torque (Nm) by vehicle type (light, medium, heavy)

4.1.2 Fuel efficiency (km/l or mpg) and emission levels (g/km CO₂)

4.1.3 Battery capacity (kWh) and driving range (km) for electric utility vehicles

4.1.4 Payload capacity (tons) and towing capability (tons) by model segment

4.2 Technology & Connectivity Metrics

4.2.1 Adoption rate of telematics, GPS, and fleet management systems (%)

4.2.2 Integration of driver assistance systems: ABS, traction control, lane assist (%)

4.2.3 Trends in connected EV charging infrastructure (%)

4.2.4 Usage of advanced materials: lightweight alloys, composites (%)

4.3 Manufacturing & Supply Chain Indicators

4.3.1 Production share by key regions and countries (%)

4.3.2 Average lead time for vehicle delivery (weeks)

4.3.3 Cost distribution: engine, chassis, battery, electronics, assembly (%)

4.3.4 Average selling price trends (USD/unit) by vehicle type and powertrain

5. Utility Vehicle Market Segmental Analysis & Forecast, By Cargo Configuration, 2021 – 2032, Value (USD Million)

5.1 Introduction

 5.2 With bed

  5.2.1 Key Trends

  5.2.2 Market Size & Forecast, 2021 – 2032

 5.3 Without bed

6. Utility Vehicle Market Segmental Analysis & Forecast, By Propulsion, 2021 – 2032, Value (USD Million)

    6.1 Introduction

 6.2 Gasoline

  6.2.1 Key Trends

  6.2.2 Market Size & Forecast, 2021 – 2032

 6.3 Diesel

 6.4 Electric

7. Utility Vehicle Market Segmental Analysis & Forecast,  By Application, 2021 – 2032, Value (USD Million)

    7.1 Introduction

 7.2 Construction

  7.2.1 Key Trends

  7.2.2 Market Size & Forecast, 2021 – 2032

 7.3 Universities

 7.4 Government/Municipalities

    7.5 Entertainment

    7.6 Hospitality

   7.7 Others

8. Utility Vehicle Market Segmental Analysis & Forecast, By Drivetrain Configuration, 2021 – 2032, Value (USD Million)

    8.1 Introduction

 8.2 2WD

  8.2.1 Key Trends

  8.2.2 Market Size & Forecast, 2021 – 2032

 8.3 4WD

9. Utility Vehicle Market Segmental Analysis & Forecast By Region, 2021 – 2025, Value (USD Million)

9.1 Introduction

9.2 North America

 9.2.1 Key Trends

 9.2.2 Utility Vehicle Market Size & Forecast, By Cargo Configuration, 2021 – 2032

 9.2.3 Utility Vehicle Market Size & Forecast, By Propulsion, 2021 – 2032

 9.2.4 Utility Vehicle Market Size & Forecast,  By Application, 2021 – 2032

 9.2.5 Utility Vehicle Market Size & Forecast, By Drivetrain Configuration, 2021 – 2032

 9.2.6 Utility Vehicle Market Size & Forecast, By Country, 2021 – 2032

  9.2.6.1 USA

   9.2.6.1.1 Utility Vehicle Market Size & Forecast, By Cargo Configuration, 2021 – 2032

   9.2.6.1.2 Utility Vehicle Market Size & Forecast, By Propulsion, 2021 – 2032

   9.2.6.1.3 Utility Vehicle Market Size & Forecast,  By Application, 2021 – 2032

   9.2.6.1.4 Utility Vehicle Market Size & Forecast, By Drivetrain Configuration, 2021 – 2032

  9.2.6.2 Canada

   9.2.6.2.1 Utility Vehicle Market Size & Forecast, By Cargo Configuration, 2021 – 2032

   9.2.6.2.2 Utility Vehicle Market Size & Forecast, By Propulsion, 2021 – 2032

   9.2.6.2.3 Utility Vehicle Market Size & Forecast,  By Application, 2021 – 2032

   9.2.6.2.4 Utility Vehicle Market Size & Forecast, By Drivetrain Configuration, 2021 – 2032

9.3 Europe

 9.3.1 Key Trends

 9.3.2 Utility Vehicle Market Size & Forecast, By Cargo Configuration, 2021 – 2032

 9.3.3 Utility Vehicle Market Size & Forecast, By Propulsion, 2021 – 2032

 9.3.4 Utility Vehicle Market Size & Forecast,  By Application, 2021 – 2032

 9.3.5 Utility Vehicle Market Size & Forecast, By Drivetrain Configuration, 2021 – 2032

 9.3.6 Utility Vehicle Market Size & Forecast, By Country, 2021 – 2032

  9.3.6.1 Germany

   9.3.6.1.1 Utility Vehicle Market Size & Forecast, By Cargo Configuration, 2021 – 2032

   9.3.6.1.2 Utility Vehicle Market Size & Forecast, By Propulsion, 2021 – 2032

   9.3.6.1.3 Utility Vehicle Market Size & Forecast,  By Application, 2021 – 2032

   9.3.6.1.4 Utility Vehicle Market Size & Forecast, By Drivetrain Configuration, 2021 – 2032

  9.3.6.2 UK

   9.3.6.2.1 Utility Vehicle Market Size & Forecast, By Cargo Configuration, 2021 – 2032

   9.3.6.2.2 Utility Vehicle Market Size & Forecast, By Propulsion, 2021 – 2032

   9.3.6.2.3 Utility Vehicle Market Size & Forecast,  By Application, 2021 – 2032

   9.3.6.2.4 Utility Vehicle Market Size & Forecast, By Drivetrain Configuration, 2021 – 2032

  9.3.6.3 France

   9.3.6.3.1 Utility Vehicle Market Size & Forecast, By Cargo Configuration, 2021 – 2032

   9.3.6.3.2 Utility Vehicle Market Size & Forecast, By Propulsion, 2021 – 2032

   9.3.6.3.3 Utility Vehicle Market Size & Forecast,  By Application, 2021 – 2032

   9.3.6.3.4 Utility Vehicle Market Size & Forecast, By Drivetrain Configuration, 2021 – 2032

  9.3.6.4 Italy

   9.3.6.4.1 Utility Vehicle Market Size & Forecast, By Cargo Configuration, 2021 – 2032

   9.3.6.4.2 Utility Vehicle Market Size & Forecast, By Propulsion, 2021 – 2032

   9.3.6.4.3 Utility Vehicle Market Size & Forecast,  By Application, 2021 – 2032

   9.3.6.4.4 Utility Vehicle Market Size & Forecast, By Drivetrain Configuration, 2021 – 2032

  9.3.6.5 Spain

   9.3.6.5.1 Utility Vehicle Market Size & Forecast, By Cargo Configuration, 2021 – 2032

   9.3.6.5.2 Utility Vehicle Market Size & Forecast, By Propulsion, 2021 – 2032

   9.3.6.5.3 Utility Vehicle Market Size & Forecast,  By Application, 2021 – 2032

   9.3.6.5.4 Utility Vehicle Market Size & Forecast, By Drivetrain Configuration, 2021 – 2032

  9.3.6.6 Russia

   9.3.6.6.1 Utility Vehicle Market Size & Forecast, By Cargo Configuration, 2021 – 2032

   9.3.6.6.2 Utility Vehicle Market Size & Forecast, By Propulsion, 2021 – 2032

   9.3.6.6.3 Utility Vehicle Market Size & Forecast,  By Application, 2021 – 2032

   9.3.6.6.4 Utility Vehicle Market Size & Forecast, By Drivetrain Configuration, 2021 – 2032

  9.3.6.7 Poland

   9.3.6.7.1 Utility Vehicle Market Size & Forecast, By Cargo Configuration, 2021 – 2032

   9.3.6.7.2 Utility Vehicle Market Size & Forecast, By Propulsion, 2021 – 2032

   9.3.6.7.3 Utility Vehicle Market Size & Forecast,  By Application, 2021 – 2032

   9.3.6.7.4 Utility Vehicle Market Size & Forecast, By Drivetrain Configuration, 2021 – 2032

  9.3.6.8 Rest of Europe

   9.3.6.8.1 Utility Vehicle Market Size & Forecast, By Cargo Configuration, 2021 – 2032

   9.3.6.8.2 Utility Vehicle Market Size & Forecast, By Propulsion, 2021 – 2032

   9.3.6.8.3 Utility Vehicle Market Size & Forecast,  By Application, 2021 – 2032

   9.3.6.8.4 Utility Vehicle Market Size & Forecast, By Drivetrain Configuration, 2021 – 2032   

9.4 Asia-Pacific

 9.4.1 Key Trends

 9.4.2 Utility Vehicle Market Size & Forecast, By Cargo Configuration, 2021 – 2032

 9.4.3 Utility Vehicle Market Size & Forecast, By Propulsion, 2021 – 2032

 9.4.4 Utility Vehicle Market Size & Forecast,  By Application, 2021 – 2032

 9.4.5 Utility Vehicle Market Size & Forecast, By Drivetrain Configuration, 2021 – 2032

 9.4.6 Utility Vehicle Market Size & Forecast, By Country, 2021 – 2032

  9.4.6.1 China

   9.4.6.1.1 Utility Vehicle Market Size & Forecast, By Cargo Configuration, 2021 – 2032

   9.4.6.1.2 Utility Vehicle Market Size & Forecast, By Propulsion, 2021 – 2032

   9.4.6.1.3 Utility Vehicle Market Size & Forecast,  By Application, 2021 – 2032

   9.4.6.1.4 Utility Vehicle Market Size & Forecast, By Drivetrain Configuration, 2021 – 2032

  9.4.6.2 India

   9.4.6.2.1 Utility Vehicle Market Size & Forecast, By Cargo Configuration, 2021 – 2032

   9.4.6.2.2 Utility Vehicle Market Size & Forecast, By Propulsion, 2021 – 2032

   9.4.6.2.3 Utility Vehicle Market Size & Forecast,  By Application, 2021 – 2032

   9.4.6.2.4 Utility Vehicle Market Size & Forecast, By Drivetrain Configuration, 2021 – 2032

  9.4.6.3 Japan

   9.4.6.3.1 Utility Vehicle Market Size & Forecast, By Cargo Configuration, 2021 – 2032

   9.4.6.3.2 Utility Vehicle Market Size & Forecast, By Propulsion, 2021 – 2032

   9.4.6.3.3 Utility Vehicle Market Size & Forecast,  By Application, 2021 – 2032

   9.4.6.3.4 Utility Vehicle Market Size & Forecast, By Drivetrain Configuration, 2021 – 2032

  9.4.6.4 South Korea

   9.4.6.4.1 Utility Vehicle Market Size & Forecast, By Cargo Configuration, 2021 – 2032

   9.4.6.4.2 Utility Vehicle Market Size & Forecast, By Propulsion, 2021 – 2032

   9.4.6.4.3 Utility Vehicle Market Size & Forecast,  By Application, 2021 – 2032

   9.4.6.4.4 Utility Vehicle Market Size & Forecast, By Drivetrain Configuration, 2021 – 2032

  9.4.6.5 Australia

   9.4.6.5.1 Utility Vehicle Market Size & Forecast, By Cargo Configuration, 2021 – 2032

   9.4.6.5.2 Utility Vehicle Market Size & Forecast, By Propulsion, 2021 – 2032

   9.4.6.5.3 Utility Vehicle Market Size & Forecast,  By Application, 2021 – 2032

   9.4.6.5.4 Utility Vehicle Market Size & Forecast, By Drivetrain Configuration, 2021 – 2032

  9.4.6.6 ASEAN Countries

   9.4.6.6.1 Utility Vehicle Market Size & Forecast, By Cargo Configuration, 2021 – 2032

   9.4.6.6.2 Utility Vehicle Market Size & Forecast, By Propulsion, 2021 – 2032

   9.4.6.6.3 Utility Vehicle Market Size & Forecast,  By Application, 2021 – 2032

   9.4.6.6.4 Utility Vehicle Market Size & Forecast, By Drivetrain Configuration, 2021 – 2032

  9.4.6.7 Rest of Asia-Pacific

   9.4.6.7.1 Utility Vehicle Market Size & Forecast, By Cargo Configuration, 2021 – 2032

   9.4.6.7.2 Utility Vehicle Market Size & Forecast, By Propulsion, 2021 – 2032

   9.4.6.7.3 Utility Vehicle Market Size & Forecast,  By Application, 2021 – 2032

   9.4.6.7.4 Utility Vehicle Market Size & Forecast, By Drivetrain Configuration, 2021 – 2032

9.5 Latin America

 9.5.1 Key Trends

 9.5.2 Utility Vehicle Market Size & Forecast, By Cargo Configuration, 2021 – 2032

 9.5.3 Utility Vehicle Market Size & Forecast, By Propulsion, 2021 – 2032

 9.5.4 Utility Vehicle Market Size & Forecast,  By Application, 2021 – 2032

 9.5.5 Utility Vehicle Market Size & Forecast, By Drivetrain Configuration, 2021 – 2032

 9.5.6 Utility Vehicle Market Size & Forecast, By Country, 2021 – 2032

  9.5.6.1 Brazil

   9.5.6.1.1 Utility Vehicle Market Size & Forecast, By Cargo Configuration, 2021 – 2032

   9.5.6.1.2 Utility Vehicle Market Size & Forecast, By Propulsion, 2021 – 2032

   9.5.6.1.3 Utility Vehicle Market Size & Forecast,  By Application, 2021 – 2032

   9.5.6.1.4 Utility Vehicle Market Size & Forecast, By Drivetrain Configuration, 2021 – 2032

  9.5.6.2 Argentina

   9.5.6.2.1 Utility Vehicle Market Size & Forecast, By Cargo Configuration, 2021 – 2032

   9.5.6.2.2 Utility Vehicle Market Size & Forecast, By Propulsion, 2021 – 2032

   9.5.6.2.3 Utility Vehicle Market Size & Forecast,  By Application, 2021 – 2032

   9.5.6.2.4 Utility Vehicle Market Size & Forecast, By Drivetrain Configuration, 2021 – 2032

  9.5.6.3 Mexico

   9.5.6.3.1 Utility Vehicle Market Size & Forecast, By Cargo Configuration, 2021 – 2032

   9.5.6.3.2 Utility Vehicle Market Size & Forecast, By Propulsion, 2021 – 2032

   9.5.6.3.3 Utility Vehicle Market Size & Forecast,  By Application, 2021 – 2032

   9.5.6.3.4 Utility Vehicle Market Size & Forecast, By Drivetrain Configuration, 2021 – 2032

  9.5.6.4 Colombia

   9.5.6.4.1 Utility Vehicle Market Size & Forecast, By Cargo Configuration, 2021 – 2032

   9.5.6.4.2 Utility Vehicle Market Size & Forecast, By Propulsion, 2021 – 2032

   9.5.6.4.3 Utility Vehicle Market Size & Forecast,  By Application, 2021 – 2032

   9.5.6.4.4 Utility Vehicle Market Size & Forecast, By Drivetrain Configuration, 2021 – 2032

  9.5.6.5 Rest of Latin America

   9.5.6.5.1 Utility Vehicle Market Size & Forecast, By Cargo Configuration, 2021 – 2032

   9.5.6.5.2 Utility Vehicle Market Size & Forecast, By Propulsion, 2021 – 2032

   9.5.6.5.3 Utility Vehicle Market Size & Forecast,  By Application, 2021 – 2032

   9.5.6.5.4 Utility Vehicle Market Size & Forecast, By Drivetrain Configuration, 2021 – 2032

9.6 Middle East & Africa

 9.6.1 Key Trends

 9.6.2 Utility Vehicle Market Size & Forecast, By Cargo Configuration, 2021 – 2032

 9.6.3 Utility Vehicle Market Size & Forecast, By Propulsion, 2021 – 2032

 9.6.4 Utility Vehicle Market Size & Forecast,  By Application, 2021 – 2032

 9.6.5 Utility Vehicle Market Size & Forecast, By Drivetrain Configuration, 2021 – 2032

 9.6.6 Utility Vehicle Market Size & Forecast, By Country, 2021 – 2032

  9.6.6.1 UAE

   9.6.6.1.1 Utility Vehicle Market Size & Forecast, By Cargo Configuration, 2021 – 2032

   9.6.6.1.2 Utility Vehicle Market Size & Forecast, By Propulsion, 2021 – 2032

   9.6.6.1.3 Utility Vehicle Market Size & Forecast,  By Application, 2021 – 2032

   9.6.6.1.4 Utility Vehicle Market Size & Forecast, By Drivetrain Configuration, 2021 – 2032

  9.6.6.2 Saudi Arabia

   9.6.6.2.1 Utility Vehicle Market Size & Forecast, By Cargo Configuration, 2021 – 2032

   9.6.6.2.2 Utility Vehicle Market Size & Forecast, By Propulsion, 2021 – 2032

   9.6.6.2.3 Utility Vehicle Market Size & Forecast,  By Application, 2021 – 2032

   9.6.6.2.4 Utility Vehicle Market Size & Forecast, By Drivetrain Configuration, 2021 – 2032

  9.6.6.3 Qatar

   9.6.6.3.1 Utility Vehicle Market Size & Forecast, By Cargo Configuration, 2021 – 2032

   9.6.6.3.2 Utility Vehicle Market Size & Forecast, By Propulsion, 2021 – 2032

   9.6.6.3.3 Utility Vehicle Market Size & Forecast,  By Application, 2021 – 2032

   9.6.6.3.4 Utility Vehicle Market Size & Forecast, By Drivetrain Configuration, 2021 – 2032

  9.6.6.4 Egypt

   9.6.6.4.1 Utility Vehicle Market Size & Forecast, By Cargo Configuration, 2021 – 2032

   9.6.6.4.2 Utility Vehicle Market Size & Forecast, By Propulsion, 2021 – 2032

   9.6.6.4.3 Utility Vehicle Market Size & Forecast,  By Application, 2021 – 2032

   9.6.6.4.4 Utility Vehicle Market Size & Forecast, By Drivetrain Configuration, 2021 – 2032

  9.6.6.5 South Africa

   9.6.6.5.1 Utility Vehicle Market Size & Forecast, By Cargo Configuration, 2021 – 2032

   9.6.6.5.2 Utility Vehicle Market Size & Forecast, By Propulsion, 2021 – 2032

   9.6.6.5.3 Utility Vehicle Market Size & Forecast,  By Application, 2021 – 2032

   9.6.6.5.4 Utility Vehicle Market Size & Forecast, By Drivetrain Configuration, 2021 – 2032

  9.6.6.6 Rest of Middle East & Africa

   9.6.6.6.1 Utility Vehicle Market Size & Forecast, By Cargo Configuration, 2021 – 2032

   9.6.6.6.2 Utility Vehicle Market Size & Forecast, By Propulsion, 2021 – 2032

   9.6.6.6.3 Utility Vehicle Market Size & Forecast,  By Application, 2021 – 2032

   9.6.6.6.4 Utility Vehicle Market Size & Forecast, By Drivetrain Configuration, 2021 – 2032

10. Competitive Landscape

 10.1 Key Players' Positioning

 10.2 Competitive Developments

  10.2.1 Key Strategies Adopted (%), By Key Players, 2024

  10.2.2 Year-Wise Strategies & Development, 2021 – 2025

  10.2.3 Number Of Strategies Adopted By Key Players, 2024

 10.3 Market Share Analysis, 2024

 10.4 Product/Service & Application Benchmarking

  10.4.1 Product/Service Specifications & Features By Key Players

  10.4.2 Product/Service Heatmap By Key Players

  10.4.3 Application Heatmap By Key Players

 10.5 Industry Start-Up & Innovation Landscape

10.6 Key Company Profiles

 10.6.1 Club Car

  10.6.1.1 Company Overview & Snapshot

  10.6.1.2 Product/Service Portfolio

  10.6.1.3 Key Company Financials

  10.6.1.4 SWOT Analysis

 10.6.2 Columbia Vehicle Group Inc.

 10.6.3 Cushman

 10.6.4 Garia 

     10.6.5 John Deere

 10.6.6 Kubota

 10.6.7 Star EV Corporation, USA

 10.6.8 The Toro Company

 10.6.9 Yamaha

 10.6.10 Polaris Industries

 10.6.11 Textron Specialized Vehicles

 10.6.12 Mahindra & Mahindra

 10.6.13 Arctic Cat

 10.6.14 Mitsubishi Heavy Industries

 10.6.15 Suzuki Motor Corporation

 10.6.16 Peugeot Motocycles

 10.6.17 Bollinger Motors

 10.6.18 Nikola Corporation

 10.6.19 Ford Motor Company

 10.6.20 Honda Motor Co., Ltd.

11. Analyst Recommendations

 11.1 SNS Insider Opportunity Map

 11.2 Industry Low-Hanging Fruit Assessment

 11.3 Market Entry & Growth Strategy

 11.4 Analyst Viewpoint & Suggestions on Market Growth

12. Assumptions

13. Disclaimer

14. Appendix

 14.1 List Of Tables

 14.2 List Of Figures

Key Segments:

By Cargo Configuration

  • With bed

  • Without bed

By Propulsion

  • Gasoline

  • Diesel

  • Electric

By Application

  • Construction

  • Universities

  • Government/Municipalities

  • Entertainment

  • Hospitality

  • Others

By Drivetrain Configuration

  • 2WD

  • 4WD

Request for Segment Customization as per your Business Requirement: Segment Customization Request

Regional Coverage: 

North America

  • US

  • Canada

Europe

  • Germany

  • UK

  • France

  • Italy

  • Spain

  • Russia

  • Poland

  • Rest of Europe

Asia Pacific

  • China

  • India

  • Japan

  • South Korea

  • Australia

  • ASEAN Countries

  • Rest of Asia Pacific

Middle East & Africa

  • UAE

  • Saudi Arabia

  • Qatar

  • South Africa

  • Rest of Middle East & Africa

Latin America

  • Brazil

  • Argentina

  • Mexico

  • Colombia

  • Rest of Latin America

Request for Country Level Research Report: Country Level Customization Request

Available Customization 

With the given market data, SNS Insider offers customization as per the company’s specific needs. The following customization options are available for the report: 

  • Detailed Volume Analysis 

  • Criss-Cross segment analysis (e.g. Product X Application) 

  • Competitive Product Benchmarking 

  • Geographic Analysis 

  • Additional countries in any of the regions 

  • Customized Data Representation 

  • Detailed analysis and profiling of additional market players


An accurate research report requires proper strategizing as well as implementation. There are multiple factors involved in the completion of good and accurate research report and selecting the best methodology to compete the research is the toughest part. Since the research reports we provide play a crucial role in any company’s decision-making process, therefore we at SNS Insider always believe that we should choose the best method which gives us results closer to reality. This allows us to reach at a stage wherein we can provide our clients best and accurate investment to output ratio.

Each report that we prepare takes a timeframe of 350-400 business hours for production. Starting from the selection of titles through a couple of in-depth brain storming session to the final QC process before uploading our titles on our website we dedicate around 350 working hours. The titles are selected based on their current market cap and the foreseen CAGR and growth.


The 5 steps process:

Step 1: Secondary Research:

Secondary Research or Desk Research is as the name suggests is a research process wherein, we collect data through the readily available information. In this process we use various paid and unpaid databases which our team has access to and gather data through the same. This includes examining of listed companies’ annual reports, Journals, SEC filling etc. Apart from this our team has access to various associations across the globe across different industries. Lastly, we have exchange relationships with various university as well as individual libraries.

Secondary Research

Step 2: Primary Research

When we talk about primary research, it is a type of study in which the researchers collect relevant data samples directly, rather than relying on previously collected data.  This type of research is focused on gaining content specific facts that can be sued to solve specific problems. Since the collected data is fresh and first hand therefore it makes the study more accurate and genuine.

We at SNS Insider have divided Primary Research into 2 parts.

Part 1 wherein we interview the KOLs of major players as well as the upcoming ones across various geographic regions. This allows us to have their view over the market scenario and acts as an important tool to come closer to the accurate market numbers. As many as 45 paid and unpaid primary interviews are taken from both the demand and supply side of the industry to make sure we land at an accurate judgement and analysis of the market.

This step involves the triangulation of data wherein our team analyses the interview transcripts, online survey responses and observation of on filed participants. The below mentioned chart should give a better understanding of the part 1 of the primary interview.

Primary Research

Part 2: In this part of primary research the data collected via secondary research and the part 1 of the primary research is validated with the interviews from individual consultants and subject matter experts.

Consultants are those set of people who have at least 12 years of experience and expertise within the industry whereas Subject Matter Experts are those with at least 15 years of experience behind their back within the same space. The data with the help of two main processes i.e., FGDs (Focused Group Discussions) and IDs (Individual Discussions). This gives us a 3rd party nonbiased primary view of the market scenario making it a more dependable one while collation of the data pointers.

Step 3: Data Bank Validation

Once all the information is collected via primary and secondary sources, we run that information for data validation. At our intelligence centre our research heads track a lot of information related to the market which includes the quarterly reports, the daily stock prices, and other relevant information. Our data bank server gets updated every fortnight and that is how the information which we collected using our primary and secondary information is revalidated in real time.

Data Bank Validation

Step 4: QA/QC Process

After all the data collection and validation our team does a final level of quality check and quality assurance to get rid of any unwanted or undesired mistakes. This might include but not limited to getting rid of the any typos, duplication of numbers or missing of any important information. The people involved in this process include technical content writers, research heads and graphics people. Once this process is completed the title gets uploader on our platform for our clients to read it.

Step 5: Final QC/QA Process:

This is the last process and comes when the client has ordered the study. In this process a final QA/QC is done before the study is emailed to the client. Since we believe in giving our clients a good experience of our research studies, therefore, to make sure that we do not lack at our end in any way humanly possible we do a final round of quality check and then dispatch the study to the client.