Van Conversion Service Market Report Scope & Overview:

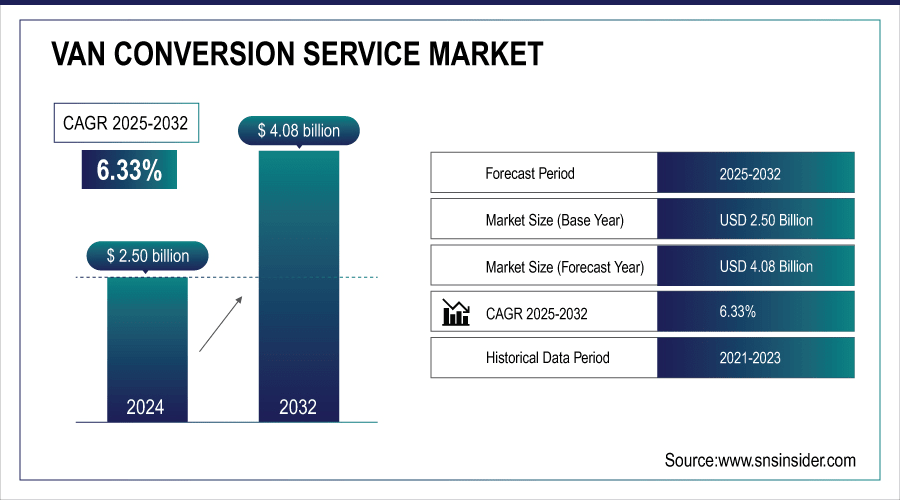
The Van Conversion Service Market Size was valued at USD 2.50 billion in 2024 and is expected to reach USD 4.08 billion by 2032 and grow at a CAGR of 6.33% over the forecast period 2025-2032.

The Van Conversion Service Market is experiencing strong growth, driven by rising demand for personalized and multifunctional vehicles. Increasing interest in mobile lifestyles, remote work, and sustainable travel is fueling the popularity of van conversions. Services include transforming standard vans into campervans, mobile offices, food trucks, and specialized transport vehicles. Advancements in design, technology, and materials enable enhanced customization, comfort, and functionality, meeting diverse consumer preferences.

Key Van Conversion Service Market Trends:

  • Growing preference for mobile lifestyles and remote work is increasing demand for campervans and mobile offices.

  • Rising interest in eco-friendly and sustainable travel is driving adoption of electric and hybrid van conversions.

  • Advances in smart home and IoT technologies are enhancing in-van comfort, automation, and connectivity.

  • Customization and modular designs are becoming popular, allowing users to tailor vans for leisure, business, or specialized transport.

  • Expansion of commercial applications such as food trucks and mobile clinics is broadening market opportunities.

  • Use of lightweight and durable materials is improving fuel efficiency, safety, and functionality.

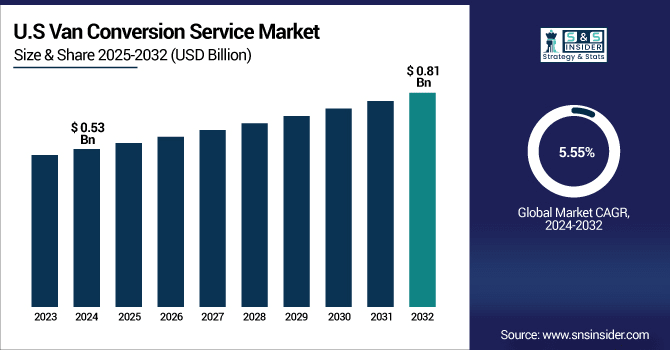
The U.S. Van Conversion Service Market size was USD 0.53 billion in 2024 and is expected to reach USD 0.81 billion by 2032, growing at a CAGR of 5.55% over the forecast period of 2024–2032. The growth is driven by increasing demand for personalized and multifunctional vehicles, rising adoption of mobile lifestyles, and the growing popularity of remote work. Advancements in smart designs, eco-friendly materials, and technology-enabled conversions are enabling enhanced customization, comfort, and functionality for campervans, mobile offices, food trucks, and other specialized vehicles.

The U.S. Market is witnessing notable trends driven by changing consumer lifestyles and technological advancements. Increasing interest in mobile living and remote work is fueling demand for campervans and mobile offices. Sustainability concerns are encouraging the adoption of electric and hybrid conversions. Smart technologies and IoT integration are enhancing comfort, automation, and connectivity inside vans. Customization and modular designs allow consumers to tailor vehicles for leisure, business, or specialized applications like food trucks and mobile clinics. Lightweight, durable materials improve fuel efficiency and functionality, while innovative design solutions continue to expand market opportunities and consumer appeal.

Van Conversion Service Market Growth Drivers:

  • Growing Consumer Preference for Mobile Lifestyles and Remote Work Drives U.S. Van Conversion Service Market Expansion

The market is driven by increasing interest in mobile living and flexible work arrangements, prompting consumers to invest in customized vans. This cause, rising demand for multifunctional vehicles like campervans, mobile offices, and food trucks, effects innovation in design, modular layouts, and technology integration. As a result, providers can offer enhanced comfort, connectivity, and usability to meet diverse consumer needs. Consumers increasingly view van conversions as viable solutions for travel, work, and lifestyle flexibility.

In June 2024, a U.S. van conversion company launched fully equipped mobile office vans with ergonomic workspaces and connectivity features, reflecting the growing influence of remote work trends.

Van Conversion Service Market Growth Restraints:

  • High Costs of Customized Van Conversions Limit U.S. Van Conversion Service Market Adoption

The market faces restraints due to high costs associated with fully customized conversions, including materials, labor, and technology integration. This cause, elevated investment requirements, effects delayed or abandoned purchase decisions among middle-income consumers, limiting overall market penetration. Companies must balance cost with personalization and functionality, which can restrict rapid adoption. High upfront costs also push consumers toward standard or partially customized solutions, slowing the rate of premium service growth.

In mid-2023, a survey found that nearly 40% of U.S. van buyers delayed purchases due to the high costs of fully customized conversions, demonstrating affordability as a key barrier.

Van Conversion Service Market Growth Opportunities:

  • Advancements in Electric and Hybrid Van Conversions Open U.S. Market Growth Opportunities

The increasing emphasis on sustainability and eco-friendly travel is driving opportunities in electric and hybrid van conversions. This cause, growing consumer preference for green solutions, effects expansion in product offerings, attracting environmentally conscious buyers, and differentiating providers in a competitive market. Incorporating clean energy technologies like solar power and electric drivetrains enhances functionality without compromising comfort, appealing to a new customer segment. Providers can capitalize on these trends to boost sales and brand value.

In March 2025, a leading U.S. van conversion company introduced a hybrid campervan with solar-powered interiors and electric drivetrains, highlighting innovation and environmental responsiveness.

Key Van Conversion Service Market Segment Highlights:

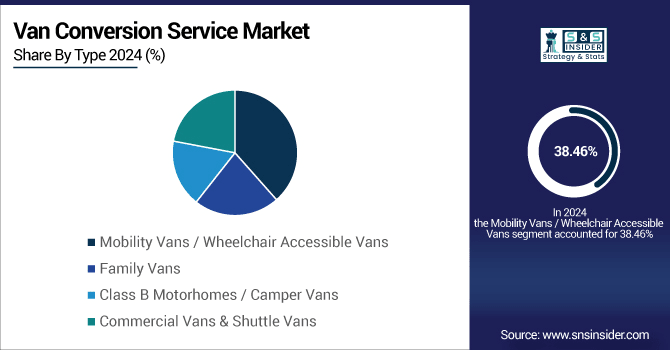
  • By Type, Mobility Vans / Wheelchair Accessible Vans led with ~39% share in 2024; Class B Motorhomes / Camper Vans fastest growing (CAGR 8.17%).

  • By Conversion Type, Mobility & Accessibility Conversions led with ~37% share in 2024; Camper / RV Conversions fastest growing (CAGR 8.63%).

  • By Application, Commercial / Business Use led with ~36% share in 2024; Recreational / Travel & Tourism fastest growing (CAGR 9.26%).

  • By Service Type, Custom Design & Build led with ~39% share in 2024; Retrofitting & Upgrades fastest growing (CAGR 8.25%).

Key Van Conversion Service Market Segment Analysis:

  • By Type, Mobility Vans / Wheelchair Accessible Vans Lead Market While Class B Motorhomes / Camper Vans Register Fastest Growth

The Mobility Vans / Wheelchair Accessible Vans segment dominates the global Van Conversion Service Market, driven by growing awareness of mobility needs, aging populations, and government incentives promoting accessible transportation. Advanced lifts, ramps, and ergonomic interiors improve comfort, safety, and usability, attracting both individual and commercial buyers worldwide. The Class B Motorhomes / Camper Vans segment is expected to grow fastest, fueled by the rising popularity of mobile lifestyles and recreational travel. Compact layouts, smart storage, and integrated entertainment systems enhance multifunctionality, expanding adoption of van conversion services globally.

  • By Conversion Type, Mobility & Accessibility Conversions Lead Market While Camper / RV Conversions Register Fastest Growth

Mobility & Accessibility Conversions dominate revenue due to increasing demand for inclusive transportation solutions for elderly and disabled populations, as well as institutional requirements. Advanced adaptive interiors, lifts, and ramps allow providers to meet diverse global needs, strengthening market adoption. Camper / RV Conversions are growing fastest as consumers seek flexible recreational and travel solutions. Modular interiors, solar integration, and smart home features enhance personalization, boosting demand for lifestyle- and leisure-focused van conversions across regions.

  • By Application, Commercial / Business Use Leads Market While Recreational / Travel & Tourism Registers Fastest Growth

Commercial / Business Use dominates the market, driven by food trucks, mobile clinics, and logistics vans requiring ergonomic layouts, technology integration, and specialized features. This demand strengthens market revenue as businesses prioritize operational efficiency and functionality. Recreational / Travel & Tourism is the fastest-growing segment, fueled by the global rise of van life, adventure tourism, and flexible vacation trends. Innovations such as foldable furniture, smart appliances, and energy-efficient systems expand market opportunities in lifestyle and tourism sectors.

  • By Service Type, Custom Design & Build Leads Market While Retrofitting & Upgrades Registers Fastest Growth

Custom Design & Build dominates the market, driven by consumer preference for fully personalized van interiors, layouts, and technology integration. High customization enhances comfort, functionality, and aesthetic appeal, strengthening the global Van Conversion Service Market. Retrofitting & Upgrades is growing fastest as owners modernize existing vans with smart systems, eco-friendly materials, and modular solutions. Service providers offering flexible retrofit packages attract repeat and commercial clients, increasing revenue and expanding the scope of van conversion offerings worldwide.

Van Conversion Service Market Regional Analysis:
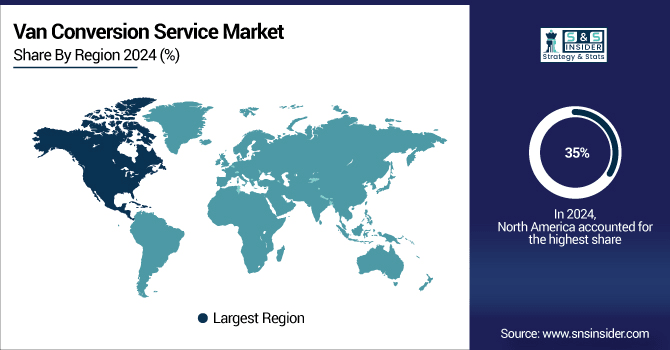
North America Van Conversion Service Market Insights

In 2024, North America dominates the Van Conversion Service Market with an estimated share of ~35%, driven by rising consumer demand for mobile lifestyles, recreational travel, and commercial applications. The region benefits from advanced infrastructure, widespread adoption of customized van solutions, and technological innovations such as smart interiors, modular layouts, and eco-friendly features, supporting extensive deployment of van conversion services that enhance comfort, functionality, and business efficiency.

United States Leads Van Conversion Service Market in North America

The U.S. dominates with the largest market share, supported by strong recreational vehicle culture, growing remote work trends, and increasing commercial applications like food trucks and mobile offices. Continuous innovation in modular design, smart technologies, and sustainable materials improves vehicle functionality and consumer appeal, reinforcing the U.S. leadership position within North America.

Asia Pacific Van Conversion Service Market Insights

Asia Pacific is the fastest-growing region with an estimated CAGR of ~9.44% in 2024, driven by rising disposable incomes, expanding tourism, and growing demand for personalized and multifunctional vehicles. Increasing adoption of camper vans, mobile offices, and hybrid mobility solutions accelerates market growth, as consumers seek flexibility, mobility, and innovative lifestyle options.

Japan Leads Van Conversion Service Market Growth in Asia Pacific

Japan dominates the regional market due to high urbanization, strong technological adoption, and growing interest in compact camper vans and mobility solutions. Providers are introducing smart, space-efficient interiors, energy-efficient systems, and modular layouts, enhancing customization and functionality. These innovations position Japan as a key driver of market growth in Asia Pacific.

Europe Van Conversion Service Market Insights

In 2024, Europe holds a significant share in the Van Conversion Service Market, driven by rising adventure tourism, eco-conscious travel, and strong demand for recreational and commercial van solutions. Continuous product development, adoption of electric and hybrid conversions, and modular interior innovations support steady regional growth.

Germany Dominates Europe’s Van Conversion Service Market

Germany leads the European market due to high recreational vehicle penetration, environmental regulations favoring sustainable mobility solutions, and strong consumer interest in camper vans and commercial vans. Integration of smart interiors, modular layouts, and energy-efficient technologies enhances vehicle functionality and appeal, reinforcing Germany’s leadership position within Europe.

Latin America and Middle East & Africa Van Conversion Service Market Insights

The Van Conversion Service Market in Latin America and MEA is witnessing steady growth, driven by increasing commercial van use, tourism, and growing interest in mobility and recreational solutions. Expansion of customized van services, eco-friendly conversions, and technology-enabled interiors supports market adoption and functional versatility across these regions.

Regional Leaders in Latin America and MEA

Brazil leads Latin America due to growing tourism, commercial fleet expansion, and lifestyle vehicle adoption. In MEA, the UAE dominates, supported by smart city initiatives, luxury recreational travel trends, and increasing demand for multifunctional and technologically integrated van conversions.

Competitive Landscape for the Van Conversion Service Market:

Rollx Vans is a U.S.-based leader in wheelchair-accessible van conversions, specializing in Chrysler, Dodge, Honda, and Toyota models. With over four decades of experience, the company designs, engineers, and installs advanced mobility features such as side-entry and rear-entry ramps, electronic kneeling systems, and removable seating. Rollx Vans operates direct-to-consumer, managing sales, service, and nationwide delivery from its Minnesota headquarters. Its role in the van conversion service market is vital, as it provides customized solutions that transform traditional minivans into reliable, safe, and user-friendly transportation for individuals and families with mobility challenges, ensuring freedom and accessibility.

  • Rollx Vans previewed its 2024 wheelchair-accessible van lineup, highlighting new Chrysler Pacifica and Voyager models equipped with advanced features such as electronic kneeling systems, quick-release seats, and robust warranty coverage on conversions.

MobilityWorks is the largest U.S. retailer and converter of wheelchair-accessible vehicles, operating through more than 90 locations nationwide. The company specializes in selling and converting vans with side-entry and rear-entry accessibility systems, hand controls, transfer seating, and adaptive driving aids. Partnering with manufacturers like Driverge Vehicle Innovations, MobilityWorks develops exclusive conversion models such as the Toyota Sienna Hybrid FlexMaxx. Its role in the van conversion service market is significant, providing both retail and fleet solutions for personal, commercial, and institutional use. By offering conversion design, installation, and aftersales support, MobilityWorks enhances mobility and independence for thousands of clients.

  • In July 2025, MobilityWorks rolled out an exclusive Toyota Sienna Hybrid FlexMaxx Rear-Entry conversion. Designed by Driverge Vehicle Innovations, it combines Toyota’s hybrid reliability (~36 mpg) with MobilityWorks’ accessible, flexible interior configuration, supporting both wheelchair users and ambulatory passengers.

Vantage Mobility International (VMI) is a leading U.S.-based manufacturer of wheelchair-accessible vans, with a strong focus on innovation in conversion technology. The company produces advanced in-floor and fold-out ramp systems, side-entry and rear-entry conversions, and integrates adaptive seating and driving equipment. VMI partners with leading automakers like Toyota, Honda, and Chrysler to deliver highly engineered, reliable conversion solutions. Its role in the van conversion service market is central, as it combines engineering expertise with user-focused design, ensuring safety and comfort. By expanding through dealer networks and strategic partnerships, VMI strengthens access to customized mobility vans across North America.

  • In 2025, VMI announced an exclusive agreement with Mobility Networks Group, under which Mobility Networks’ accessibility products (e.g., lifts, ramps, seats) will now be integrated into VMI vehicles in the U.S., Canada, and Mexico. This enhances VMI’s conversion offerings across its nationwide dealer network.

BraunAbility, founded in 1972, is the global leader in mobility transportation solutions, with a legacy rooted in wheelchair-accessible van conversions. The company designs and manufactures a wide range of conversions, including side-entry and rear-entry ramps, wheelchair lifts, and adaptive driving systems, often built on platforms from Toyota, Honda, Chrysler, and Dodge. Operating globally, BraunAbility serves both individual and commercial markets, supported by an extensive dealer network. Its role in the van conversion service market is unmatched, setting industry standards for safety, reliability, and inclusivity. Through constant innovation, BraunAbility continues to expand access to mobility and independence worldwide.

  • In June 2025, BraunAbility was honored by Forbes in its first-ever Accessibility 100 list, celebrating top global innovators in accessibility across industries. The recognition reflects BraunAbility's longstanding leadership in mobility solutions, including wheelchair-accessible vehicles and conversion services.

Van Conversion Service Market Key Players:

Some of the Van Conversion Service Market Companies

  • BraunAbility

  • Vantage Mobility International (VMI)

  • MobilityWorks

  • Rollx Vans

  • AMS Vans

  • AdaptaVan

  • Winnebago

  • Sportsmobile

  • Outside Van

  • Ququq

  • Tommy Camper Vans

  • Van Specialties

  • Vansmith

  • Contravans

  • GTRV

  • VanCraft

  • Momentum Vans

  • Rossmönster Vans

  • Vancini Conversions

  • Campo Vans

Van Conversion Service Market Report Scope:

Report Attributes Details
Market Size in 2024 USD 2.50 Billion 
Market Size by 2032 USD 4.08 Billion 
CAGR CAGR of 6.33% From 2025 to 2032
Base Year 2024
Forecast Period 2025-2032
Historical Data 2021-2023
Report Scope & Coverage Market Size, Segments Analysis, Competitive Landscape, Regional Analysis, DROC & SWOT Analysis, Forecast Outlook
Key Segments • By Type (Mobility Vans / Wheelchair Accessible Vans, Family Vans, Class B Motorhomes / Camper Vans, Commercial Vans & Shuttle Vans)
• By Conversion Type (Interior Luxury Conversions, Mobility & Accessibility Conversions, Camper / RV Conversions, Utility & Cargo Conversions)
• By Application (Household / Personal Use, Commercial / Business Use, Recreational / Travel & Tourism, Institutional)
• By Service Type (Custom Design & Build, Standard Package Conversions, Retrofitting & Upgrades, Maintenance & Aftermarket Services)
Regional Analysis/Coverage North America (US, Canada), Europe (Germany, UK, France, Italy, Spain, Russia, Poland, Rest of Europe), Asia Pacific (China, India, Japan, South Korea, Australia, ASEAN Countries, Rest of Asia Pacific), Middle East & Africa (UAE, Saudi Arabia, Qatar, South Africa, Rest of Middle East & Africa), Latin America (Brazil, Argentina, Mexico, Colombia, Rest of Latin America).
Company Profiles BraunAbility, Vantage Mobility International (VMI), MobilityWorks, Rollx Vans, AMS Vans, AdaptaVan, Winnebago, Sportsmobile, Outside Van, Ququq, Tommy Camper Vans, Van Specialties, Vansmith, Contravans, GTRV, VanCraft, Momentum Vans, Rossmönster Vans, Vancini Conversions, Campo Vans, and Others.

Table Of Contents

1. Introduction

1.1 Market Definition & Scope

 1.2 Research Assumptions & Abbreviations

 1.3 Research Methodology

2. Executive Summary

2.1 Market Snapshot

 2.2 Market Absolute $ Opportunity Assessment & Y-o-Y Analysis, 2021–2032

 2.3 Market Size & Forecast, By Segmentation, 2021–2032

  2.3.1 Market Size by Type

  2.3.2 Market Size by Application

         2.3.2 Market Size by Conversion Type

         2.3.2 Market Size by Service Type

 2.4 Market Share & BPS Analysis By Region, 2024

 2.5 Industry Growth Scenarios – Conservative, Likely & Optimistic

 2.6 Industry CxO’s Perspective

3. Market Overview

3.1 Market Dynamics

  3.1.1 Drivers

  3.1.2 Restraints

  3.1.3 Opportunities

  3.1.4 Key Market Trends

 3.2 Industry PESTLE Analysis

 3.3 Key Industry Forces (Porter’s) Impacting Market Growth

 3.4 Industry Supply Chain Analysis

  3.4.1 Raw Material Suppliers

  3.4.2 Manufacturers

  3.4.3 Distributors/Suppliers

  3.4.4 Customers/End-Users

 3.5 Industry Life Cycle Assessment

 3.6 Parent Market Overview

 3.7 Market Risk Assessment

4. Statistical Insights & Trends Reporting

     4.1 Consumer Preference & Adoption Trends

4.1.1 Percentage of customers opting for campervan vs. commercial van conversions

4.1.2 Average age group distribution of van conversion service users

4.1.3 Growth rate of first-time buyers vs. repeat customers

     4.2 Customization & Design Statistics

4.2.1 Average spend per conversion project by van type (luxury, utility, adventure)

4.2.2 Share (%) of conversions including smart technologies (solar, IoT, advanced infotainment)

4.2.3 Proportion of eco-friendly conversions (recycled materials, electric retrofits)

     4.3 Operational & Service Efficiency Metrics

4.3.1 Average turnaround time (weeks/months) for full van conversion services

4.3.2 Percentage of conversions done by independent workshops vs. specialized firms

4.3.3 Average warranty period (years) offered by service providers

     4.4 Financial & Ownership Trends

4.4.1 Financing adoption rate (%) for conversion services

4.4.2 Percentage of converted vans used for personal vs. rental/commercial purposes

4.4.3 Average resale value increase (%) of vans after conversion

5. Van Conversion Service Market Segmental Analysis & Forecast, By Type, 2021 – 2032, Value (USD Billion)

5.1 Introduction

 5.2 Mobility Vans / Wheelchair Accessible Vans

  5.2.1 Key Trends

  5.2.2 Market Size & Forecast, 2021 – 2032

 5.3 Family Vans

  5.3.1 Key Trends

  5.3.2 Market Size & Forecast, 2021 – 2032

 5.4 Class B Motorhomes / Camper Vans

  5.4.1 Key Trends

  5.4.2 Market Size & Forecast, 2021 – 2032

     5.5 Commercial Vans & Shuttle Vans

  5.5.1 Key Trends

  5.5.2 Market Size & Forecast, 2021 – 2032

6. Van Conversion Service Market Segmental Analysis & Forecast, By Application, 2021 – 2032, Value (USD Billion)

    6.1 Introduction

 6.2 Household / Personal Use

  6.2.1 Key Trends

  6.2.2 Market Size & Forecast, 2021 – 2032

 6.3 Commercial / Business Use

  6.3.1 Key Trends

  6.3.2 Market Size & Forecast, 2021 – 2032

 6.4 Recreational / Travel & Tourism

  6.4.1 Key Trends

  6.4.2 Market Size & Forecast, 2021 – 2032

 6.5 Institutional

  6.5.1 Key Trends

  6.5.2 Market Size & Forecast, 2021 – 2032

7. Van Conversion Service Market Segmental Analysis & Forecast, By Service Type, 2021 – 2032, Value (USD Billion)

    7.1 Introduction

 7.2 Custom Design & Build

  7.2.1 Key Trends

  7.2.2 Market Size & Forecast, 2021 – 2032

 7.3 Standard Package Conversions

  7.3.1 Key Trends

  7.3.2 Market Size & Forecast, 2021 – 2032

 7.4 Retrofitting & Upgrades

  7.4.1 Key Trends

  7.4.2 Market Size & Forecast, 2021 – 2032

 7.5 Maintenance & Aftermarket Services

  7.5.1 Key Trends

  7.5.2 Market Size & Forecast, 2021 – 2032

8. Van Conversion Service Market Segmental Analysis & Forecast, By Conversion Type, 2021 – 2032, Value (USD Billion)

    8.1 Introduction

 8.2 Interior Luxury Conversions

  8.2.1 Key Trends

  8.2.2 Market Size & Forecast, 2021 – 2032

 8.3 Mobility & Accessibility Conversions

  8.3.1 Key Trends

  8.3.2 Market Size & Forecast, 2021 – 2032

 8.4 Camper / RV Conversions

  8.4.1 Key Trends

  8.4.2 Market Size & Forecast, 2021 – 2032

 8.5 Utility & Cargo Conversions

  8.5.1 Key Trends

  8.5.2 Market Size & Forecast, 2021 – 2032

9. Van Conversion Service Market Segmental Analysis & Forecast By Region, 2021 – 2025, Value (USD Billion)

9.1 Introduction

9.2 North America

 9.2.1 Key Trends

 9.2.2 Van Conversion Service Market Size & Forecast, By Type, 2021 – 2032

 9.2.3 Van Conversion Service Market Size & Forecast, By Application, 2021 – 2032

 9.2.4 Van Conversion Service Market Size & Forecast, By Service Type, 2021 – 2032

 9.2.5 Van Conversion Service Market Size & Forecast, By Conversion Type, 2021 – 2032

 9.2.6 Van Conversion Service Market Size & Forecast, By Country, 2021 – 2032

  9.2.6.1 USA

   9.2.6.1.1 Van Conversion Service Market Size & Forecast, By Type, 2021 – 2032

   9.2.6.1.2 Van Conversion Service Market Size & Forecast, By Application, 2021 – 2032

   9.2.6.1.3 Van Conversion Service Market Size & Forecast, By Service Type, 2021 – 2032

   9.2.6.1.4 Van Conversion Service Market Size & Forecast, By Conversion Type, 2021 – 2032

  9.2.6.2 Canada

   9.2.6.2.1 Van Conversion Service Market Size & Forecast, By Type, 2021 – 2032

   9.2.6.2.2 Van Conversion Service Market Size & Forecast, By Application, 2021 – 2032

   9.2.6.2.3 Van Conversion Service Market Size & Forecast, By Service Type, 2021 – 2032

   9.2.6.2.4 Van Conversion Service Market Size & Forecast, By Conversion Type, 2021 – 2032

9.3 Europe

 9.3.1 Key Trends

 9.3.2 Van Conversion Service Market Size & Forecast, By Type, 2021 – 2032

 9.3.3 Van Conversion Service Market Size & Forecast, By Application, 2021 – 2032

 9.3.4 Van Conversion Service Market Size & Forecast, By Service Type, 2021 – 2032

 9.3.5 Van Conversion Service Market Size & Forecast, By Conversion Type, 2021 – 2032

 9.3.6 Van Conversion Service Market Size & Forecast, By Country, 2021 – 2032

  9.3.6.1 Germany

   9.3.6.1.1 Van Conversion Service Market Size & Forecast, By Type, 2021 – 2032

   9.3.6.1.2 Van Conversion Service Market Size & Forecast, By Application, 2021 – 2032

   9.3.6.1.3 Van Conversion Service Market Size & Forecast, By Service Type, 2021 – 2032

   9.3.6.1.4 Van Conversion Service Market Size & Forecast, By Conversion Type, 2021 – 2032

  9.3.6.2 UK

   9.3.6.2.1 Van Conversion Service Market Size & Forecast, By Type, 2021 – 2032

   9.3.6.2.2 Van Conversion Service Market Size & Forecast, By Application, 2021 – 2032

   9.3.6.2.3 Van Conversion Service Market Size & Forecast, By Service Type, 2021 – 2032

   9.3.6.2.4 Van Conversion Service Market Size & Forecast, By Conversion Type, 2021 – 2032

  9.3.6.3 France

   9.3.6.3.1 Van Conversion Service Market Size & Forecast, By Type, 2021 – 2032

   9.3.6.3.2 Van Conversion Service Market Size & Forecast, By Application, 2021 – 2032

   9.3.6.3.3 Van Conversion Service Market Size & Forecast, By Service Type, 2021 – 2032

   9.3.6.3.4 Van Conversion Service Market Size & Forecast, By Conversion Type, 2021 – 2032

  9.3.6.4 Italy

   9.3.6.4.1 Van Conversion Service Market Size & Forecast, By Type, 2021 – 2032

   9.3.6.4.2 Van Conversion Service Market Size & Forecast, By Application, 2021 – 2032

   9.3.6.4.3 Van Conversion Service Market Size & Forecast, By Service Type, 2021 – 2032

   9.3.6.4.4 Van Conversion Service Market Size & Forecast, By Conversion Type, 2021 – 2032

  9.3.6.5 Spain

   9.3.6.5.1 Van Conversion Service Market Size & Forecast, By Type, 2021 – 2032

   9.3.6.5.2 Van Conversion Service Market Size & Forecast, By Application, 2021 – 2032

   9.3.6.5.3 Van Conversion Service Market Size & Forecast, By Service Type, 2021 – 2032

   9.3.6.5.4 Van Conversion Service Market Size & Forecast, By Conversion Type, 2021 – 2032

  9.3.6.6 Russia

   9.3.6.6.1 Van Conversion Service Market Size & Forecast, By Type, 2021 – 2032

   9.3.6.6.2 Van Conversion Service Market Size & Forecast, By Application, 2021 – 2032

   9.3.6.6.3 Van Conversion Service Market Size & Forecast, By Service Type, 2021 – 2032

   9.3.6.6.4 Van Conversion Service Market Size & Forecast, By Conversion Type, 2021 – 2032

  9.3.6.7 Poland

   9.3.6.7.1 Van Conversion Service Market Size & Forecast, By Type, 2021 – 2032

   9.3.6.7.2 Van Conversion Service Market Size & Forecast, By Application, 2021 – 2032

   9.3.6.7.3 Van Conversion Service Market Size & Forecast, By Service Type, 2021 – 2032

   9.3.6.7.4 Van Conversion Service Market Size & Forecast, By Conversion Type, 2021 – 2032

  9.3.6.8 Rest of Europe

   9.3.6.8.1 Van Conversion Service Market Size & Forecast, By Type, 2021 – 2032

   9.3.6.8.2 Van Conversion Service Market Size & Forecast, By Application, 2021 – 2032

   9.3.6.8.3 Van Conversion Service Market Size & Forecast, By Service Type, 2021 – 2032

   9.3.6.8.4 Van Conversion Service Market Size & Forecast, By Conversion Type, 2021 – 2032   

9.4 Asia-Pacific

 9.4.1 Key Trends

 9.4.2 Van Conversion Service Market Size & Forecast, By Type, 2021 – 2032

 9.4.3 Van Conversion Service Market Size & Forecast, By Application, 2021 – 2032

 9.4.4 Van Conversion Service Market Size & Forecast, By Service Type, 2021 – 2032

 9.4.5 Van Conversion Service Market Size & Forecast, By Conversion Type, 2021 – 2032

 9.4.6 Van Conversion Service Market Size & Forecast, By Country, 2021 – 2032

  9.4.6.1 China

   9.4.6.1.1 Van Conversion Service Market Size & Forecast, By Type, 2021 – 2032

   9.4.6.1.2 Van Conversion Service Market Size & Forecast, By Application, 2021 – 2032

   9.4.6.1.3 Van Conversion Service Market Size & Forecast, By Service Type, 2021 – 2032

   9.4.6.1.4 Van Conversion Service Market Size & Forecast, By Conversion Type, 2021 – 2032

  9.4.6.2 India

   9.4.6.2.1 Van Conversion Service Market Size & Forecast, By Type, 2021 – 2032

   9.4.6.2.2 Van Conversion Service Market Size & Forecast, By Application, 2021 – 2032

   9.4.6.2.3 Van Conversion Service Market Size & Forecast, By Service Type, 2021 – 2032

   9.4.6.2.4 Van Conversion Service Market Size & Forecast, By Conversion Type, 2021 – 2032

  9.4.6.3 Japan

   9.4.6.3.1 Van Conversion Service Market Size & Forecast, By Type, 2021 – 2032

   9.4.6.3.2 Van Conversion Service Market Size & Forecast, By Application, 2021 – 2032

   9.4.6.3.3 Van Conversion Service Market Size & Forecast, By Service Type, 2021 – 2032

   9.4.6.3.4 Van Conversion Service Market Size & Forecast, By Conversion Type, 2021 – 2032

  9.4.6.4 South Korea

   9.4.6.4.1 Van Conversion Service Market Size & Forecast, By Type, 2021 – 2032

   9.4.6.4.2 Van Conversion Service Market Size & Forecast, By Application, 2021 – 2032

   9.4.6.4.3 Van Conversion Service Market Size & Forecast, By Service Type, 2021 – 2032

   9.4.6.4.4 Van Conversion Service Market Size & Forecast, By Conversion Type, 2021 – 2032

  9.4.6.5 Australia

   9.4.6.5.1 Van Conversion Service Market Size & Forecast, By Type, 2021 – 2032

   9.4.6.5.2 Van Conversion Service Market Size & Forecast, By Application, 2021 – 2032

   9.4.6.5.3 Van Conversion Service Market Size & Forecast, By Service Type, 2021 – 2032

   9.4.6.5.4 Van Conversion Service Market Size & Forecast, By Conversion Type, 2021 – 2032

  9.4.6.6 ASEAN Countries

   9.4.6.6.1 Van Conversion Service Market Size & Forecast, By Type, 2021 – 2032

   9.4.6.6.2 Van Conversion Service Market Size & Forecast, By Application, 2021 – 2032

   9.4.6.6.3 Van Conversion Service Market Size & Forecast, By Service Type, 2021 – 2032

   9.4.6.6.4 Van Conversion Service Market Size & Forecast, By Conversion Type, 2021 – 2032

  9.4.6.7 Rest of Asia-Pacific

   9.4.6.7.1 Van Conversion Service Market Size & Forecast, By Type, 2021 – 2032

   9.4.6.7.2 Van Conversion Service Market Size & Forecast, By Application, 2021 – 2032

   9.4.6.7.3 Van Conversion Service Market Size & Forecast, By Service Type, 2021 – 2032

   9.4.6.7.4 Van Conversion Service Market Size & Forecast, By Conversion Type, 2021 – 2032

9.5 Latin America

 9.5.1 Key Trends

 9.5.2 Van Conversion Service Market Size & Forecast, By Type, 2021 – 2032

 9.5.3 Van Conversion Service Market Size & Forecast, By Application, 2021 – 2032

 9.5.4 Van Conversion Service Market Size & Forecast, By Service Type, 2021 – 2032

 9.5.5 Van Conversion Service Market Size & Forecast, By Conversion Type, 2021 – 2032

 9.5.6 Van Conversion Service Market Size & Forecast, By Country, 2021 – 2032

  9.5.6.1 Brazil

   9.5.6.1.1 Van Conversion Service Market Size & Forecast, By Type, 2021 – 2032

   9.5.6.1.2 Van Conversion Service Market Size & Forecast, By Application, 2021 – 2032

   9.5.6.1.3 Van Conversion Service Market Size & Forecast, By Service Type, 2021 – 2032

   9.5.6.1.4 Van Conversion Service Market Size & Forecast, By Conversion Type, 2021 – 2032

  9.5.6.2 Argentina

   9.5.6.2.1 Van Conversion Service Market Size & Forecast, By Type, 2021 – 2032

   9.5.6.2.2 Van Conversion Service Market Size & Forecast, By Application, 2021 – 2032

   9.5.6.2.3 Van Conversion Service Market Size & Forecast, By Service Type, 2021 – 2032

   9.5.6.2.4 Van Conversion Service Market Size & Forecast, By Conversion Type, 2021 – 2032

  9.5.6.3 Mexico

   9.5.6.3.1 Van Conversion Service Market Size & Forecast, By Type, 2021 – 2032

   9.5.6.3.2 Van Conversion Service Market Size & Forecast, By Application, 2021 – 2032

   9.5.6.3.3 Van Conversion Service Market Size & Forecast, By Service Type, 2021 – 2032

   9.5.6.3.4 Van Conversion Service Market Size & Forecast, By Conversion Type, 2021 – 2032

  9.5.6.4 Colombia

   9.5.6.4.1 Van Conversion Service Market Size & Forecast, By Type, 2021 – 2032

   9.5.6.4.2 Van Conversion Service Market Size & Forecast, By Application, 2021 – 2032

   9.5.6.4.3 Van Conversion Service Market Size & Forecast, By Service Type, 2021 – 2032

   9.5.6.4.4 Van Conversion Service Market Size & Forecast, By Conversion Type, 2021 – 2032

  9.5.6.5 Rest of Latin America

   9.5.6.5.1 Van Conversion Service Market Size & Forecast, By Type, 2021 – 2032

   9.5.6.5.2 Van Conversion Service Market Size & Forecast, By Application, 2021 – 2032

   9.5.6.5.3 Van Conversion Service Market Size & Forecast, By Service Type, 2021 – 2032

   9.5.6.5.4 Van Conversion Service Market Size & Forecast, By Conversion Type, 2021 – 2032

9.6 Middle East & Africa

 9.6.1 Key Trends

 9.6.2 Van Conversion Service Market Size & Forecast, By Type, 2021 – 2032

 9.6.3 Van Conversion Service Market Size & Forecast, By Application, 2021 – 2032

 9.6.4 Van Conversion Service Market Size & Forecast, By Service Type, 2021 – 2032

 9.6.5 Van Conversion Service Market Size & Forecast, By Conversion Type, 2021 – 2032

 9.6.6 Van Conversion Service Market Size & Forecast, By Country, 2021 – 2032

  9.6.6.1 UAE

   9.6.6.1.1 Van Conversion Service Market Size & Forecast, By Type, 2021 – 2032

   9.6.6.1.2 Van Conversion Service Market Size & Forecast, By Application, 2021 – 2032

   9.6.6.1.3 Van Conversion Service Market Size & Forecast, By Service Type, 2021 – 2032

   9.6.6.1.4 Van Conversion Service Market Size & Forecast, By Conversion Type, 2021 – 2032

  9.6.6.2 Saudi Arabia

   9.6.6.2.1 Van Conversion Service Market Size & Forecast, By Type, 2021 – 2032

   9.6.6.2.2 Van Conversion Service Market Size & Forecast, By Application, 2021 – 2032

   9.6.6.2.3 Van Conversion Service Market Size & Forecast, By Service Type, 2021 – 2032

   9.6.6.2.4 Van Conversion Service Market Size & Forecast, By Conversion Type, 2021 – 2032

  9.6.6.3 Qatar

   9.6.6.3.1 Van Conversion Service Market Size & Forecast, By Type, 2021 – 2032

   9.6.6.3.2 Van Conversion Service Market Size & Forecast, By Application, 2021 – 2032

   9.6.6.3.3 Van Conversion Service Market Size & Forecast, By Service Type, 2021 – 2032

   9.6.6.3.4 Van Conversion Service Market Size & Forecast, By Conversion Type, 2021 – 2032

  9.6.6.4 Egypt

   9.6.6.4.1 Van Conversion Service Market Size & Forecast, By Type, 2021 – 2032

   9.6.6.4.2 Van Conversion Service Market Size & Forecast, By Application, 2021 – 2032

   9.6.6.4.3 Van Conversion Service Market Size & Forecast, By Service Type, 2021 – 2032

   9.6.6.4.4 Van Conversion Service Market Size & Forecast, By Conversion Type, 2021 – 2032

  9.6.6.5 South Africa

   9.6.6.5.1 Van Conversion Service Market Size & Forecast, By Type, 2021 – 2032

   9.6.6.5.2 Van Conversion Service Market Size & Forecast, By Application, 2021 – 2032

   9.6.6.5.3 Van Conversion Service Market Size & Forecast, By Service Type, 2021 – 2032

   9.6.6.5.4 Van Conversion Service Market Size & Forecast, By Conversion Type, 2021 – 2032

  9.6.6.6 Rest of Middle East & Africa

   9.6.6.6.1 Van Conversion Service Market Size & Forecast, By Type, 2021 – 2032

   9.6.6.6.2 Van Conversion Service Market Size & Forecast, By Application, 2021 – 2032

   9.6.6.6.3 Van Conversion Service Market Size & Forecast, By Service Type, 2021 – 2032

   9.6.6.6.4 Van Conversion Service Market Size & Forecast, By Conversion Type, 2021 – 2032

10. Competitive Landscape

 10.1 Key Players' Positioning

 10.2 Competitive Developments

  10.2.1 Key Strategies Adopted (%), By Key Players, 2024

  10.2.2 Year-Wise Strategies & Development, 2021 – 2025

  10.2.3 Number of Strategies Adopted by Key Players, 2024

 10.3 Market Share Analysis, 2024

 10.4 Product/Service & Application Benchmarking

  10.4.1 Product/Service Specifications & Features By Key Players

  10.4.2 Product/Service Heatmap By Key Players

  10.4.3 Application Heatmap By Key Players

 10.5 Industry Start-Up & Innovation Landscape

 10.6 Key Company Profiles

10.6 Key Company Profiles

 10.6.1 BraunAbility

  10.6.1.1 Company Overview & Snapshot

  10.6.1.2 Product/Service Portfolio

  10.6.1.3 Key Company Financials

  10.6.1.4 SWOT Analysis

 10.6.2 Vantage Mobility International (VMI)

  10.6.2.1 Company Overview & Snapshot

  10.6.2.2 Product/Service Portfolio

  10.6.2.3 Key Company Financials

  10.6.2.4 SWOT Analysis

 10.6.3 MobilityWorks

  10.6.3.1 Company Overview & Snapshot

  10.6.3.2 Product/Service Portfolio

  10.6.3.3 Key Company Financials

  10.6.3.4 SWOT Analysis

 10.6.4 Rollx Vans

  10.6.4.1 Company Overview & Snapshot

  10.6.4.2 Product/Service Portfolio

  10.6.4.3 Key Company Financials

  10.6.4.4 SWOT Analysis

 10.6.5 AMS Vans

  10.6.5.1 Company Overview & Snapshot

  10.6.5.2 Product/Service Portfolio

  10.6.5.3 Key Company Financials

  10.6.5.4 SWOT Analysis

 10.6.6 AdaptaVan

  10.6.6.1 Company Overview & Snapshot

  10.6.6.2 Product/Service Portfolio

  10.6.6.3 Key Company Financials

  10.6.6.4 SWOT Analysis

 10.6.7 Winnebago

  10.6.7.1 Company Overview & Snapshot

  10.6.7.2 Product/Service Portfolio

  10.6.7.3 Key Company Financials

  10.6.7.4 SWOT Analysis

 10.6.8 Sportsmobile

  10.6.8.1 Company Overview & Snapshot

  10.6.8.2 Product/Service Portfolio

  10.6.8.3 Key Company Financials

  10.6.8.4 SWOT Analysis

 10.6.9 Outside Van

  10.6.9.1 Company Overview & Snapshot

  10.6.9.2 Product/Service Portfolio

  10.6.9.3 Key Company Financials

  10.6.9.4 SWOT Analysis

 10.6.10 Ququq

  10.6.10.1 Company Overview & Snapshot

  10.6.10.2 Product/Service Portfolio

  10.6.10.3 Key Company Financials

  10.6.10.4 SWOT Analysis

 10.6.11 Tommy Camper Vans

  10.6.11.1 Company Overview & Snapshot

  10.6.11.2 Product/Service Portfolio

  10.6.11.3 Key Company Financials

  10.6.11.4 SWOT Analysis

 10.6.12 Van Specialties

  10.6.12.1 Company Overview & Snapshot

  10.6.12.2 Product/Service Portfolio

  10.6.12.3 Key Company Financials

  10.6.12.4 SWOT Analysis

 10.6.13 Vansmith

  10.6.13.1 Company Overview & Snapshot

  10.6.13.2 Product/Service Portfolio

  10.6.13.3 Key Company Financials

  10.6.13.4 SWOT Analysis

 10.6.14 Contravans

  10.6.14.1 Company Overview & Snapshot

  10.6.14.2 Product/Service Portfolio

  10.6.14.3 Key Company Financials

  10.6.14.4 SWOT Analysis

 10.6.15 GTRV

  10.6.15.1 Company Overview & Snapshot

  10.6.15.2 Product/Service Portfolio

  10.6.15.3 Key Company Financials

  10.6.15.4 SWOT Analysis

 10.6.16 VanCraft

  10.6.16.1 Company Overview & Snapshot

  10.6.16.2 Product/Service Portfolio

  10.6.16.3 Key Company Financials

  10.6.16.4 SWOT Analysis

 10.6.17 Momentum Vans

  10.6.17.1 Company Overview & Snapshot

  10.6.17.2 Product/Service Portfolio

  10.6.17.3 Key Company Financials

  10.6.17.4 SWOT Analysis

 10.6.18 Rossmönster Vans

  10.6.18.1 Company Overview & Snapshot

  10.6.18.2 Product/Service Portfolio

  10.6.18.3 Key Company Financials

  10.6.18.4 SWOT Analysis

 10.6.19 Vancini Conversions

  10.6.19.1 Company Overview & Snapshot

  10.6.19.2 Product/Service Portfolio

  10.6.19.3 Key Company Financials

  10.6.19.4 SWOT Analysis

 10.6.20 Campo Vans

  10.6.20.1 Company Overview & Snapshot

  10.6.20.2 Product/Service Portfolio

  10.6.20.3 Key Company Financials

  10.6.20.4 SWOT Analysis

11. Analyst Recommendations

 11.1 SNS Insider Opportunity Map

 11.2 Industry Low-Hanging Fruit Assessment

 11.3 Market Entry & Growth Strategy

 11.4 Analyst Viewpoint & Suggestions On Market Growth

12. Assumptions

13. Disclaimer

14. Appendix

 14.1 List Of Tables

 14.2 List Of Figures

Key Segments: 

By Type

  • Mobility Vans / Wheelchair Accessible Vans

  • Family Vans

  • Class B Motorhomes / Camper Vans

  • Commercial Vans & Shuttle Vans

By Conversion Type

  • Interior Luxury Conversions

  • Mobility & Accessibility Conversions

  • Camper / RV Conversions

  • Utility & Cargo Conversions

By Application

  • Household / Personal Use

  • Commercial / Business Use

  • Recreational / Travel & Tourism

  • Institutional

By Service Type

  • Custom Design & Build

  • Standard Package Conversions

  • Retrofitting & Upgrades

  • Maintenance & Aftermarket Services

Request for Segment Customization as per your Business Requirement: Segment Customization Request

Regional Coverage: 

North America

  • US

  • Canada

Europe

  • Germany

  • France

  • UK

  • Italy

  • Spain

  • Poland

  • Russia

  • Rest of Europe

Asia Pacific

  • China

  • India

  • Japan

  • South Korea

  • Australia

  • ASEAN Countries

  • Rest of Asia Pacific

Middle East & Africa

  • UAE

  • Saudi Arabia

  • Qatar

  • South Africa

  • Rest of Middle East & Africa

Latin America

  • Brazil

  • Argentina

  • Mexico

  • Colombia

  • Rest of Latin America

Request for Country Level Research Report: Country Level Customization Request

Available Customization 

With the given market data, SNS Insider offers customization as per the company’s specific needs. The following customization options are available for the report: 

  • Detailed Volume Analysis 

  • Criss-Cross segment analysis (e.g. Product X Application) 

  • Competitive Product Benchmarking 

  • Geographic Analysis 

  • Additional countries in any of the regions 

  • Customized Data Representation 

  • Detailed analysis and profiling of additional market players

An accurate research report requires proper strategizing as well as implementation. There are multiple factors involved in the completion of good and accurate research report and selecting the best methodology to compete the research is the toughest part. Since the research reports we provide play a crucial role in any company’s decision-making process, therefore we at SNS Insider always believe that we should choose the best method which gives us results closer to reality. This allows us to reach at a stage wherein we can provide our clients best and accurate investment to output ratio.

Each report that we prepare takes a timeframe of 350-400 business hours for production. Starting from the selection of titles through a couple of in-depth brain storming session to the final QC process before uploading our titles on our website we dedicate around 350 working hours. The titles are selected based on their current market cap and the foreseen CAGR and growth.


The 5 steps process:

Step 1: Secondary Research:

Secondary Research or Desk Research is as the name suggests is a research process wherein, we collect data through the readily available information. In this process we use various paid and unpaid databases which our team has access to and gather data through the same. This includes examining of listed companies’ annual reports, Journals, SEC filling etc. Apart from this our team has access to various associations across the globe across different industries. Lastly, we have exchange relationships with various university as well as individual libraries.

Secondary Research

Step 2: Primary Research

When we talk about primary research, it is a type of study in which the researchers collect relevant data samples directly, rather than relying on previously collected data.  This type of research is focused on gaining content specific facts that can be sued to solve specific problems. Since the collected data is fresh and first hand therefore it makes the study more accurate and genuine.

We at SNS Insider have divided Primary Research into 2 parts.

Part 1 wherein we interview the KOLs of major players as well as the upcoming ones across various geographic regions. This allows us to have their view over the market scenario and acts as an important tool to come closer to the accurate market numbers. As many as 45 paid and unpaid primary interviews are taken from both the demand and supply side of the industry to make sure we land at an accurate judgement and analysis of the market.

This step involves the triangulation of data wherein our team analyses the interview transcripts, online survey responses and observation of on filed participants. The below mentioned chart should give a better understanding of the part 1 of the primary interview.

Primary Research

Part 2: In this part of primary research the data collected via secondary research and the part 1 of the primary research is validated with the interviews from individual consultants and subject matter experts.

Consultants are those set of people who have at least 12 years of experience and expertise within the industry whereas Subject Matter Experts are those with at least 15 years of experience behind their back within the same space. The data with the help of two main processes i.e., FGDs (Focused Group Discussions) and IDs (Individual Discussions). This gives us a 3rd party nonbiased primary view of the market scenario making it a more dependable one while collation of the data pointers.

Step 3: Data Bank Validation

Once all the information is collected via primary and secondary sources, we run that information for data validation. At our intelligence centre our research heads track a lot of information related to the market which includes the quarterly reports, the daily stock prices, and other relevant information. Our data bank server gets updated every fortnight and that is how the information which we collected using our primary and secondary information is revalidated in real time.

Data Bank Validation

Step 4: QA/QC Process

After all the data collection and validation our team does a final level of quality check and quality assurance to get rid of any unwanted or undesired mistakes. This might include but not limited to getting rid of the any typos, duplication of numbers or missing of any important information. The people involved in this process include technical content writers, research heads and graphics people. Once this process is completed the title gets uploader on our platform for our clients to read it.

Step 5: Final QC/QA Process:

This is the last process and comes when the client has ordered the study. In this process a final QA/QC is done before the study is emailed to the client. Since we believe in giving our clients a good experience of our research studies, therefore, to make sure that we do not lack at our end in any way humanly possible we do a final round of quality check and then dispatch the study to the client.