Variable Data Printing Market Report Scope & Oveview:
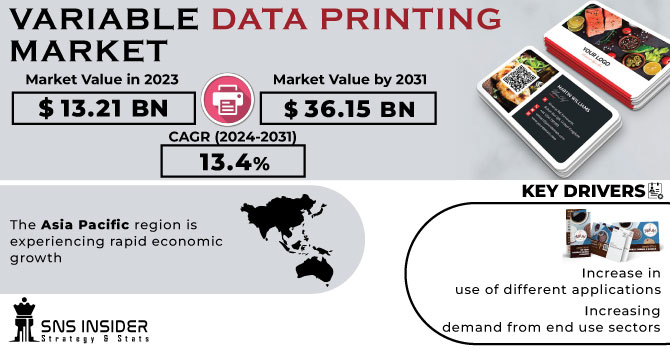
The Variable Data Printing Market in 2023 was estimated at USD 13.21 billion, and by 2031 it is projected to reach USD 36.15 billion with a CAGR of 13.4 % over the period from 2024 to 2031.
The variable data printing market is undergoing a significant transformation in the broader landscape of the printing industry. This creative segment uses digital printing technology to create personalized and bespoke printed materials by dynamically shifting content, images and information from one piece to another. This approach allows companies to create personalized communication materials tailored to each recipient, ushering in a new era of targeted marketing.
Get More Information on Variable Data Printing Market - Request Sample Report
The growth of the changing data printing market is driven by several fundamental factors. The growing need for personalized experiences has prompted businesses to use change data printing as a way to create their own marketing materials, direct mail campaigns, labels, packaging and promotional content. other fox. Additionally, the popularity of data-driven marketing strategies, enabled by advanced data analytics, has amplified the allure of variable data printing. By leveraging customer insights, businesses can design accurate and impactful marketing campaigns to drive engagement and conversions.
The rise of the e-commerce business has further increased the demand for personalized packaging, labels and accessories. Variable data printing meets this need by facilitating on-demand printing of personalized documents, improving the unboxing experience for consumers, and improving brand recognition. Additionally, the integration of variable data printing with digital marketing channels such as email and social media has resulted in cohesive and harmonious marketing campaigns that span multiple touchpoints, reinforcing the message. brand and customer engagement. The applications of data printing vary widely across different industries. It finds a strong foothold in marketing and advertising, allowing companies to create dynamic and targeted marketing materials to engage audiences. In retail and e-commerce, personalized packaging and labelling allows brands to leave a lasting impression on customers. Similarly, in manufacturing and logistics, variable data printing optimizes supply chain efficiency by streamlining labelling, barcoding and packaging processes. In addition, the pharmaceutical and healthcare industries benefit from personalized patient information and prescription labelling, supporting patient safety and compliance.
MARKET DYNAMICS
KEY DRIVERS:
-
Increase in use of different applications
The market growth is expected to accelerate as more and more of these labels are being used for the creation of serial numbers and product information in a shorter amount of time, at reduced costs. Moreover, market growth continues to increase as more and more people use the barcode concept for creating invoices and monitoring large quantities of goods.
-
Increasing demand from end use sectors
RESTRAIN:
-
The costs of printing systems are high
Due to the high costs of printing equipment, it is difficult for small firms to afford them and will impede their growth on the variable data printing market.
OPPORTUNITY:
-
Increasing technological advancements and innovations
Other market growth drivers are the increasing focus on innovative printing and the appeal of products, the introduction of new technologies and products, and the growing trend towards online shopping. Commercial opportunities are available for market players, thanks to increased digital skills and growing demand in developing economies.
-
Healthcare and Pharmaceutical Applications
CHALLENGES:
-
Investment in hardware, software, training, and maintenance
Implementing variable data printing technology requires upfront investment. Smaller businesses might find it difficult to allocate resources for these investments.
IMPACT OF RUSSIAN UKRAINE WAR
War is expected to disrupt supply chains and increase costs for variable data printing service providers. This can lead to higher prices for variable data printing services, which can reduce demand in the market. War has also reduced the need to print change data in certain industries, such as travel and tourism. Indeed, companies in these industries are likely to reduce their marketing and advertising activities due to the uncertainty caused by the war. The cost of printing variable data postcards in Europe has increased by 10% since the start of the war. This is due to increased costs of paper, ink, and shipping. Demand for variable data printing services in the travel and tourism industry has fallen by 20% since the start of the war. This was due to a drop in tourism and travel activities due to the war. The supply of change data printing services to Ukraine has been interrupted since the beginning of the war. This is due to the closure of Ukrainian airspace and destruction of infrastructure. The impact of the Russo-Ukrainian war on the variable data printing market is expected to be felt until the end of 2023. However, the market is expected to recover in 2024 when the war subsides. and the global economy recovered.
IMPACT OF ONGOING RECESSION
Companies are reducing marketing and advertising activities to save money. This has resulted in a reduction in demand for variable data printing services, which are often used to create personalized marketing materials. The economic downturn is also increasing costs for vendors printing variable data. This is due to the rising cost of materials, labor and transportation. These increased costs are passed on to businesses, making variable data printing services more expensive. Consumers are increasingly price conscious during recessions. This causes them to shift their preferences away from personalized products and services, which are often more expensive than generic products and services. This also has a negative impact on demand for variable data printing services.
KEY MARKET SEGMENTS
By Component
-
Variable Data Printing Software
-
Variable Data Printing Software
-
Services
By Label Type
-
Release Liner Label
-
Linerless Label
By Printing Technology
-
Inkjet
-
Direct Thermal
-
Electrography
-
Thermal Transfer
By Application
-
Food & Beverages
-
Healthcare
-
Retail
-
Consumer Durables
-
Cosmetics & Toiletries
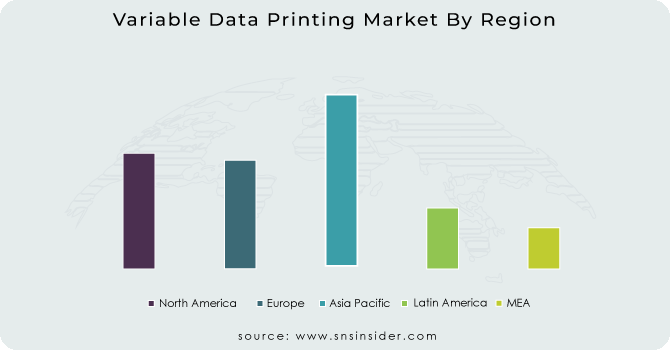
REGIONAL ANALYSIS
North America, particularly the United States and Canada, is dominating market for variable data printing. The region's established industries, strong retail sector and technological advancements contribute to the demand for personalized marketing materials, direct mail, labels and packaging. The growth of e-commerce, the emphasis on targeted marketing, and the demand for data-driven campaigns are driving the adoption of transformative data printing solutions.
The Asia Pacific region is experiencing rapid economic growth, urbanization, and digital transformation. These factors are driving increased demand for personalized marketing materials, labels, packaging, and other printed products, which align well with the capabilities of variable data printing. Countries like China, India, Japan, and South Korea are key players in this market. The rise of e-commerce, changing consumer preferences, and the adoption of advanced printing technologies are contributing to the growth of the variable data printing market in this region.
Get Customized Report as per Your Business Requirement - Request For Customized Report
REGIONAL COVERAGE:
North America
-
US
-
Canada
-
Mexico
Europe
-
Eastern Europe
-
Poland
-
Romania
-
Hungary
-
Turkey
-
Rest of Eastern Europe
-
-
Western Europe
-
Germany
-
France
-
UK
-
Italy
-
Spain
-
Netherlands
-
Switzerland
-
Austria
-
Rest of Western Europe
-
Asia Pacific
-
China
-
India
-
Japan
-
South Korea
-
Vietnam
-
Singapore
-
Australia
-
Rest of Asia Pacific
Middle East & Africa
-
Middle East
-
UAE
-
Egypt
-
Saudi Arabia
-
Qatar
-
Rest of Middle East
-
-
Africa
-
Nigeria
-
South Africa
-
Rest of Africa
-
Latin America
-
Brazil
-
Argentina
-
Colombia
-
Rest of Latin America
Key Players
Some major key players in the Variable Data Printing market are HP Inc, 3M Company, Mondi Plc, Canon Inc, WS Packaging Group Inc, Xerox Corporation, Avery Dennison Corporation, Cenveo Inc, RR Donnelley & Sons Company, Quad/Graphics Inc and other players.
3M Company-Company Financial Analysis
RECENT DEVELOPMENT
-
Domino Digital Printing Solutions announced in early 2022 that it had received a significant investment from the converters to add variable data printing, VDP, into its label production needs. The number of K600i printers in use around the world is also increasing according to the company.
-
Comexi has announced the introduction of digiflex, a revolutionary Digital Print solution using low levels of migration inks for direct printing on food hygiene packaging.
| Report Attributes | Details |
| Market Size in 2023 | US$ 13.21 Bn |
| Market Size by 2031 | US$ 36.15 Bn |
| CAGR | CAGR of 13.4 % From 2024 to 2031 |
| Base Year | 2023 |
| Forecast Period | 2024-2031 |
| Historical Data | 2020-2022 |
| Report Scope & Coverage | Market Size, Segments Analysis, Competitive Landscape, Regional Analysis, DROC & SWOT Analysis, Forecast Outlook |
| Key Segments | • By Component (Variable Data Printing Software, Variable Data Printing Software, Services) • By Label Type (Release Liner Label, Linerless Label) • By Printing Technology (Inkjet, Direct Thermal, Electrography, Thermal Transfer) • By Application (Food & Beverages, Healthcare, Retail, Consumer Durables, Cosmetics & Toiletries) |
| Regional Analysis/Coverage | North America (US, Canada, Mexico), Europe (Eastern Europe [Poland, Romania, Hungary, Turkey, Rest of Eastern Europe] Western Europe] Germany, France, UK, Italy, Spain, Netherlands, Switzerland, Austria, Rest of Western Europe]). Asia Pacific (China, India, Japan, South Korea, Vietnam, Singapore, Australia, Rest of Asia Pacific), Middle East & Africa (Middle East [UAE, Egypt, Saudi Arabia, Qatar, Rest of Middle East], Africa [Nigeria, South Africa, Rest of Africa], Latin America (Brazil, Argentina, Colombia Rest of Latin America) |
| Company Profiles | HP Inc, 3M Company, Mondi Plc, Canon Inc, WS Packaging Group Inc, Xerox Corporation, Avery Dennison Corporation, Cenveo Inc, RR Donnelley & Sons Company, Quad/Graphics Inc |
| Key Drivers | • Increase in use of different applications • Increasing demand from end use sectors |
| Market Restraints | • The costs of printing systems are high |
Get in Touch
