Variable Rate Technology (VRT) Market Report Scope & Overview:
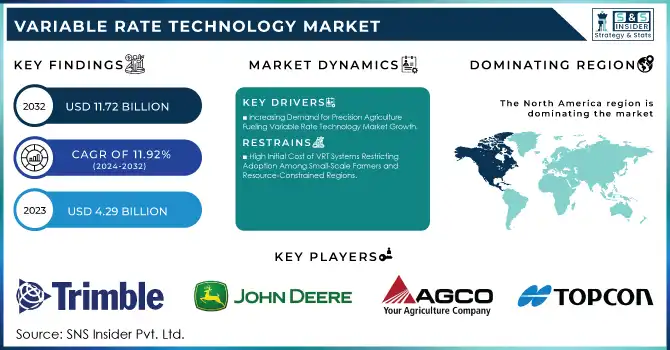
The Variable Rate Technology Market was valued at USD 4.29 billion in 2023 and is expected to reach USD 11.72 billion by 2032, growing at a CAGR of 11.92% from 2024-2032.
Get more information on Variable Rate Technology (VRT) Market - Request Free Sample Report
The Variable Rate Technology market has experienced notable growth due to advancements in precision agriculture, which enable farmers to optimize resource usage and increase crop yields. A farm-scale study found that using variable-input technology increased profits by USD 63 to USD 100 per acre compared to traditional uniform input application methods. As farming practices become more data-driven, VRT allows for precise adjustments to applying water, fertilizers, and pesticides based on real-time data, thus enhancing efficiency. This growing focus on sustainability and resource conservation further drives the demand for VRT, as it helps reduce waste and environmental impact. Consequently, VRT is becoming an essential tool for modern farmers aiming to improve both productivity and environmental stewardship.
The rising demand for VRT is fueled by the need to meet the challenges posed by a growing global population and the increasing pressure to produce more food with limited resources. As farmers look for ways to enhance productivity, VRT offers a solution by ensuring that inputs are applied more efficiently, reducing cost and waste. This growing shift towards optimized farming practices is supported by the availability of advanced technologies like GPS, sensors, and cloud-based platforms that facilitate real-time monitoring and decision-making. As these technologies become more accessible, particularly in emerging markets, VRT adoption is expected to expand rapidly, further accelerating market growth.
Looking ahead, the future of the VRT market presents significant opportunities driven by the integration of artificial intelligence and machine learning, which will improve data analytics and resource management. The application of AI and ML can enable more accurate predictions and further optimize farming practices, making VRT even more effective. The cost of the AI unit is between USD 30,000 and USD 35,000, but a key driving force for its adoption is the ability to offset increasing labor costs, providing long-term cost savings. Furthermore, collaboration between technology providers and agricultural firms is expected to foster innovation, leading to more integrated solutions tailored to the needs of farmers. With sustainability becoming increasingly central to global agriculture, VRT's role in maximizing resource efficiency will solidify its importance, ensuring continued growth and opportunities in the market.
MARKET DYNAMICS
DRIVERS
-
Advancements in IoT and AI Driving Variable Rate Technology Market Growth
The integration of Internet of Things sensors, artificial intelligence, and machine learning is significantly driving the growth of the Variable Rate Technology market. IoT sensors provide real-time data on soil conditions, moisture levels, and crop health, enabling farmers to make precise, data-driven decisions. AI and ML algorithms analyze this data to optimize input applications, ensuring efficient resource use. In December 2024, Google launched an AI initiative in India, offering an API that uses satellite imagery to enhance farming practices by providing insights into soil health and weather patterns, ultimately improving crop yields. Automation powered by these technologies reduces manual intervention and enhances efficiency. As IoT and AI technologies evolve, VRT systems become more effective, cost-efficient, and accessible, supporting smarter farming practices that reduce waste and environmental impact.
-
Increasing Demand for Precision Agriculture Fueling Variable Rate Technology Market Growth
The increasing demand for precision agriculture is driven by the need to improve farming efficiency and sustainability. VRT enables farmers to apply inputs like water, fertilizers, and pesticides more accurately, minimizing waste and reducing environmental impact. By tailoring applications to specific field conditions, VRT optimizes resource usage, resulting in higher crop yields while cutting costs. As the pressure to meet growing food demands rises, precision farming practices have become essential for maximizing productivity. The ability to make data-driven decisions based on real-time field insights further strengthens the appeal of VRT, making it an integral part of modern agriculture. This shift towards more efficient and sustainable farming practices is a key factor behind the market growth of VRT technology.
RESTRAINTS
-
High Initial Cost of VRT Systems Restricting Adoption Among Small-Scale Farmers and Resource-Constrained Regions
The high initial cost associated with Variable Rate Technology systems poses a significant barrier to their widespread adoption. These systems require specialized machinery, advanced sensors, and software, all of which come with substantial upfront expenses. For small-scale farmers or those with limited financial resources, these costs can be prohibitive, preventing them from accessing the benefits of VRT. While the long-term advantages of VRT, such as reduced input costs and optimized crop yields, may offset the initial investment, the financial burden remains a challenge for many in the agricultural sector. This cost barrier can slow the market growth, especially in regions where access to capital and financing options is limited, hindering the adoption of more efficient and sustainable farming technologies.
SEGMENT ANALYSIS
By Technology
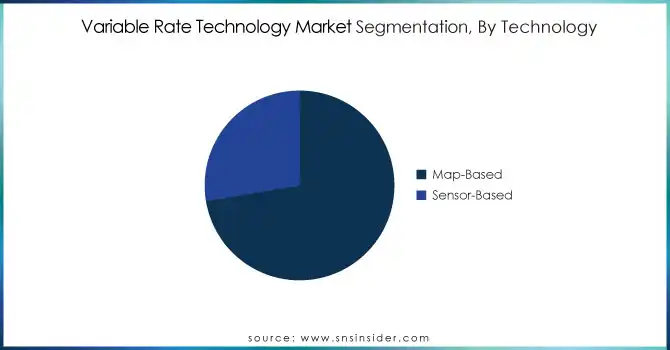
In 2023, the Map-Based segment dominated the Variable Rate Technology market, capturing the highest revenue share of about 72%. This dominance can be attributed to the widespread adoption of Geographic Information System mapping, which allows farmers to make data-driven decisions based on detailed, field-specific maps. The ability to accurately assess variations in soil health, moisture levels, and crop conditions enhances input application efficiency, driving demand for map-based VRT solutions.
The Sensor-Based segment is poised to grow at the fastest compound annual growth rate of about 13.74% from 2024 to 2032. This rapid growth is driven by advancements in sensor technologies, which enable real-time, on-site data collection and analysis. Sensors provide farmers with highly precise, actionable insights, improving resource management and operational efficiency. As the demand for more automated, real-time VRT solutions rises, sensor-based technologies are increasingly seen as critical to achieving sustainable and optimized agricultural practices.
By Component
In 2023, the Hardware segment dominated the Variable Rate Technology market, accounting for the highest revenue share of about 72%. This dominance stems from the critical role that hardware components, such as precision equipment, sensors, and controllers, play in the functionality of VRT systems. As farmers increasingly invest in advanced machinery for precise input application, hardware remains an essential and foundational element driving the adoption of VRT solutions.
The Services segment is expected to grow at the fastest compound annual growth rate of about 15.33% from 2024 to 2032. This growth is fueled by the rising demand for technical support, system integration, and data analytics services, which are crucial for optimizing the performance of VRT systems. As more farmers adopt these technologies, the need for comprehensive training, maintenance, and data-driven insights is intensifying, positioning the services segment as a key driver of market expansion.
By Crop Type
In 2023, the Cereals and Grains segment dominated the Variable Rate Technology market, capturing the highest revenue share of about 44%. This dominance is largely due to the extensive cultivation of crops such as wheat, corn, and rice, which require precise input management to optimize yields. The widespread adoption of VRT in these staple crops is driven by the need for efficient resource use, including water, fertilizers, and pesticides, which boosts productivity while minimizing costs.
The Fruits and Vegetables segment is projected to grow at the fastest compound annual growth rate of about 14.28% from 2024 to 2032. This rapid growth is attributed to the increasing demand for high-quality produce, where precise farming practices can significantly enhance yield and quality. As fruit and vegetable farming becomes more specialized and labor-intensive, VRT systems are increasingly seen as essential tools for optimizing input applications, reducing waste, and ensuring sustainable farming practices, driving market expansion in this sector.
By Farm Size
Large Farms segment dominated the Variable Rate Technology market with the highest revenue share of about 58% in 2023 and is expected to grow at the fastest compound annual growth rate of about 13.13% from 2024 to 2032. This dominance is largely due to the scale of operations on large farms, where the need for advanced technology to manage extensive fields and optimize resource use is critical. VRT solutions help these farms reduce input costs, improve efficiency, and boost crop yields, making them an essential tool for large-scale farming. As agricultural technology continues to evolve, large farms are increasingly adopting VRT to enhance productivity, minimize waste, and ensure sustainability, driving both current dominance and future growth in the market.
REGIONAL ANALYSIS
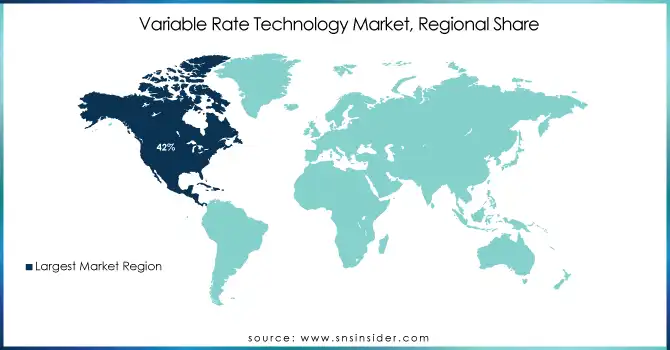
In 2023, North America dominated the Variable Rate Technology market, with the highest revenue share of about 42%. This dominance is driven by the region's advanced agricultural practices, high adoption of precision farming technologies, and large-scale farming operations. The U.S. and Canada, in particular, have a strong focus on optimizing resource use and improving crop yields, making VRT solutions a critical investment for enhancing productivity and sustainability. The availability of technological infrastructure and government support for agricultural innovations further strengthens North America's leadership in the VRT market.
The Asia Pacific region is expected to grow at the fastest compound annual growth rate of about 13.80% from 2024 to 2032. This rapid growth is fueled by the increasing demand for food production in the region, driven by a growing population and the need for higher agricultural productivity. As countries in Asia Pacific embrace modern farming technologies to address challenges like resource scarcity and climate change, the adoption of VRT solutions is accelerating. This shift towards precision agriculture is poised to transform the region's farming practices, positioning it as a key player in the global VRT market.
Need any customization research on Variable Rate Technology (VRT) Market - Enquiry Now
KEY PLAYERS
-
Trimble Inc. (Trimble Ag Software, TMX-2050 Display)
-
John Deere & Company (John Deere Operations Center)
-
AGCO Corporation (Fuse Technologies, AGCOMMAND)
-
Topcon Corporation (Topcon Agriculture Solutions, X30 Guidance System)
-
CNH Industrial NV (Case IH AFS Connect, New Holland PLM Intelligence)
-
Kubota Corporation (Kubota Precision Agriculture, Kubota Farm Solutions)
-
Yara International (YaraVita, YaraLiva)
-
Valmont Industries, Inc. (Valmont Irrigation, Valley Irrigation Control Systems)
-
Lindsay Corporation (FieldNET, Zimmatic)
-
Hexagon (Hexagon Agriculture Solutions, HxGN Smart Farming)
-
AgJunction (AgJunction Smart Ag, Ontrac3 Auto-Steering System)
-
Ageagle Aerial Systems (eBee X, eBee Ag)
-
Raven Industries, Inc. (Raven Viper 4, Raven Slingshot)
-
AG Leader Technology (Ag Leader Integra Display, FieldEdge)
-
BASF ( xarvio Digital Farming Solutions, xarvio Field Manager)
-
Monsanto (now part of Bayer) (Climate FieldView, FieldScripts)
-
Sakata Seed Corporation (Sakata Precision Agriculture, FieldSense)
-
TeeJet Technologies (Matrix 430, SpraySmart)
-
Mettler Toledo (AgroStar, Precision Ag Scales)
-
Kverneland Group (IsoMatch Tellus, IsoMatch AutoPilot)
-
FMC Corporation (FMC Smart Weed Control, FMC Prescription Spraying)
-
Rivulis (Rivulis AutoPilot, Rivulis Crop Monitoring Solutions)
-
Precision Planting (SeedSense, FieldView Drive)
-
Syngenta (AgriEdge Excelsior, Syngenta Digital Solutions)
Recent Developments
-
At Cereals 2024, John Deere will showcase new innovations such as the S7 Series combines for improved grain quality, 5M Series tractors with updated transmissions, and advanced R740i and R962i sprayers featuring PowrSpray technology for efficient crop spraying.
-
In August 2024, CropX and CNH Industrial announced a digital integration that automates data transfer from CNH machinery to CropX's agronomic farm management system.
| Report Attributes | Details |
|---|---|
| Market Size in 2023 | USD 4.29 Billion |
| Market Size by 2032 | USD 11.72 Billion |
| CAGR | CAGR of 11.92% From 2024 to 2032 |
| Base Year | 2023 |
| Forecast Period | 2024-2032 |
| Historical Data | 2020-2022 |
| Report Scope & Coverage | Market Size, Segments Analysis, Competitive Landscape, Regional Analysis, DROC & SWOT Analysis, Forecast Outlook |
| Key Segments | • By Component (Hardware, Software, Services) • By Technology (Map-based, Sensor-based) • By Crop Type (Cereals and Grains, Fruits and Vegetables, Oilseeds and Pulses, Others) • By Farm Size (Large Farms, Mid-sized Farms, Small Farms) • By Application (Fertilizers, Crop Protection Chemicals, Soil Sensing, Yield Monitoring, Irrigation, Others) |
| Regional Analysis/Coverage | North America (US, Canada, Mexico), Europe (Eastern Europe [Poland, Romania, Hungary, Turkey, Rest of Eastern Europe] Western Europe] Germany, France, UK, Italy, Spain, Netherlands, Switzerland, Austria, Rest of Western Europe]), Asia Pacific (China, India, Japan, South Korea, Vietnam, Singapore, Australia, Rest of Asia Pacific), Middle East & Africa (Middle East [UAE, Egypt, Saudi Arabia, Qatar, Rest of Middle East], Africa [Nigeria, South Africa, Rest of Africa], Latin America (Brazil, Argentina, Colombia, Rest of Latin America) |
| Company Profiles | Trimble Inc., John Deere & Company, AGCO Corporation, Topcon Corporation, CNH Industrial NV, Kubota Corporation, Yara International, Valmont Industries, Inc., Lindsay Corporation, Hexagon, AgJunction, Ageagle Aerial Systems, Raven Industries, Inc., AG Leader Technology, BASF, Monsanto (now part of Bayer), Sakata Seed Corporation, TeeJet Technologies, Mettler Toledo, Kverneland Group, FMC Corporation, Rivulis, Precision Planting, Syngenta. |
| Key Drivers | • Advancements in IoT and AI Driving Variable Rate Technology Market Growth • Increasing Demand for Precision Agriculture Fueling Variable Rate Technology Market Growth |
| RESTRAINTS | • High Initial Cost of VRT Systems Restricting Adoption Among Small-Scale Farmers and Resource-Constrained Regions |
Frequently Asked Questions
Ans: North America dominated the VRT market with a revenue share of about 42% in 2023.
Ans: The Cereals and Grains segment dominated the VRT market with a revenue share of about 44% in 2023.
Ans: The Hardware segment dominated the VRT market with a revenue share of about 72% in 2023.
Ans: The Sensor-Based segment is expected to grow at a CAGR of about 13.74% from 2024 to 2032.
Ans: Variable Rate Technology Market was valued at USD 4.29 billion in 2023 and is expected to reach USD 11.72 billion by 2032, growing at a CAGR of 11.92% from 2024-2032.
Get in Touch
