Virtual Pipeline Market Report Scope & Overview:
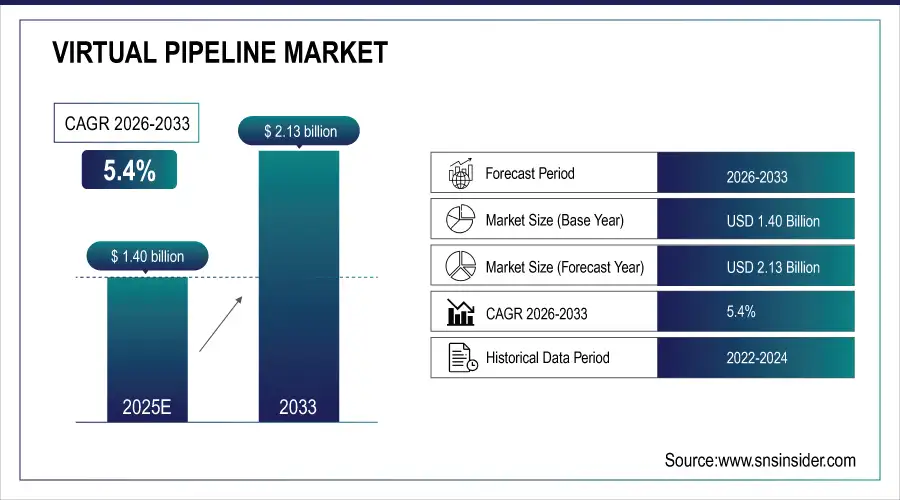
The Virtual Pipeline Market size was valued at USD 1.40 billion in 2025E and is expected to grow to USD 2.13 billion by 2033 and grow at a CAGR of 5.4% over the forecast period of 2026-2033.
A virtual pipeline substitutes for a physical pipeline by allowing gas to be delivered through a conventional gas pipeline as LNG by sea, land, air, or a combination of these modes of transportation to the delivery point.
When moving LNG from its source, such as an import terminal, it is squeezed into a cryogenic tank, or delivery point, whether it is a liquefaction facility or dispensation center. The natural gas is delivered just as it would have via the conventional pipeline thanks to a regasification station, a multipurpose building that incorporates LNG storage, vaporization, and pressure regulation, as well as control systems.
Market Size and Forecast: 2025E
-
Market Size in 2025E USD 1.40 Billion
-
Market Size by 2033 USD 2.13 Billion
-
CAGR of 5.4% From 2026 to 2033
-
Base Year 2024
-
Forecast Period 2026-2033
-
Historical Data 2021-2024
Get more information on Virtual Pipeline Market - Request Sample Report
Virtual Pipeline Market Trends:
• Rising adoption of virtual gas pipeline solutions to supply energy to remote or hard-to-reach regions.
• Growing shift toward cleaner fuels driven by decarbonization policies and environmental concerns.
• Expanding use of natural gas as a transitional fuel across industrial, commercial, and transportation sectors.
• Increasing investments in flexible, mobile gas delivery systems as alternatives to costly pipeline infrastructure.
• Advancements in compression, storage, and transportation technologies that enhance efficiency and safety of gas distribution.
Virtual Pipeline Market Growth Drivers:
-
Growing operation at a remote location
-
Growing Demand for Natural Gas and a Shifting Trend Toward Cleaner Energy Sources
Because of the serious risks posed by global warming, there has been a shift toward cleaner forms of energy, which has raised the demand for natural gas. Physical pipelines are not always practical due to topography or geopolitical events that may be responsible for the market's growth. A flexible option for the conveyance of virtual goods gas, and natural. In order to save money on pipeline installation and prepare for market expansion, it does not necessitate the extensive installation of a physical pipeline.
Virtual Pipeline Market Restraints:
The virtual pipeline market faces restraints primarily due to the high costs associated with compression, storage, and transportation systems, which limit adoption in price-sensitive regions. Additionally, the accelerating shift toward renewable energy sources such as solar and wind reduces long-term reliance on natural gas–based distribution solutions. As nations prioritize cleaner, zero-emission alternatives, investment in virtual pipeline infrastructure may slow.
Virtual Pipeline Market Opportunities:
The rising global focus on clean, low-carbon energy is creating significant opportunities for the virtual pipeline market. As industries and governments work to reduce emissions, natural gas is increasingly being adopted as a cleaner transitional fuel compared to coal and oil. This shift is driving demand for flexible gas delivery solutions in regions lacking pipeline infrastructure. Virtual pipelines enable efficient, scalable supply, supporting industrial expansion, remote operations, and cleaner energy adoption across emerging markets.
Virtual Pipeline Market Segment Analysis:
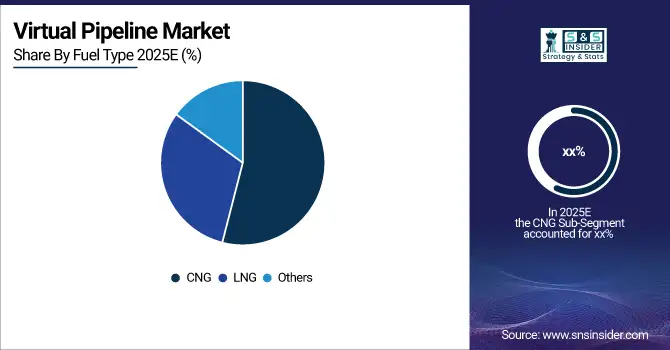
By Fuel Type
The Virtual Pipeline Market enables the transportation of gas, such as CNG and LNG, without conventional pipelines, using alternative logistics like trucks, ships, and containers. It offers flexibility in reaching remote or infrastructure-limited locations, supporting the growing demand for cleaner energy sources. With CNG and LNG as primary fuel types, the market addresses energy accessibility challenges, reduces dependency on physical pipelines, and promotes sustainable energy distribution across industrial, commercial, and residential sectors.
By Application
The Virtual Pipeline Market serves diverse applications, including transportation and industrial & commercial sectors, by enabling gas delivery without traditional pipelines. It facilitates access to CNG, LNG, and other gases in areas lacking infrastructure, supporting energy efficiency and sustainability. This market helps industries and transport services meet growing clean energy demands, ensures reliable fuel supply in remote locations, and reduces reliance on conventional pipeline networks, driving flexible and scalable energy distribution solutions.
Virtual Pipeline Market Regional Analysis:
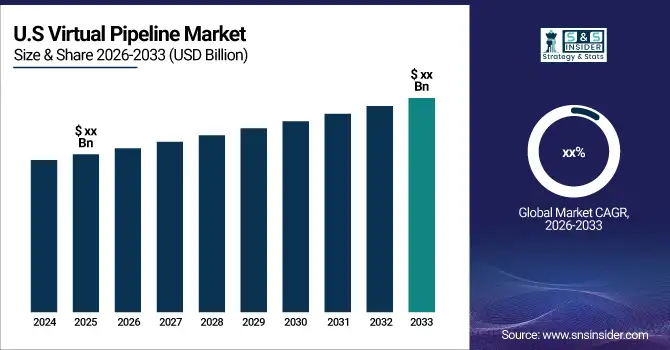
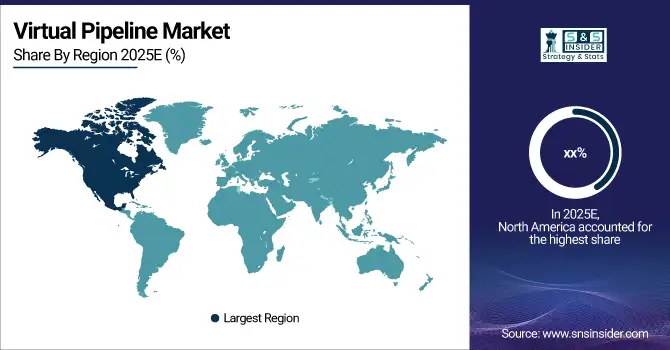
North America Virtual Pipeline Market Insights
North America currently holds the top spot in the global market for virtual pipeline systems, due to the U.S.'s significant market share, convenient availability, and affordable prices. Due to the quick movement in consumer preference toward adopting cleaner alternatives to fossil fuels as well as the considerable investments in natural gas made by developing economies.
Get Customized Report as per your Business Requirement - Request For Customized Report
Asia Pacific Virtual Pipeline Market Insights
The Virtual Pipeline Market in Asia-Pacific is expected to grow significantly between 2025 and 2033, driven by rising energy demand, infrastructure expansion, and a shift toward cleaner fuels like CNG and LNG. Increasing industrialization, transportation needs, and government initiatives to promote sustainable energy solutions are key factors supporting the region’s rapid adoption of virtual pipeline technologies.
Europe Virtual Pipeline Market Insights
The European Virtual Pipeline Market is growing steadily due to stringent environmental regulations, a strong focus on clean energy, and expanding industrial and transportation sectors. The increasing adoption of LNG and CNG solutions for remote regions and infrastructure-limited areas drives market growth, supporting Europe’s transition toward sustainable and flexible energy distribution systems.
Latin America (LATAM) and Middle East & Africa (MEA) Virtual Pipeline Market Insights
The LATAM and MEA markets are witnessing growth fueled by rising energy demand, limited pipeline infrastructure, and increasing investments in LNG and CNG solutions. These regions leverage virtual pipelines to supply industrial, commercial, and transportation sectors efficiently, enhancing energy accessibility and supporting the shift toward cleaner, flexible, and sustainable fuel distribution methods.
Competitive Landscape for Virtual Pipeline Market:
Kinder Morgan, Inc. is a leading North American energy infrastructure company specializing in the transportation and storage of natural gas, crude oil, and refined products. Operating pipelines, terminals, and storage facilities, it plays a key role in energy distribution, supporting industrial, commercial, and utility sectors across the U.S. and Canada.
-
In August 2024, Kinder Morgan paid USD 135 million to acquire North American Natural Resources, Inc., as well as its subsidiary firms North American Biofuels LLC and North American-Central LLC. The transaction comprises seven amounts of landfill gas to power facilities in Michigan and Kentucky in the amalgamate purchase amount and accompanying contract fees. Through this transaction, Kinder Morgan makes the Final Investment Decision (FID) to upgrade 4 of the 7 gas-to-power facilities to renewable natural gas facilities for an estimated US$175 million in capital costs.
Virtual Pipeline Market Key Players:
The Major Players are Kinder Morgan, Stabilis Solutions, Inc., Hexagon Agility, Fiba Technologies, Petronas, CNG Services, Gas Malaysia, Galileo Technologies, NG Advantage, Marline Gas Services, Snam, Certarus Ltd. and other players are listed in a final report.
| Report Attributes | Details |
| Market Size in 2025E | USD 1.40 Billion |
| Market Size by 2033 | USD 2.13 Billion |
| CAGR | CAGR of 5.4% From 2026 to 2033 |
| Base Year | 2024 |
| Forecast Period | 2026-2033 |
| Historical Data | 2021-2024 |
| Report Scope & Coverage | Market Size, Segments Analysis, Competitive Landscape, Regional Analysis, DROC & SWOT Analysis, Forecast Outlook |
| Key Segments | • By Fuel Type (CNG, LNG, Others) • By Application (Transportation, Industrial & Commercial) |
| Regional Analysis/Coverage | North America (US, Canada), Europe (Germany, UK, France, Italy, Spain, Russia, Poland, Rest of Europe), Asia Pacific (China, India, Japan, South Korea, Australia, ASEAN Countries, Rest of Asia Pacific), Middle East & Africa (UAE, Saudi Arabia, Qatar, South Africa, Rest of Middle East & Africa), Latin America (Brazil, Argentina, Mexico, Colombia, Rest of Latin America). |
| Company Profiles | Kinder Morgan (U.S.), Stabilis Solutions, Inc. (U.S.), Hexagon Agility (U.S.), Fiba Technologies (U.S.), Petronas (Malaysia), CNG Services (U.K.), Gas Malaysia (Malaysia), Galileo Technologies (Argentina), NG Advantage (Vermont), Marline Gas Services (U.S.), Snam (Italy), Certarus Ltd (Canada) |
Frequently Asked Questions
Ans: Growing operation at remote location and Growing Demand for Natural Gas and a Shifting Trend Toward Cleaner Energy Sources
Ans: North America is dominating the market.
Ans: The Virtual Pipeline Market size was valued at USD 1.40 billion in 2025E
Ans: USD 2.13 billion is expected to grow by 2033.
Ans: The Virtual Pipeline Market is anticipated to expand by 5.4 % from 2026 to 2033.
Get in Touch
