Vulnerability Management Market Report Scope & Overview:
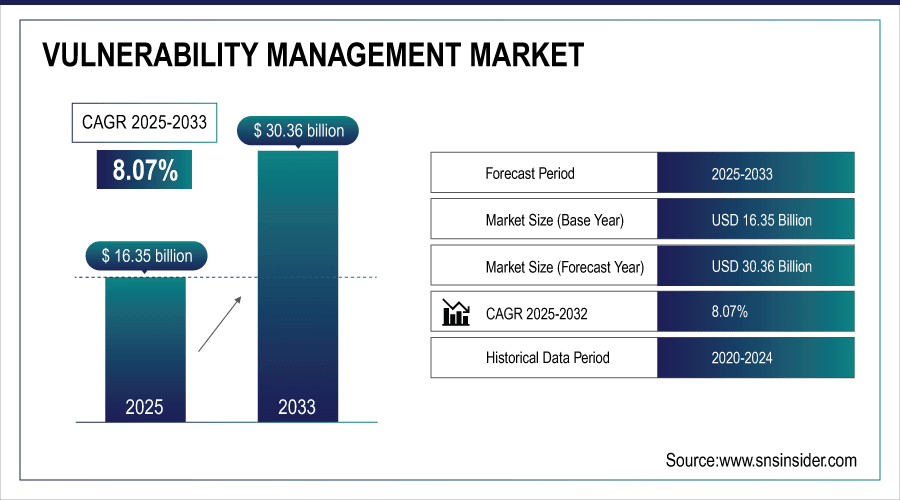
The Vulnerability management market Size was valued at USD 16.35 Billion in 2025E and is expected to reach USD 30.36 Billion by 2033 and grow at a CAGR of 8.07% over the forecast period 2026-2033.
The Vulnerability Management market is primarily driven by the increasing frequency and sophistication of cyberattacks across industries, which has raised the need for organizations to proactively identify and remediate security weaknesses. The growing adoption of digital transformation, cloud computing, and IoT devices has expanded the attack surface, prompting enterprises to invest in advanced vulnerability management solutions. According to study, over 70% of enterprises are investing in cloud and IoT-enabled technologies, expanding the digital footprint and attack surface.
Vulnerability Management Market Trends
-
Rising cyberattacks drive organizations to adopt proactive vulnerability management solutions.
-
Digital transformation and IoT expansion increase enterprise attack surfaces globally.
-
Regulatory compliance and industry mandates accelerate vulnerability management adoption worldwide.
-
Cloud-based and managed services simplify deployment for SMEs and enterprises.
-
Automated remediation and threat intelligence improve efficiency in addressing vulnerabilities.
-
Emerging markets and digitalization offer significant growth opportunities for vendors.
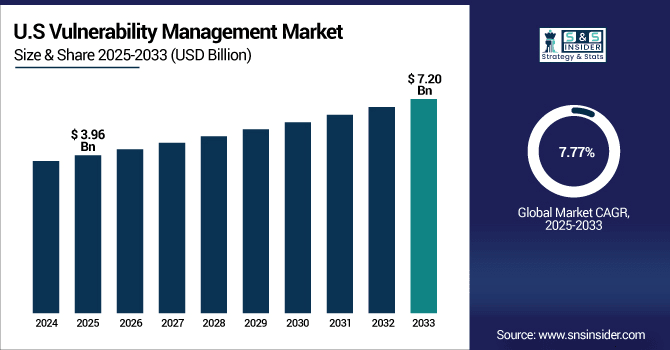
The U.S. Vulnerability management market size was USD 3.96 Billion in 2025E and is expected to reach USD 7.20 Billion by 2033, growing at a CAGR of 7.77% over the forecast period of 2026-2033, driven by the high frequency of cyberattacks, with enterprises facing millions of threats annually, including ransomware and phishing. Rapid adoption of cloud computing, IoT, and digital transformation has expanded attack surfaces, while stringent regulations like HIPAA and CCPA enforce robust cybersecurity measures.
Vulnerability Management Market Growth Drivers:
-
Rising Cyberattacks Push Organizations to Adopt Vulnerability Management Solutions
The primary driver for the vulnerability management market is the rising number and complexity of cyberattacks across industries. As organizations adopt digital technologies such as cloud computing, IoT, and remote work solutions, the attack surface expands significantly. Enterprises are now facing advanced threats like ransomware, zero-day attacks, and phishing campaigns, which can disrupt operations, compromise sensitive data, and cause financial losses. Vulnerability management solutions help organizations proactively identify, prioritize, and remediate security gaps in their IT infrastructure.
Around 30% of companies report at least one major data breach per year, affecting sensitive customer and corporate data.
Vulnerability Management Market Restraints:
-
High Costs and Complexity Challenge Vulnerability Management Adoption Globally
A major restraint for the market is the complexity and cost of deploying comprehensive vulnerability management solutions. For many organizations, especially SMEs, implementing and integrating these solutions into existing IT infrastructure can require significant financial and technical resources. This includes costs for software licenses, skilled personnel, continuous monitoring, and regular updates. Additionally, advanced solutions often demand integration with other cybersecurity tools, which can increase operational complexity. These challenges may slow adoption among smaller businesses or organizations with limited cybersecurity expertise, even though the need for protection is critical.
Vulnerability Management Market Opportunities:
-
Cloud-Based and Managed Services Open New Growth Opportunities
A significant growth opportunity lies in the rise of cloud-based and managed vulnerability management services. Cloud deployments allow organizations to access scalable, cost-effective security solutions without heavy upfront investment in hardware or infrastructure. Managed services further relieve organizations from the burden of continuous monitoring and maintenance, enabling them to focus on core operations while still ensuring strong security. This trend is particularly beneficial for SMEs and organizations in emerging regions, where cybersecurity expertise and budgets may be limited. By offering subscription-based, automated, and scalable solutions, vendors can tap into a growing market segment and drive adoption across industries undergoing rapid digital transformation.
Organizations deploying automated threat intelligence tools report faster remediation of vulnerabilities by 40–50%.
Vulnerability Management Market Segmentation Analysis:
-
By Component: In 2024, Solution led the market with share 65.20%, while Services are the fastest-growing segment with a CAGR 8.42%.
-
By Organization: In 2024, Large enterprises the market 30.06%, while SME fastest-growing segment with a CAGR 9.17%.
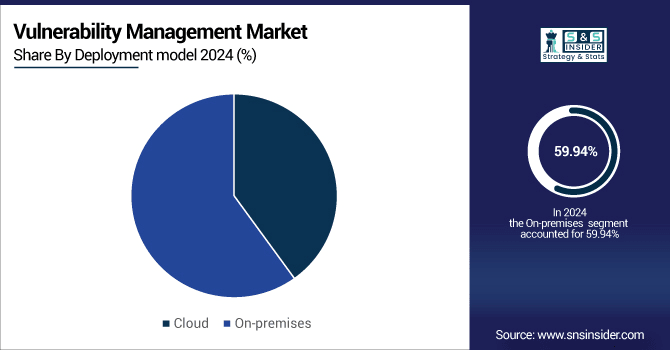
-
By Deployment model: In 2024, Cloud led the market with share 40.06%, while On-premises the fastest-growing segment with a CAGR 9.24%.
-
By End-user: In 2024, IT & telecom led the market with share 30.06%, while Healthcare is the fastest-growing segment with a CAGR 11.06%.
By Component, Solution Lead Market While Services Fastest Growth
In the Vulnerability Management market, the Solution segment leads in 2024, accounting for the majority of adoption due to increasing demand for advanced software tools like vulnerability scanners, threat intelligence platforms, and endpoint protection solutions. Solutions provide organizations with comprehensive capabilities to identify, assess, and remediate security gaps effectively. Meanwhile, the Services segment is the fastest-growing, driven by rising adoption of managed vulnerability services, consulting, and support offerings, enabling enterprises, particularly SMEs, to implement robust cybersecurity measures without heavy in-house resources.
By Organization, Large Enterprises Lead Market While SME Fastest Growth
In the Vulnerability Management market, Large Enterprises lead in 2024, holding the largest share due to substantial cybersecurity budgets, regulatory compliance requirements, and the adoption of advanced vulnerability management solutions across complex IT infrastructures. These organizations prioritize proactive security to protect sensitive data and ensure business continuity. Meanwhile, SMEs represent the fastest-growing segment, driven by increasing awareness of cyber threats, digital transformation initiatives, and the adoption of cost-effective, managed vulnerability services that enable smaller organizations to strengthen security without significant in-house expertise.
By Deployment Model, Cloud Lead Market While On-Premises Fastest Growth
In the Vulnerability Management market, the Cloud deployment model leads in 2024, driven by its scalability, ease of deployment, and ability to provide real-time monitoring and updates across distributed IT environments. Cloud solutions are increasingly preferred by enterprises seeking flexible and cost-effective cybersecurity options. Meanwhile, On-Premises deployment is the fastest-growing segment, as large organizations continue to prioritize full control over their security infrastructure, data privacy, and compliance requirements, investing in dedicated on-site solutions for sensitive and mission-critical systems.
By End-User, IT & Telecom Lead Market While Healthcare Fastest Growth
In the Vulnerability Management market, the IT & Telecom sector leads in 2024, driven by high exposure to cyber threats, rapid digital transformation, and the critical need to protect sensitive data and infrastructure. These enterprises adopt comprehensive vulnerability management solutions to ensure network security and business continuity. Meanwhile, the Healthcare sector is the fastest-growing segment, fueled by increasing digitization of patient records, regulatory compliance requirements, and rising cyberattacks targeting sensitive healthcare data, prompting adoption of advanced vulnerability management solutions.
Vulnerability Management Market Region Analysis
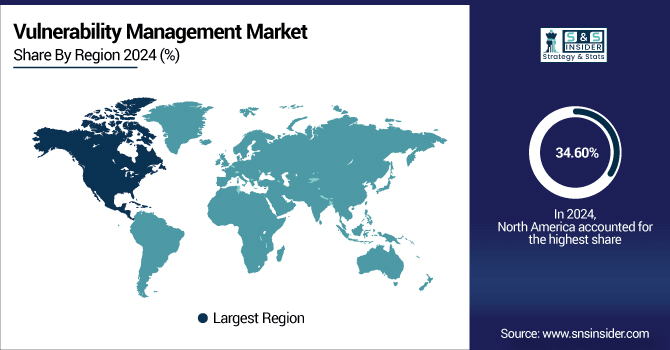
North America Vulnerability management market Insights
North America dominated the global Vulnerability management market in 2024, with over 34.60% revenue share, driven by the high frequency of cyberattacks, stringent regulatory frameworks, and advanced technological infrastructure. Enterprises across BFSI, IT & telecom, and healthcare sectors prioritize proactive cybersecurity to protect sensitive data and ensure compliance with laws such as HIPAA and CCPA. The region’s strong focus on digital transformation, cloud adoption, and threat intelligence solutions further fuels demand for vulnerability management. Leading vendors, including Tenable, Qualys, IBM, and Microsoft, reinforce market growth through innovative solutions and services.
U.S. Dominates Vulnerability management market with Advanced Technological Adoption
The U.S. leads the Vulnerability Management market due to widespread adoption of advanced cybersecurity technologies, high digital transformation, and stringent regulations like HIPAA and CCPA.
Asia-Pacific Vulnerability management market Insights
The Asia-Pacific region is expected to have the fastest-growing CAGR 9.68%, for the Vulnerability management market, driven by rapid digital transformation, increasing cloud adoption, and rising cyber threats across enterprises. Countries like China, India, and Japan are investing heavily in cybersecurity infrastructure to protect sensitive data and comply with emerging regulations. SMEs and large organizations are increasingly adopting cloud-based and managed vulnerability management solutions. The growing internet penetration, IoT deployment, and government initiatives further accelerate market growth, creating significant opportunities for vendors in the region.
China and India Propel Rapid Growth in Vulnerability management market
China and India are driving the fastest growth in the Vulnerability Management market due to rapid digitalization, increasing cloud and IoT adoption, and rising cyber threats. Government initiatives and growing awareness among enterprises further accelerate the adoption of advanced vulnerability management solutions.
Europe Vulnerability management market Insights
Europe holds a significant share in the Vulnerability Management market, driven by strict data protection regulations such as GDPR and growing cybersecurity awareness among enterprises. Organizations across BFSI, IT, healthcare, and manufacturing sectors are adopting advanced vulnerability management solutions to protect sensitive data and ensure compliance. The region benefits from mature technological infrastructure, high cloud adoption, and increasing investments in threat intelligence and automated security tools, supporting steady market growth and creating opportunities for both established vendors and emerging solution providers.
Germany and U.K. Lead Vulnerability management market Expansion Across Europe
Germany and the U.K. are driving market growth in Europe due to strong cybersecurity regulations, advanced IT infrastructure, and high adoption of digital transformation initiatives.
Latin America (LATAM) and Middle East & Africa (MEA) Vulnerability management market Insights
Latin America and Middle East & Africa are emerging regions in the Vulnerability Management market, driven by increasing digital adoption, rising cyber threats, and growing awareness of cybersecurity. Organizations across BFSI, IT, healthcare, and government sectors are investing in advanced vulnerability management solutions to protect sensitive data and comply with evolving regulations. The adoption of cloud-based and managed services.
Vulnerability Management Market Competitive Landscape
Microsoft's Defender Vulnerability Management offers a risk-based approach to discovering, prioritizing, and remediating endpoint vulnerabilities and misconfigurations. The solution provides asset visibility, real-time insights, and automated remediation workflows, seamlessly integrating with other Microsoft security products. This integration enables organizations to manage vulnerabilities across their IT infrastructure effectively, supporting a proactive security strategy.
-
In August 2025, Microsoft released a major Patch Tuesday update addressing 111 security vulnerabilities, including a critical zero-day flaw in Windows Kerberos and a remote access flaw in Azure OpenAI, urging immediate application of the updates to mitigate security risks.
AT&T provides managed vulnerability services through its Managed Vulnerability Program, offering a risk-based approach to vulnerability management. The program delivers comprehensive visibility across on-premises, cloud, web application, and operational technology assets. AT&T's services include threat hunting, vulnerability scanning, and remediation support, tailored to the unique needs of each organization.
-
In March 2024, AT&T experienced a data breach that exposed records of most of its customers' call and text conversations, with the stolen information dating back to 2022 and early 2023.
IBM offers a comprehensive suite of vulnerability management solutions, including IBM Guardium and IBM QRadar Vulnerability Manager. These tools provide organizations with the ability to identify, assess, and remediate vulnerabilities across on-premises and cloud environments. IBM's solutions integrate with its broader security portfolio, enabling centralized visibility and streamlined workflows.
-
In August 2024, IBM issued a security bulletin addressing multiple vulnerabilities in IBM WebSphere Application Server Liberty, including CVE-2024-27268 and CVE-2024-25026, which could lead to denial of service due to specially crafted requests.
Vulnerability Management Market Key Players
Some of the Vulnerability management market Companies are:
-
Tenable, Inc.
-
Qualys, Inc.
-
IBM Corporation
-
Microsoft Corporation
-
Rapid7, Inc.
-
AT&T Inc.
-
Hewlett Packard Enterprise Company
-
Dell Technologies Inc.
-
Broadcom Inc. (Symantec)
-
Cisco Systems, Inc.
-
Oracle Corporation
-
VMware, Inc.
-
McAfee Corp.
-
Trend Micro Incorporated
-
Palo Alto Networks, Inc.
-
Check Point Software Technologies Ltd.
-
CrowdStrike Holdings, Inc.
-
Fortinet, Inc.
-
SonicWall, Inc.
-
Ivanti, Inc.
Report Attributes | Details |
---|---|
Market Size in 2025 | USD 16.35 Billion |
Market Size by 2033 | USD 30.36 Billion |
CAGR | CAGR of 8.07% From 2026 to 2033 |
Base Year | 2025 |
Forecast Period | 2026-2033 |
Historical Data | 2022-2024 |
Report Scope & Coverage | Market Size, Segments Analysis, Competitive Landscape, Regional Analysis, DROC & SWOT Analysis, Forecast Outlook |
Key Segments | • By Component (Solution, Services) • By Organization (SME, Large Enterprises) • By Deployment Model (On-Premises, Cloud) • By End-User (IT & Telecom, BFSI, Healthcare, Retail, Manufacturing, Energy & Utility, Others) |
Regional Analysis/Coverage | North America (US, Canada), Europe (Germany, UK, France, Italy, Spain, Russia, Poland, Rest of Europe), Asia Pacific (China, India, Japan, South Korea, Australia, ASEAN Countries, Rest of Asia Pacific), Middle East & Africa (UAE, Saudi Arabia, Qatar, South Africa, Rest of Middle East & Africa), Latin America (Brazil, Argentina, Mexico, Colombia, Rest of Latin America). |
Company Profiles | Tenable, Inc., Qualys, Inc., IBM Corporation, Microsoft Corporation, Rapid7, Inc., AT&T Inc., Hewlett Packard Enterprise Company, Dell Technologies Inc., Broadcom Inc. (Symantec), Cisco Systems, Inc., Oracle Corporation, VMware, Inc., McAfee Corp., Trend Micro Incorporated, Palo Alto Networks, Inc., Check Point Software Technologies Ltd., CrowdStrike Holdings, Inc., Fortinet, Inc., SonicWall, Inc., Ivanti, Inc., and Others. |
Table Of Contents
1. Introduction
1.1 Market Definition & Scope
1.2 Research Assumptions & Abbreviations
1.3 Research Methodology
2. Executive Summary
2.1 Market Snapshot
2.2 Market Absolute $ Opportunity Assessment & Y-o-Y Analysis, 2021–2032
2.3 Market Size & Forecast, By Segmentation, 2021–2032
2.3.1 Market Size By Component
2.3.2 Market Size By Organization
2.3.3 Market Size By Deployment model
2.3.4 Market Size By End-user
2.4 Market Share & Bps Analysis By Region, 2024
2.5 Industry Growth Scenarios – Conservative, Likely & Optimistic
2.6 Industry CxO’s Perspective
3. Market Overview
3.1 Market Dynamics
3.1.1 Drivers
3.1.2 Restraints
3.1.3 Opportunities
3.1.4 Key Market Trends
3.2 Industry PESTLE Analysis
3.3 Key Industry Forces (Porter’s) Impacting Market Growth
3.4 Industry Supply Chain Analysis
3.4.1 Raw Material Suppliers
3.4.2 Manufacturers
3.4.3 Distributors/Suppliers
3.4.4 Customers/End-Users
3.5 Industry Life Cycle Assessment
3.6 Parent Market Overview
3.7 Market Risk Assessment
4. Statistical Insights & Trends Reporting
4.1 Threat Landscape Analytics
4.1.1 Overview
4.1.2 Average Time to Exploit a Vulnerability Once Discovered (e.g., 30–60 days)
4.1.3 Percentage of Vulnerabilities Remaining Unpatched After 90 Days
4.1.4 Ratio of Known vs Zero-Day Vulnerabilities Detected Across Industries
4.1.5 Most Exploited CVE Categories per Year (Critical, High, Medium)
4.2 Risk Exposure & Prioritization Metrics
4.2.1 Overview
4.2.2 Average Risk Score Reduction After Implementing Vulnerability Management Tools
4.2.3 Percentage of Vulnerabilities Remediated Within First 24–48 Hours of Detection
4.2.4 Ratio of High-Risk vs Low-Risk Vulnerabilities in Enterprise IT Environments
4.2.5 Attack Surface Expansion Metrics Due to Cloud, IoT, or Remote Work Adoption
4.3 Automation & Technology Adoption
4.3.1 Overview
4.3.2 Percentage of Organizations Leveraging AI/ML for Vulnerability Prioritization
4.3.3 Rate of Integration with SIEM, SOAR, and Threat Intelligence Platforms
4.3.4 Automation Level in Vulnerability Scanning and Patching Workflows
4.3.5 Cloud-Native vs Hybrid Deployment Adoption Ratio
4.4 Security & Compliance Efficiency
4.4.1 Overview
4.4.2 Number of Regulatory Non-Compliance Incidents Avoided Due to Vulnerability Management
4.4.3 Average Reduction in Audit Failures for ISO 27001, SOC2, GDPR, HIPAA
4.4.4 Benchmark of Vulnerability Remediation vs Compliance Requirements Across Industries
5. Vulnerability Management Market Segmental Analysis & Forecast, By Component, 2021 – 2032, Value (Usd Billion)
5.1 Introduction
5.2 Solution
5.2.1 Key Trends
5.2.2 Market Size & Forecast, 2021 – 2032
5.3 Services
6. Vulnerability Management Market Segmental Analysis & Forecast, By Organization, 2021 – 2032, Value (Usd Billion)
6.1 Introduction
6.2 SME
6.2.1 Key Trends
6.2.2 Market Size & Forecast, 2021 – 2032
6.3 Large enterprises
7. Vulnerability Management Market Segmental Analysis & Forecast, By Deployment model, 2021 – 2032, Value (Usd Billion)
7.1 Introduction
7.2 Cloud
7.2.1 Key Trends
7.2.2 Market Size & Forecast, 2021 – 2032
7.3 On-premises
8. Vulnerability Management Market Segmental Analysis & Forecast, By End-user, 2021 – 2032, Value (Usd Billion)
8.1 Introduction
8.2 IT & telecom
8.2.1 Key Trends
8.2.2 Market Size & Forecast, 2021 – 2032
8.3 BFSI
8.4 Healthcare
8.5 Retail
8.6 Manufacturing
8.7 Energy & Utility
8.8 Others
9. Vulnerability Management Market Segmental Analysis & Forecast By Region, 2021 – 2025, Value (Usd Billion)
9.1 Introduction
9.2 North America
9.2.1 Key Trends
9.2.2 Vulnerability Management Market Size & Forecast, By Component, 2021 – 2032
9.2.3 Vulnerability Management Market Size & Forecast, By Organization, 2021 – 2032
9.2.4 Vulnerability Management Market Size & Forecast, By Deployment model, 2021 – 2032
9.2.5 Vulnerability Management Market Size & Forecast, By End-user, 2021 – 2032
9.2.6 Vulnerability Management Market Size & Forecast, By Country, 2021 – 2032
9.2.6.1 USA
9.2.6.1.1 Vulnerability Management Market Size & Forecast, By Component, 2021 – 2032
9.2.6.1.2 Vulnerability Management Market Size & Forecast, By Organization, 2021 – 2032
9.2.6.1.3 Vulnerability Management Market Size & Forecast, By Deployment model, 2021 – 2032
9.2.6.1.4 Vulnerability Management Market Size & Forecast, By End-user, 2021 – 2032
9.2.6.2 Canada
9.2.6.2.1 Vulnerability Management Market Size & Forecast, By Component, 2021 – 2032
9.2.6.2.2 Vulnerability Management Market Size & Forecast, By Organization, 2021 – 2032
9.2.6.2.3 Vulnerability Management Market Size & Forecast, By Deployment model, 2021 – 2032
9.2.6.2.4 Vulnerability Management Market Size & Forecast, By End-user, 2021 – 2032
9.3 Europe
9.3.1 Key Trends
9.3.2 Vulnerability Management Market Size & Forecast, By Component, 2021 – 2032
9.3.3 Vulnerability Management Market Size & Forecast, By Organization, 2021 – 2032
9.3.4 Vulnerability Management Market Size & Forecast, By Deployment model, 2021 – 2032
9.3.5 Vulnerability Management Market Size & Forecast, By End-user, 2021 – 2032
9.3.6 Vulnerability Management Market Size & Forecast, By Country, 2021 – 2032
9.3.6.1 Germany
9.3.6.1.1 Vulnerability Management Market Size & Forecast, By Component, 2021 – 2032
9.3.6.1.2 Vulnerability Management Market Size & Forecast, By Organization, 2021 – 2032
9.3.6.1.3 Vulnerability Management Market Size & Forecast, By Deployment model, 2021 – 2032
9.3.6.1.4 Vulnerability Management Market Size & Forecast, By End-user, 2021 – 2032
9.3.6.2 UK
9.3.6.2.1 Vulnerability Management Market Size & Forecast, By Component, 2021 – 2032
9.3.6.2.2 Vulnerability Management Market Size & Forecast, By Organization, 2021 – 2032
9.3.6.2.3 Vulnerability Management Market Size & Forecast, By Deployment model, 2021 – 2032
9.3.6.2.4 Vulnerability Management Market Size & Forecast, By End-user, 2021 – 2032
9.3.6.3 France
9.3.6.3.1 Vulnerability Management Market Size & Forecast, By Component, 2021 – 2032
9.3.6.3.2 Vulnerability Management Market Size & Forecast, By Organization, 2021 – 2032
9.3.6.3.3 Vulnerability Management Market Size & Forecast, By Deployment model, 2021 – 2032
9.3.6.3.4 Vulnerability Management Market Size & Forecast, By End-user, 2021 – 2032
9.3.6.4 Italy
9.3.6.4.1 Vulnerability Management Market Size & Forecast, By Component, 2021 – 2032
9.3.6.4.2 Vulnerability Management Market Size & Forecast, By Organization, 2021 – 2032
9.3.6.4.3 Vulnerability Management Market Size & Forecast, By Deployment model, 2021 – 2032
9.3.6.4.4 Vulnerability Management Market Size & Forecast, By End-user, 2021 – 2032
9.3.6.5 Spain
9.3.6.5.1 Vulnerability Management Market Size & Forecast, By Component, 2021 – 2032
9.3.6.5.2 Vulnerability Management Market Size & Forecast, By Organization, 2021 – 2032
9.3.6.5.3 Vulnerability Management Market Size & Forecast, By Deployment model, 2021 – 2032
9.3.6.5.4 Vulnerability Management Market Size & Forecast, By End-user, 2021 – 2032
9.3.6.6 Russia
9.3.6.6.1 Vulnerability Management Market Size & Forecast, By Component, 2021 – 2032
9.3.6.6.2 Vulnerability Management Market Size & Forecast, By Organization, 2021 – 2032
9.3.6.6.3 Vulnerability Management Market Size & Forecast, By Deployment model, 2021 – 2032
9.3.6.6.4 Vulnerability Management Market Size & Forecast, By End-user, 2021 – 2032
9.3.6.7 Poland
9.3.6.7.1 Vulnerability Management Market Size & Forecast, By Component, 2021 – 2032
9.3.6.7.2 Vulnerability Management Market Size & Forecast, By Organization, 2021 – 2032
9.3.6.7.3 Vulnerability Management Market Size & Forecast, By Deployment model, 2021 – 2032
9.3.6.7.4 Vulnerability Management Market Size & Forecast, By End-user, 2021 – 2032
9.3.6.8 Rest of Europe
9.3.6.8.1 Vulnerability Management Market Size & Forecast, By Component, 2021 – 2032
9.3.6.8.2 Vulnerability Management Market Size & Forecast, By Organization, 2021 – 2032
9.3.6.8.3 Vulnerability Management Market Size & Forecast, By Deployment model, 2021 – 2032
9.3.6.8.4 Vulnerability Management Market Size & Forecast, By End-user, 2021 – 2032
9.4 Asia-Pacific
9.4.1 Key Trends
9.4.2 Vulnerability Management Market Size & Forecast, By Component, 2021 – 2032
9.4.3 Vulnerability Management Market Size & Forecast, By Organization, 2021 – 2032
9.4.4 Vulnerability Management Market Size & Forecast, By Deployment model, 2021 – 2032
9.4.5 Vulnerability Management Market Size & Forecast, By End-user, 2021 – 2032
9.4.6 Vulnerability Management Market Size & Forecast, By Country, 2021 – 2032
9.4.6.1 China
9.4.6.1.1 Vulnerability Management Market Size & Forecast, By Component, 2021 – 2032
9.4.6.1.2 Vulnerability Management Market Size & Forecast, By Organization, 2021 – 2032
9.4.6.1.3 Vulnerability Management Market Size & Forecast, By Deployment model, 2021 – 2032
9.4.6.1.4 Vulnerability Management Market Size & Forecast, By End-user, 2021 – 2032
9.4.6.2 India
9.4.6.2.1 Vulnerability Management Market Size & Forecast, By Component, 2021 – 2032
9.4.6.2.2 Vulnerability Management Market Size & Forecast, By Organization, 2021 – 2032
9.4.6.2.3 Vulnerability Management Market Size & Forecast, By Deployment model, 2021 – 2032
9.4.6.2.4 Vulnerability Management Market Size & Forecast, By End-user, 2021 – 2032
9.4.6.3 Japan
9.4.6.3.1 Vulnerability Management Market Size & Forecast, By Component, 2021 – 2032
9.4.6.3.2 Vulnerability Management Market Size & Forecast, By Organization, 2021 – 2032
9.4.6.3.3 Vulnerability Management Market Size & Forecast, By Deployment model, 2021 – 2032
9.4.6.3.4 Vulnerability Management Market Size & Forecast, By End-user, 2021 – 2032
9.4.6.4 South Korea
9.4.6.4.1 Vulnerability Management Market Size & Forecast, By Component, 2021 – 2032
9.4.6.4.2 Vulnerability Management Market Size & Forecast, By Organization, 2021 – 2032
9.4.6.4.3 Vulnerability Management Market Size & Forecast, By Deployment model, 2021 – 2032
9.4.6.4.4 Vulnerability Management Market Size & Forecast, By End-user, 2021 – 2032
9.4.6.5 Australia
9.4.6.5.1 Vulnerability Management Market Size & Forecast, By Component, 2021 – 2032
9.4.6.5.2 Vulnerability Management Market Size & Forecast, By Organization, 2021 – 2032
9.4.6.5.3 Vulnerability Management Market Size & Forecast, By Deployment model, 2021 – 2032
9.4.6.5.4 Vulnerability Management Market Size & Forecast, By End-user, 2021 – 2032
9.4.6.6 ASEAN Countries
9.4.6.6.1 Vulnerability Management Market Size & Forecast, By Component, 2021 – 2032
9.4.6.6.2 Vulnerability Management Market Size & Forecast, By Organization, 2021 – 2032
9.4.6.6.3 Vulnerability Management Market Size & Forecast, By Deployment model, 2021 – 2032
9.4.6.6.4 Vulnerability Management Market Size & Forecast, By End-user, 2021 – 2032
9.4.6.7 Rest of Asia-Pacific
9.4.6.7.1 Vulnerability Management Market Size & Forecast, By Component, 2021 – 2032
9.4.6.7.2 Vulnerability Management Market Size & Forecast, By Organization, 2021 – 2032
9.4.6.7.3 Vulnerability Management Market Size & Forecast, By Deployment model, 2021 – 2032
9.4.6.7.4 Vulnerability Management Market Size & Forecast, By End-user, 2021 – 2032
9.5 Latin America
9.5.1 Key Trends
9.5.2 Vulnerability Management Market Size & Forecast, By Component, 2021 – 2032
9.5.3 Vulnerability Management Market Size & Forecast, By Organization, 2021 – 2032
9.5.4 Vulnerability Management Market Size & Forecast, By Deployment model, 2021 – 2032
9.5.5 Vulnerability Management Market Size & Forecast, By End-user, 2021 – 2032
9.5.6 Vulnerability Management Market Size & Forecast, By Country, 2021 – 2032
9.5.6.1 Brazil
9.5.6.1.1 Vulnerability Management Market Size & Forecast, By Component, 2021 – 2032
9.5.6.1.2 Vulnerability Management Market Size & Forecast, By Organization, 2021 – 2032
9.5.6.1.3 Vulnerability Management Market Size & Forecast, By Deployment model, 2021 – 2032
9.5.6.1.4 Vulnerability Management Market Size & Forecast, By End-user, 2021 – 2032
9.5.6.2 Argentina
9.5.6.2.1 Vulnerability Management Market Size & Forecast, By Component, 2021 – 2032
9.5.6.2.2 Vulnerability Management Market Size & Forecast, By Organization, 2021 – 2032
9.5.6.2.3 Vulnerability Management Market Size & Forecast, By Deployment model, 2021 – 2032
9.5.6.2.4 Vulnerability Management Market Size & Forecast, By End-user, 2021 – 2032
9.5.6.3 Mexico
9.5.6.3.1 Vulnerability Management Market Size & Forecast, By Component, 2021 – 2032
9.5.6.3.2 Vulnerability Management Market Size & Forecast, By Organization, 2021 – 2032
9.5.6.3.3 Vulnerability Management Market Size & Forecast, By Deployment model, 2021 – 2032
9.5.6.3.4 Vulnerability Management Market Size & Forecast, By End-user, 2021 – 2032
9.5.6.4 Colombia
9.5.6.4.1 Vulnerability Management Market Size & Forecast, By Component, 2021 – 2032
9.5.6.4.2 Vulnerability Management Market Size & Forecast, By Organization, 2021 – 2032
9.5.6.4.3 Vulnerability Management Market Size & Forecast, By Deployment model, 2021 – 2032
9.5.6.4.4 Vulnerability Management Market Size & Forecast, By End-user, 2021 – 2032
9.5.6.5 Rest of Latin America
9.5.6.5.1 Vulnerability Management Market Size & Forecast, By Component, 2021 – 2032
9.5.6.5.2 Vulnerability Management Market Size & Forecast, By Organization, 2021 – 2032
9.5.6.5.3 Vulnerability Management Market Size & Forecast, By Deployment model, 2021 – 2032
9.5.6.5.4 Vulnerability Management Market Size & Forecast, By End-user, 2021 – 2032
9.6 Middle East & Africa
9.6.1 Key Trends
9.6.2 Vulnerability Management Market Size & Forecast, By Component, 2021 – 2032
9.6.3 Vulnerability Management Market Size & Forecast, By Organization, 2021 – 2032
9.6.4 Vulnerability Management Market Size & Forecast, By Deployment model, 2021 – 2032
9.6.5 Vulnerability Management Market Size & Forecast, By End-user, 2021 – 2032
9.6.6 Vulnerability Management Market Size & Forecast, By Country, 2021 – 2032
9.6.6.1 UAE
9.6.6.1.1 Vulnerability Management Market Size & Forecast, By Component, 2021 – 2032
9.6.6.1.2 Vulnerability Management Market Size & Forecast, By Organization, 2021 – 2032
9.6.6.1.3 Vulnerability Management Market Size & Forecast, By Deployment model, 2021 – 2032
9.6.6.1.4 Vulnerability Management Market Size & Forecast, By End-user, 2021 – 2032
9.6.6.2 Saudi Arabia
9.6.6.2.1 Vulnerability Management Market Size & Forecast, By Component, 2021 – 2032
9.6.6.2.2 Vulnerability Management Market Size & Forecast, By Organization, 2021 – 2032
9.6.6.2.3 Vulnerability Management Market Size & Forecast, By Deployment model, 2021 – 2032
9.6.6.2.4 Vulnerability Management Market Size & Forecast, By End-user, 2021 – 2032
9.6.6.3 Qatar
9.6.6.3.1 Vulnerability Management Market Size & Forecast, By Component, 2021 – 2032
9.6.6.3.2 Vulnerability Management Market Size & Forecast, By Organization, 2021 – 2032
9.6.6.3.3 Vulnerability Management Market Size & Forecast, By Deployment model, 2021 – 2032
9.6.6.3.4 Vulnerability Management Market Size & Forecast, By End-user, 2021 – 2032
9.6.6.4 Egypt
9.6.6.4.1 Vulnerability Management Market Size & Forecast, By Component, 2021 – 2032
9.6.6.4.2 Vulnerability Management Market Size & Forecast, By Organization, 2021 – 2032
9.6.6.4.3 Vulnerability Management Market Size & Forecast, By Deployment model, 2021 – 2032
9.6.6.4.4 Vulnerability Management Market Size & Forecast, By End-user, 2021 – 2032
9.6.6.5 South Africa
9.6.6.5.1 Vulnerability Management Market Size & Forecast, By Component, 2021 – 2032
9.6.6.5.2 Vulnerability Management Market Size & Forecast, By Organization, 2021 – 2032
9.6.6.5.3 Vulnerability Management Market Size & Forecast, By Deployment model, 2021 – 2032
9.6.6.5.4 Vulnerability Management Market Size & Forecast, By End-user, 2021 – 2032
9.6.6.6 Rest of Middle East & Africa
9.6.6.6.1 Vulnerability Management Market Size & Forecast, By Component, 2021 – 2032
9.6.6.6.2 Vulnerability Management Market Size & Forecast, By Organization, 2021 – 2032
9.6.6.6.3 Vulnerability Management Market Size & Forecast, By Deployment model, 2021 – 2032
9.6.6.6.4 Vulnerability Management Market Size & Forecast, By End-user, 2021 – 2032
10. Competitive Landscape
10.1 Key Players' Positioning
10.2 Competitive Developments
10.2.1 Key Strategies Adopted (%), By Key Players, 2024
10.2.2 Year-Wise Strategies & Development, 2021 – 2025
10.2.3 Number Of Strategies Adopted By Key Players, 2024
10.3 Market Share Analysis, 2024
10.4 Product/Service & Application Benchmarking
10.4.1 Product/Service Specifications & Features By Key Players
10.4.2 Product/Service Heatmap By Key Players
10.4.3 Application Heatmap By Key Players
10.5 Industry Start-Up & Innovation Landscape
10.6 Key Company Profiles
10.6.1 Tenable, Inc.
10.6.1.1 Company Overview & Snapshot
10.6.1.2 Product/Service Portfolio
10.6.1.3 Key Company Financials
10.6.1.4 SWOT Analysis
10.6.2 Qualys, Inc.
10.6.3 IBM Corporation
10.6.4 Microsoft Corporation
10.6.5 Rapid7, Inc.
10.6.6 AT&T Inc.
10.6.7 Hewlett Packard Enterprise Company
10.6.8 Dell Technologies Inc.
10.6.9 Broadcom Inc. (Symantec)
10.6.10 Cisco Systems, Inc.
10.6.11 Oracle Corporation
10.6.12 VMware, Inc.
10.6.13 McAfee Corp.
10.6.14 Trend Micro Incorporated
10.6.15 Palo Alto Networks, Inc.
10.6.16 Check Point Software Technologies Ltd.
10.6.17 CrowdStrike Holdings, Inc.
10.6.18 Fortinet, Inc.
10.6.19 SonicWall, Inc.
10.6.20 Ivanti, Inc.
11. Analyst Recommendations
11.1 SNS Insider Opportunity Map
11.2 Industry Low-Hanging Fruit Assessment
11.3 Market Entry & Growth Strategy
11.4 Analyst Viewpoint & Suggestions on Market Growth
12. Assumptions
13. Disclaimer
14. Appendix
14.1 List Of Tables
14.2 List Of Figures
Key Segments:
By Component
-
Solution
-
Services
By Organization
-
SME
-
Large enterprises
By Deployment model
-
Cloud
-
On-premises
By End-user
-
IT & telecom
-
BFSI
-
Healthcare
-
Retail
-
Manufacturing
-
Energy & Utility
-
Others
Request for Segment Customization as per your Business Requirement: Segment Customization Request
Regional Coverage:
North America
-
US
-
Canada
Europe
-
Germany
-
UK
-
France
-
Italy
-
Spain
-
Russia
-
Poland
-
Rest of Europe
Asia Pacific
-
China
-
India
-
Japan
-
South Korea
-
Australia
-
ASEAN Countries
-
Rest of Asia Pacific
Middle East & Africa
-
UAE
-
Saudi Arabia
-
Qatar
-
South Africa
-
Rest of Middle East & Africa
Latin America
-
Brazil
-
Argentina
-
Mexico
-
Colombia
-
Rest of Latin America
Request for Country Level Research Report: Country Level Customization Request
Available Customization
With the given market data, SNS Insider offers customization as per the company’s specific needs. The following customization options are available for the report:
-
Detailed Volume Analysis
-
Criss-Cross segment analysis (e.g. Product X Application)
-
Competitive Product Benchmarking
-
Geographic Analysis
-
Additional countries in any of the regions
-
Customized Data Representation
-
Detailed analysis and profiling of additional market players
An accurate research report requires proper strategizing as well as implementation. There are multiple factors involved in the completion of good and accurate research report and selecting the best methodology to compete the research is the toughest part. Since the research reports we provide play a crucial role in any company’s decision-making process, therefore we at SNS Insider always believe that we should choose the best method which gives us results closer to reality. This allows us to reach at a stage wherein we can provide our clients best and accurate investment to output ratio.
Each report that we prepare takes a timeframe of 350-400 business hours for production. Starting from the selection of titles through a couple of in-depth brain storming session to the final QC process before uploading our titles on our website we dedicate around 350 working hours. The titles are selected based on their current market cap and the foreseen CAGR and growth.
The 5 steps process:
Step 1: Secondary Research:
Secondary Research or Desk Research is as the name suggests is a research process wherein, we collect data through the readily available information. In this process we use various paid and unpaid databases which our team has access to and gather data through the same. This includes examining of listed companies’ annual reports, Journals, SEC filling etc. Apart from this our team has access to various associations across the globe across different industries. Lastly, we have exchange relationships with various university as well as individual libraries.

Step 2: Primary Research
When we talk about primary research, it is a type of study in which the researchers collect relevant data samples directly, rather than relying on previously collected data. This type of research is focused on gaining content specific facts that can be sued to solve specific problems. Since the collected data is fresh and first hand therefore it makes the study more accurate and genuine.
We at SNS Insider have divided Primary Research into 2 parts.
Part 1 wherein we interview the KOLs of major players as well as the upcoming ones across various geographic regions. This allows us to have their view over the market scenario and acts as an important tool to come closer to the accurate market numbers. As many as 45 paid and unpaid primary interviews are taken from both the demand and supply side of the industry to make sure we land at an accurate judgement and analysis of the market.
This step involves the triangulation of data wherein our team analyses the interview transcripts, online survey responses and observation of on filed participants. The below mentioned chart should give a better understanding of the part 1 of the primary interview.

Part 2: In this part of primary research the data collected via secondary research and the part 1 of the primary research is validated with the interviews from individual consultants and subject matter experts.
Consultants are those set of people who have at least 12 years of experience and expertise within the industry whereas Subject Matter Experts are those with at least 15 years of experience behind their back within the same space. The data with the help of two main processes i.e., FGDs (Focused Group Discussions) and IDs (Individual Discussions). This gives us a 3rd party nonbiased primary view of the market scenario making it a more dependable one while collation of the data pointers.
Step 3: Data Bank Validation
Once all the information is collected via primary and secondary sources, we run that information for data validation. At our intelligence centre our research heads track a lot of information related to the market which includes the quarterly reports, the daily stock prices, and other relevant information. Our data bank server gets updated every fortnight and that is how the information which we collected using our primary and secondary information is revalidated in real time.

Step 4: QA/QC Process
After all the data collection and validation our team does a final level of quality check and quality assurance to get rid of any unwanted or undesired mistakes. This might include but not limited to getting rid of the any typos, duplication of numbers or missing of any important information. The people involved in this process include technical content writers, research heads and graphics people. Once this process is completed the title gets uploader on our platform for our clients to read it.
Step 5: Final QC/QA Process:
This is the last process and comes when the client has ordered the study. In this process a final QA/QC is done before the study is emailed to the client. Since we believe in giving our clients a good experience of our research studies, therefore, to make sure that we do not lack at our end in any way humanly possible we do a final round of quality check and then dispatch the study to the client.