Water as a Fuel Market Report Scope & Overview:
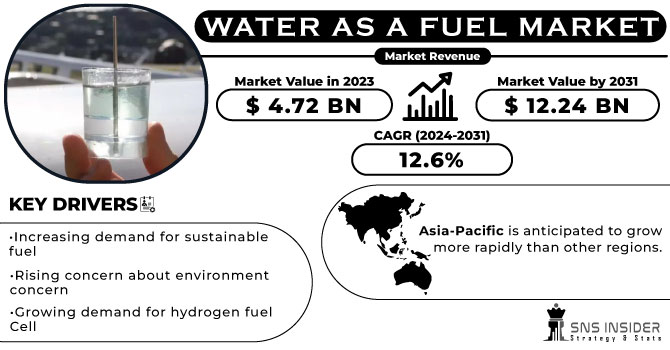
The Water as a Fuel Market size was valued at USD 5.31 billion in 2024 and is expected to grow to USD 13.73 billion by 2032 and grow at a CAGR of 12.6 % over the forecast period of 2025-2032.
Hydrogen is completely oxidized in water. Although hydrogen is a highly energetic and combustible gas by itself, the formation of water releases some of hydrogen's useful energy. Water won't hurt you. Water can be electrolyzed into hydrogen and oxygen, however the energy required to break up a water molecule is equal to the energy generated during the oxidation of the hydrogen to form water.
Get More Information on Water as a Fuel Market - Request Sample Report
Water as a Fuel Market Size and Forecast:
-
Market Size in 2024: USD 5.31 Billion
-
Market Size by 2032: USD 13.73 Billion
-
CAGR: 12.6% from 2025 to 2032
-
Base Year: 2024
-
Forecast Period: 2025–2032
-
Historical Data: 2021–2023
Key trends in the Water as a Fuel Market:
-
Growing adoption of hydrogen fuel cells for clean transportation solutions.
-
Rising investment in large-scale green hydrogen production through electrolysis.
-
Integration of carbon capture technologies in natural gas reforming processes.
-
Development of portable oxyhydrogen systems for industrial and niche applications.
-
Expansion of renewable energy-powered hydrogen generation projects.
-
Shift toward cost-efficient, high-efficiency electrolyzer product innovations.
-
Strategic collaborations between energy, automotive, and technology companies.
-
Government-backed decarbonization policies and subsidies accelerating adoption.
Then, each of them would need to be isolated in different tanks. A combustion device that could combine and ignite them or a fuel cell that could recombine them to produce power would then be required. The car may then be moved by using the energy that was released to power a motor or a piston.
A car that is "water-fuelled" is one that, in theory, gets all of its power from water. Numerous worldwide patents, newspaper and popular scientific magazine articles, local television news coverage, and websites have all discussed water-fuelled automobiles. These gadgets' claims have been debunked as pseudoscience, and some of them have even been linked to investment scams. Some say that these vehicles can create gasoline from water on board without the use of external energy or it might be a hybrid that claims to get some of its energy from water in addition to a conventional source (like gasoline) on board with no further energy input.
Water as a Fuel Market Drivers:
-
Growing demand for hydrogen adoption in transportation and industrial processes.
-
Advancements in electrolyzer technologies improving hydrogen production efficiency.
-
Government policies and investments supporting decarbonization initiatives.
The increasing demand for hydrogen as a clean energy carrier is driving the growth of the Water as a Fuel Market. Hydrogen plays a crucial role in decarbonization by reducing carbon emissions in sectors such as transportation, power generation, and industrial applications. Product developments, such as high-efficiency electrolyzers and hydrogen fuel cells, are making hydrogen production scalable and cost-effective. These technological improvements, combined with government incentives and investments, are accelerating adoption. As industries shift toward renewable and sustainable energy sources, hydrogen’s role as a primary energy vector cements its dominance, directly fueling the expansion of the Water as a Fuel Market.
Water as a Fuel Market Restraints:
-
High production costs of hydrogen and related infrastructure.
-
Challenges in large-scale storage and distribution.
-
Limited commercial-scale adoption compared to conventional fuels.
Despite hydrogen’s promise, the Water as a Fuel Market faces restraints due to high production costs and underdeveloped infrastructure. Electrolysis, the dominant method for green hydrogen production, requires substantial energy input and remains more expensive than fossil-based alternatives. Additionally, large-scale storage and transportation solutions for hydrogen present technical and safety challenges. These factors limit immediate scalability and raise concerns among investors and end users. Until costs are reduced and infrastructure matures, adoption will remain slower compared to traditional energy sources, restraining the market’s growth trajectory despite strong policy and environmental support.
Water as a Fuel Market Opportunities:
-
Rising investments in green hydrogen projects worldwide.
-
Integration of hydrogen in renewable energy storage systems.
-
Government subsidies and corporate commitments for net-zero emissions.
The Water as a Fuel Market is poised for significant opportunity due to the rapid scale-up of green hydrogen projects. Governments and corporations worldwide are investing in electrolyzer capacity, renewable-powered hydrogen plants, and infrastructure to support clean fuel adoption. This shift is not only aligned with global decarbonization targets but also supports energy security and grid stability by integrating hydrogen into renewable storage systems. Recent developments in hydrogen-powered mobility and industrial applications showcase its versatility. These advancements open new growth avenues, positioning hydrogen as a cornerstone for the future global energy ecosystem.
Water as a Fuel Market Segmentation Analysis:
By Fuel Type, Hydrogen Segment Dominates Water as a Fuel Market with 47% Share in 2024, Oxyhydrogen Segment to Record Fastest Growth with 9.55% CAGR
In 2024, the Hydrogen segment commands 47% of the revenue share, making it the leading segment in the Water as a Fuel Market. The dominance arises because large-scale adoption of hydrogen fuel in transportation, industrial processes, and energy storage reduces carbon emissions, directly aligning with decarbonization goals. Ongoing product developments, such as high-efficiency electrolyzers and hydrogen fuel cells, enhance scalability and cost-effectiveness. This growing application base strengthens hydrogen’s pivotal role in advancing the Water as a Fuel Market globally. The Oxyhydrogen segment is projected to grow at a robust CAGR of 9.55% during the forecast period, driven by its niche but expanding applications in welding, metal cutting, and clean combustion processes. This growth results from increased R&D investments that enhance oxyhydrogen generators’ efficiency and safety, fostering broader industrial acceptance. Product development in portable and energy-efficient oxyhydrogen systems complements sustainability initiatives. Consequently, the segment’s expansion directly contributes to the diversification and innovation within the Water as a Fuel Market.
By Technology, Electrolysis Leads with 53% Share, Driving Green Hydrogen Adoption in 2024, Natural Gas Reforming Emerges as Fastest-Growing Technology with 8.4% CAGR
In 2024, Electrolysis leads with a 53% market share, underpinned by its role in producing green hydrogen from renewable electricity and water. The dominance is due to rising government incentives and clean energy targets, creating large-scale adoption opportunities across industries. Advancements in proton exchange membrane (PEM) and alkaline electrolyzers are making hydrogen production more efficient and cost-competitive. These product innovations accelerate the Water as a Fuel Market’s transition toward sustainability, establishing electrolysis as a cornerstone technology in hydrogen generation. The Natural Gas Reforming segment is anticipated to grow at a CAGR of 8.4% during the forecast period, reflecting its ability to provide hydrogen at scale and lower initial costs compared to other methods. This growth stems from increasing demand in industrial sectors where immediate hydrogen adoption is needed. Product developments in carbon capture and storage (CCS) technologies are mitigating emission concerns, ensuring reforming remains a viable transitional solution. As a result, this segment accelerates broader adoption within the Water as a Fuel Market.
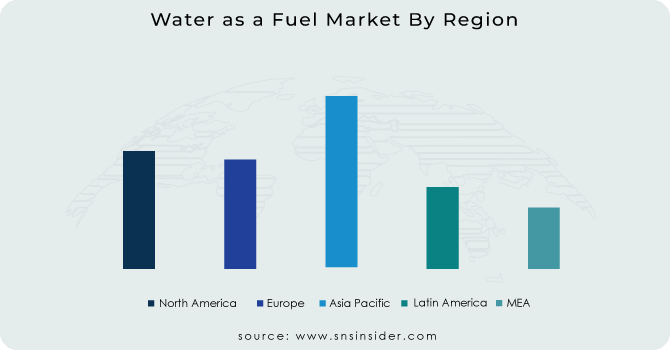
Water as a Fuel Market Regional Insights:
North America Dominates Water as a Fuel Market in 2024
In 2024, North America commands an estimated 38% share of the Water as a Fuel Market, solidifying its leadership position. The region’s dominance is fueled by large-scale hydrogen infrastructure investments, strong decarbonization policies, and the integration of clean fuel technologies across transportation and industry. Federal and state-level funding for hydrogen hubs, combined with robust R&D ecosystems, accelerate commercialization. With industries pushing toward carbon neutrality and corporations actively investing in electrolyzers and fuel cell technologies, North America continues to drive global innovation and adoption of water-derived fuels.
-
United States Leads North America’s Water as a Fuel Market
The United States dominates due to its aggressive clean energy policies, extensive hydrogen infrastructure projects, and corporate commitments to sustainability. The Department of Energy’s Hydrogen Shot Initiative and state-level incentives fuel adoption across industrial, transportation, and power sectors. U.S.-based companies are pioneering advancements in electrolyzers, fuel cells, and carbon capture integration, ensuring strong technological leadership. With mobility, industrial decarbonization, and large-scale renewable projects as key applications, the U.S. secures its position as the leading country in North America’s Water as a Fuel Market in 2024.
Asia Pacific is the Fastest-Growing Region in Water as a Fuel Market in 2024
The Asia Pacific Water as a Fuel Market is projected to grow at a robust CAGR of 14.2% from 2025 to 2032. This growth is fueled by rapid industrialization, expanding renewable energy infrastructure, and government-backed hydrogen policies across key economies. Increasing adoption of hydrogen in transportation, heavy industries, and energy storage enhances the region’s growth trajectory. Countries like China, Japan, and South Korea are making large-scale investments in electrolyzers, hydrogen refueling stations, and fuel cell vehicles, making Asia Pacific a crucial driver of global hydrogen market expansion.
-
China Leads Asia Pacific’s Water as a Fuel Market
China dominates due to its aggressive hydrogen development roadmap, large-scale renewable energy projects, and government commitments to achieve carbon neutrality by 2060. Companies like Sinopec are building nationwide hydrogen refueling station networks, while state-owned enterprises are investing heavily in electrolysis technologies. With its vast renewable base, China can produce cost-efficient green hydrogen, supporting industrial, transportation, and export markets. Coupled with strong R&D funding and a rapidly growing fuel cell vehicle fleet, China emerges as the undisputed leader of the Asia Pacific Water as a Fuel Market in 2024.
Europe Water as a Fuel Market Insights, 2024
Europe demonstrates strong growth in the Water as a Fuel Market in 2024, driven by ambitious EU sustainability mandates and hydrogen strategies. The European Union’s Green Deal supports electrolysis expansion and large-scale hydrogen infrastructure.
-
Germany Leads Europe’s Water as a Fuel Market
Germany dominates due to its leadership in renewable energy integration, advanced R&D, and significant subsidies for green hydrogen projects. The country’s industrial base, especially in automotive and heavy manufacturing, accelerates hydrogen adoption across mobility and industry. German hydrogen innovation hubs and strong EU policy alignment make Germany the central driver of Europe’s Water as a Fuel Market in 2024.
Middle East & Africa and Latin America Water as a Fuel Market Insights, 2024
The Water as a Fuel Market in the Middle East & Africa and Latin America is witnessing steady growth in 2024, supported by renewable energy availability and decarbonization efforts. In the Middle East, Saudi Arabia and the UAE are leading with mega-projects like NEOM, aiming to become global exporters of green hydrogen. In Africa, South Africa is advancing hydrogen adoption in mining and energy. In Latin America, Chile leads with solar-powered hydrogen projects, while Brazil leverages wind and hydropower for cost-effective hydrogen production. Together, these regions strengthen global supply capabilities.
Get Customised Report as per Your Business Requirement - Enquire Now
Competitive Landscape for the Water as a Fuel Market:
Exxon Mobil Corporation
Exxon Mobil Corporation is a U.S.-based global energy leader with a diversified portfolio across oil, natural gas, and emerging clean fuels. The company is increasingly investing in hydrogen and water-derived fuel technologies as part of its long-term decarbonization strategy. Its role in the Water as a Fuel Market is vital, leveraging large-scale infrastructure, advanced R&D, and global partnerships to scale hydrogen production. ExxonMobil focuses on building low-carbon value chains, enabling cleaner industrial processes, and driving adoption in mobility and energy storage applications.
-
In 2025, Exxon Mobil Corporation announced a large-scale water-to-hydrogen project in Texas, targeting industrial decarbonization and clean transportation solutions.
Air Liquide
Air Liquide is a France-based multinational specializing in industrial gases and clean energy technologies, with extensive expertise in hydrogen production and distribution. The company is pioneering large-scale electrolysis projects that link renewable electricity with water-to-hydrogen systems. Its role in the Water as a Fuel Market is significant, as it develops infrastructure, enhances fuel cell supply chains, and fosters adoption across transport, power generation, and industrial sectors. Air Liquide’s strong innovation pipeline and global footprint reinforce its position as a key enabler of clean fuel markets.
-
In 2025, Air Liquide commissioned a major green hydrogen plant in Europe, powered by water electrolysis, to expand regional clean energy supply.
Ørsted A/S
Ørsted A/S, headquartered in Denmark, is a global renewable energy leader, widely recognized for offshore wind and clean power solutions. The company has expanded into hydrogen and water-to-fuel systems, combining renewable electricity with electrolysis to produce green hydrogen at scale. Its role in the Water as a Fuel Market is critical, bridging sustainable power generation with clean fuel technologies. Ørsted actively partners with utilities and governments to integrate water-derived fuels into industrial operations, mobility, and energy storage, strengthening the transition toward net-zero economies.
-
In 2025, Ørsted launched a joint offshore wind-to-hydrogen project in Northern Europe, aimed at supplying green hydrogen for heavy industry.
FuelCell Energy, Inc.
FuelCell Energy, Inc. is a U.S.-based clean energy company specializing in advanced fuel cell platforms and electrolyzer technologies. The company develops scalable solutions that produce hydrogen from water while enabling efficient power generation and storage. Its role in the Water as a Fuel Market is substantial, as it provides next-generation clean energy systems for industrial, commercial, and transportation applications. By combining innovation in solid oxide electrolyzers with carbon-neutral strategies, FuelCell Energy accelerates the adoption of water-derived fuels worldwide.
-
In 2025, FuelCell Energy introduced a next-generation electrolyzer system designed to boost hydrogen production efficiency from water for global clean energy markets.
Water as a Fuel Market Key Players:
-
Exxon Mobil Corporation
-
Air Liquide
-
Ørsted A/S
-
FuelCell Energy, Inc.
-
Panasonic Corporation
-
China Petroleum & Chemical Corporation (Sinopec)
-
Iberdrola S.A.
-
Plug Power Inc.
-
Linde plc
-
Enel Green Power S.p.A.
-
Ballard Power Systems
-
Bloom Energy
-
AFC Energy Plc
-
ITM Power
-
Hydrogenics Corporation
-
Heliogen
-
Enapter
-
SFC Energy AG
-
Siemens AG
-
McPhy Energy
Iberdrola S.A-Company Financial Analysis
| Report Attributes | Details |
| Market Size in 2024 | US$ 5.31 Bn |
| Market Size by 2032 | US$ 13.73 Bn |
| CAGR | CAGR of 12.6 % From 2025 to 2032 |
| Base Year | 2024 |
| Forecast Period | 2025-2032 |
| Historical Data | 2021-2023 |
| Report Scope & Coverage | Market Size, Segments Analysis, Competitive Landscape, Regional Analysis, DROC & SWOT Analysis, Forecast Outlook |
| Key Segments | • By Fuel Type (Hydrogen, Oxyhydrogen) • By Technology (Electrolysis, Natural Gas Reforming) |
| Regional Analysis/Coverage | North America (US, Canada, Mexico), Europe (Eastern Europe [Poland, Romania, Hungary, Turkey, Rest of Eastern Europe] Western Europe] Germany, France, UK, Italy, Spain, Netherlands, Switzerland, Austria, Rest of Western Europe]), Asia Pacific (China, India, Japan, South Korea, Vietnam, Singapore, Australia, Rest of Asia Pacific), Middle East & Africa (Middle East [UAE, Egypt, Saudi Arabia, Qatar, Rest of Middle East], Africa [Nigeria, South Africa, Rest of Africa], Latin America (Brazil, Argentina, Colombia, Rest of Latin America) |
| Company Profiles | Enel Green Power Spa, Iberdrola S.A., China Petroleum & Chemical Corporation, Linde plc, Air Liquide, ExxonMobil, Plug Power Inc., FuelCell Energy Inc, Panasonic, Orsted A/S |
Get in Touch
