Water Quality Sensor Market Report Scope & Overview:
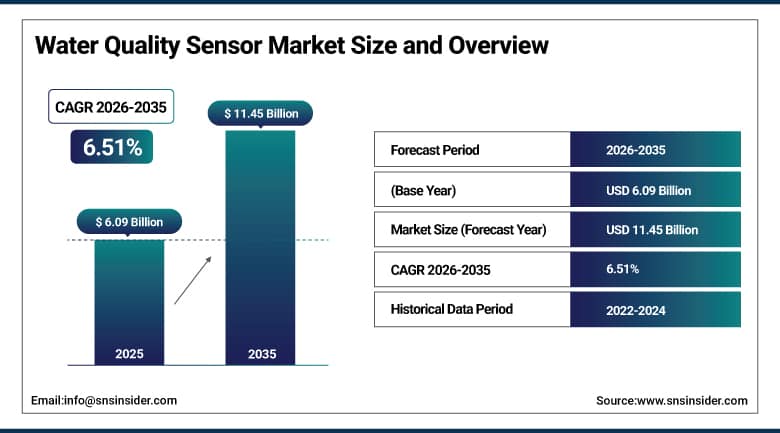
The Water Quality Sensor Market was valued at USD 6.09 billion in 2025 and is expected to reach USD 11.45 billion by 2035, growing at a CAGR of 6.51% from 2026–2035.
The global water quality sensor market is at the intersection of two urgent global imperatives, the worsening freshwater scarcity crisis affecting approximately 2 billion people worldwide and the escalating threat of industrial and agricultural contamination to water sources that billions depend on for drinking, food production, and ecosystem health. Water quality sensors provide the real-time analytical intelligence that water utilities, industrial operations, environmental agencies, and aquaculture businesses require to detect contamination events, maintain treatment process compliance, optimise chemical dosing, and document regulatory compliance across an expanding array of monitored parameters including pH, turbidity, dissolved oxygen, total organic carbon, chlorine residual, heavy metals, nitrates, phosphates, and microbiological indicators. The market is being driven by a powerful combination of tightening global water quality regulations, growing frequency of industrial discharge contamination events prompting continuous monitoring investment, advances in electrochemical and optical sensor technologies dramatically improving measurement accuracy and sensor longevity, and the integration of IoT connectivity and cloud analytics platforms that transform point measurements into network-scale water quality intelligence systems.
The surge in industrial water discharge incidents globally, combined with increasing detection of emerging contaminants including PFAS compounds, microplastics, and pharmaceutical residues in drinking water sources, is creating urgent regulatory pressure for continuous, real-time water quality monitoring that replaces periodic grab sampling approaches incapable of detecting transient contamination events. The U.S. EPA's 2024 PFAS maximum contaminant level regulations, India's Jal Jeevan Mission creating a need for quality monitoring across 192 million new water connections, and China's USD 169 billion water conservation investment programme collectively exemplify the policy-driven demand forces that sustain the Water Quality Sensor Market's 6.51% CAGR through the 2026 to 2035 forecast period.
Water Quality Sensor Market Size and Forecast
-
Market Size in 2025: USD 6.09 Billion
-
Market Size by 2035: USD 11.45 Billion
-
CAGR: 6.51% from 2026 to 2035
-
Base Year: 2025
-
Forecast Period: 2026–2035
-
Historical Data: 2022–2024
To Get More Information On Water Quality Sensor Market - Request Free Sample Report
Water Quality Sensor Market Trends
-
Rapid integration of IoT connectivity and cloud analytics platforms with water quality sensor networks, enabling remote monitoring of distributed sensor arrays, real-time contamination alert notifications, predictive maintenance scheduling for sensor calibration, and centralised data management for regulatory reporting across multiple monitoring sites.
-
Growing deployment of multi-parameter sensors capable of simultaneously measuring five to twenty water quality parameters within a single deployment platform, reducing infrastructure complexity, calibration overhead, and capital cost relative to deploying multiple single-parameter instruments at each monitoring point.
-
Accelerating development of PFAS-specific detection sensors and biosensor-based pathogen detection platforms that address the emerging contaminant monitoring requirements being embedded in tightening drinking water standards across North America and Europe.
-
Rising adoption of in-line continuous monitoring sensors within water treatment plant process streams, replacing periodic manual sampling with real-time process control feedback that enables automated dosing adjustments and substantially reduces treatment chemical consumption and associated costs.
-
Growing deployment of water quality sensor networks for distribution system monitoring, enabling early detection of contamination events, distribution main breaks, and illegal discharge incidents before they affect public health or trigger regulatory enforcement actions.
-
Increasing adoption of optical sensor technologies including UV-Vis spectrophotometry and fluorescence spectroscopy for water quality measurement, providing reagent-free, low-maintenance monitoring alternatives to traditional electrochemical sensors that require frequent recalibration and reagent replenishment.
-
Rapid growth of water quality monitoring in aquaculture operations as global fish farming expansion creates large-scale demand for dissolved oxygen, pH, ammonia, and temperature monitoring systems that maintain optimal water conditions for fish health and production yield.
U.S. Water Quality Sensor Market Size Outlook:
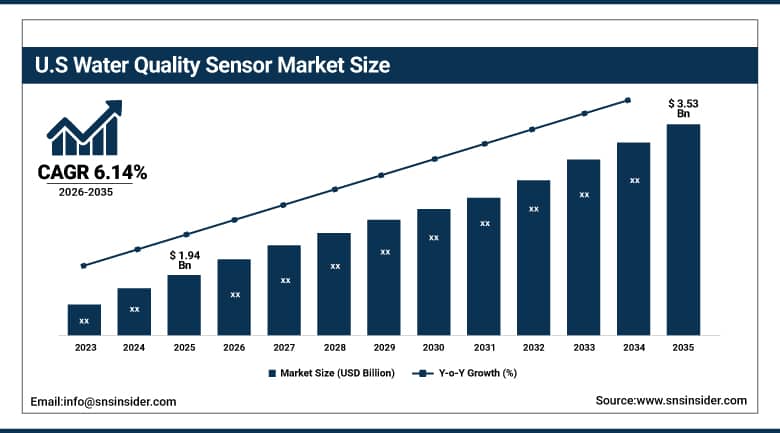
The U.S. Water Quality Sensor Market was valued at USD 1.94 billion in 2025 and is expected to reach USD 3.53 billion by 2035, registering a CAGR of 6.14% during 2026–2035.
United States leads the globe in terms of the size of its national water quality sensor market, supported by its large water supply network infrastructure, most stringent regulations for water quality monitoring, and immediate compliance investments required due to the establishment of maximum contaminant levels in 2024 by the U.S. EPA on PFAS compounds. Federal and state government regulations require the constant monitoring of water quality at thousands of drinking water treatment facilities, industrial discharge sites, and ambient water quality monitoring stations. This requirement creates the largest number of water quality sensors in use for regulatory compliance purposes anywhere in the world. With the aging of water distribution infrastructure in the United States, as noted in the Infrastructure Report Card of the American Society of Civil Engineers, there is a growing need for advanced water network monitoring to detect pipe breakages, contaminants, and service quality issues. Major water quality sensor suppliers such as Hach, YSI (Xylem), Thermo Fisher Scientific, and Horiba have major presences in the U.S.
The U.S. EPA's 2024 PFAS maximum contaminant level regulations, establishing enforceable limits for PFOA and PFOS at 4 parts per trillion in drinking water, are creating the most significant near-term regulatory investment catalyst in the water quality sensor market's history. The approximately 66,000 U.S. public water systems subject to these regulations will require validated analytical methods and monitoring programmes to demonstrate compliance, driving immediate investment in PFAS monitoring equipment and creating substantial recurring demand for sensor maintenance, calibration services, and analytical laboratory support that sustains U.S. market leadership through the 2026 to 2035 forecast period.
Water Quality Sensor Market Segment Insights
-
According to Sensor Type, Total Organic Carbon sensors accounted for the largest market share (~25.6%) in 2025 due to their essential role in assessing organic contamination in drinking water, wastewater treatment, and industrial process water; Chlorine Residual Sensors are among the fastest-growing sensor types.
-
In terms of Application, Drinking Water Treatment accounted for the largest market share in 2025 driven by regulatory compliance monitoring requirements; Wastewater Management is the fastest-growing application at a CAGR of approximately 8.7%.
-
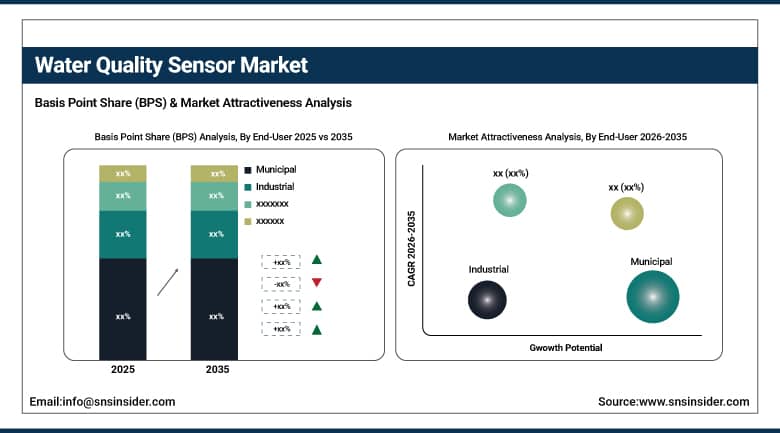
By End-User, Municipal end-users accounted for the largest market share in 2025 through water utility compliance monitoring programmes; Industrial is the fastest-growing end-user as manufacturing and process industries invest in real-time water quality management.
By End-User, Municipal segment dominates the Water Quality Sensor Market, Industrial segment expected to grow fastest
The Water Quality Sensor Market featured the largest presence of municipal end-users in 2025 due to widespread installation of water quality monitoring systems in drinking water treatment plants, wastewater treatment plants, and public water distribution systems. The growing use of water quality sensors by municipal organizations and utilities for real-time monitoring of water parameters such as pH levels, turbidity, dissolved oxygen levels, conductivity, chlorine residuals, and total organic carbon levels in order to comply with strict laws and regulations related to public health and the environment has been observed. Moreover, rising spending by governments in North America, Europe, and Asia Pacific on modernizing their smart water infrastructures, water utility management, and aging water pipelines during the years 2025 and 2026 will continue to drive growth in this market segment.
Industrial end-users are expected to witness the fastest CAGR throughout the forecast period owing to rising adoption of real-time water quality monitoring technologies across manufacturing, oil & gas, chemicals, pharmaceuticals, food & beverage, mining, and semiconductor industries. Industrial facilities require continuous monitoring of process water, cooling water, wastewater discharge, and ultrapure water systems to improve operational efficiency, ensure regulatory compliance, and reduce environmental risks.
By Sensor Type, Total Organic Carbon sensors dominate the Water Quality Sensor Market, Chlorine Residual Sensors expected to grow fastest
Total Organic Carbon (TOC) Sensors were the market leader in terms of revenue share of the Water Quality Sensors Market in 2025, generating around 25.6% of the total global revenue, as they are essential instruments used to monitor the existence of organic compounds within the process of water treatment, and are also mandatory for monitoring water purification in the pharmaceutical industry. The TOC sensors are widely recognized for their ability to provide information on the extent of pollution caused by organic compounds in water, being utilized for monitoring drinking water treatment plants, regulatory compliance in pharmaceutical water treatment processes, and surface water quality monitoring. Innovations in the design of combustion and persulfate-UV TOC sensors have contributed to greater accuracy of measurement, reduced maintenance costs, and lower initial investment costs for TOC monitoring equipment.
Chlorine Residual Sensors are expected to experience the fastest growth in terms of CAGR between 2022 and 2035. According to certain estimates, the growth rate in demand is expected to be around 10%. The increasing deployment of chlorine residual detection equipment worldwide is attributed to the requirement of maintaining bacteriological safety of water supplies through chlorine residual monitoring across water distribution systems. Current chlorine residual sensors use advanced amperometric and optical measurement systems to continuously monitor free and total chlorine residuals in ways unachievable with traditional DPD test kits.
By Application, Drinking Water Treatment dominates, Wastewater Management grows fastest
Drinking Water Treatment retained the dominant application position in the Water Quality Sensor Market in 2025, reflecting the comprehensive multi-parameter monitoring requirements of modern drinking water treatment processes and the non-negotiable regulatory compliance obligations of public water utilities. A modern water treatment plant deploys sensors across source water intake, coagulation and flocculation processes, filtration stages, disinfection contactors, and treated water storage to maintain continuous process control and document compliance with drinking water standards. The tightening of global drinking water quality standards, including PFAS limits in the U.S. and Europe, lead and copper action levels, and microbial safety parameters, is creating expanding monitoring programme requirements that drive sustained sensor procurement across the drinking water treatment application segment.
Wastewater Management is projected to grow at the fastest application CAGR of approximately 8.7% through 2035, driven by tightening industrial wastewater discharge standards across Asia, Latin America, and the Middle East, growing investment in advanced wastewater treatment processes including nutrient removal that require extensive real-time monitoring for process optimisation, and the expansion of water reuse programmes that apply drinking water quality standards to reclaimed water monitoring.
Water Quality Sensor Market Regional Analysis:
|
Region |
Major Country |
Share within Region (%) |
|---|---|---|
|
North America |
United States |
~80% |
|
Europe |
Germany |
~32% |
|
Asia Pacific |
China |
~45% |
|
Middle East & Africa |
Saudi Arabia |
~28% |
|
Latin America |
Brazil |
~43% |
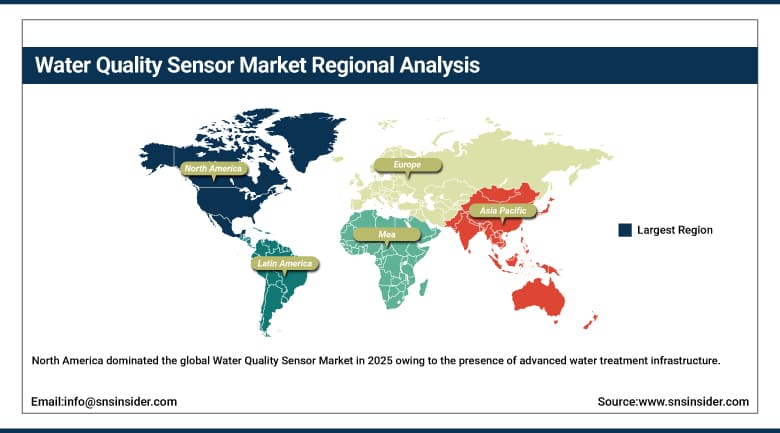
North America Water Quality Sensor Market Insights
North America dominated the global Water Quality Sensor Market in 2025 owing to the presence of advanced water treatment infrastructure, stringent environmental regulations, and widespread deployment of real-time water monitoring technologies across the United States and Canada. The United States accounted for the largest share in the regional market due to its extensive public water utility infrastructure, strong regulatory compliance requirements, and rising investments in smart water management systems. Regulations associated with PFAS contamination control, industrial wastewater discharge monitoring, and drinking water quality standards implemented during 2025 and 2026 are significantly accelerating demand for advanced water quality sensors across municipal and industrial applications. The Bipartisan Infrastructure Law and increasing investments in digital water infrastructure modernization are further supporting large-scale deployment of intelligent water monitoring technologies across North America. Canada also contributes significantly through growing investments in environmental monitoring programs, wastewater treatment modernization, and industrial water quality management across mining, energy, and manufacturing sectors.
Get Customized Report as Per Your Business Requirement - Enquiry Now
Europe Water Quality Sensor Market Insights
Europe is a fully developed and technologically advanced water quality sensors market due to the stringent ambient water quality monitoring requirements laid down in the EU Water Framework Directive, effluent quality standards as set out in the Urban Wastewater Treatment Directive, and evolving EU standards for drinking water quality standards that include PFAS, lead and microbiology testing. Germany is a leader in water quality sensors in Europe due to their developed water utility industry, industrial water management sector, and manufacturing of water quality instruments. Other key secondary markets in Europe include the UK, France, The Netherlands, and Sweden.
Asia Pacific Water Quality Sensor Market Insights
Asia Pacific is expected to witness the fastest growth in the global Water Quality Sensor Market owing to rapid industrialization, urban population growth, increasing water pollution concerns, and large-scale investments in water treatment infrastructure across China, India, Japan, South Korea, and Southeast Asia. Governments across the region are increasingly focusing on improving drinking water safety, wastewater treatment efficiency, and industrial discharge monitoring systems to address rising environmental challenges and water scarcity concerns. China dominates the regional market owing to extensive investments in smart water infrastructure, industrial wastewater treatment facilities, and environmental monitoring technologies. India is emerging as one of the fastest-growing markets due to expanding urban water supply networks, stricter pollution control regulations, and increasing deployment of digital water quality monitoring systems under national clean water initiatives. Rising adoption of IoT-enabled sensors, cloud-based analytics platforms, and AI-driven environmental monitoring technologies during 2025 and 2026 is further accelerating market growth across Asia Pacific.
Middle East & Africa Water Quality Sensor Market Insights
Middle East & Africa Water Quality Sensor Market is witnessing steady growth owing to increasing concerns regarding water scarcity, rising investments in desalination infrastructure, and expanding environmental monitoring regulations across Saudi Arabia, UAE, South Africa, and other regional economies. Countries across the Middle East are heavily investing in advanced seawater desalination plants, wastewater recycling facilities, and smart water management systems to address growing freshwater shortages and rising urban demand. Saudi Arabia and the UAE are leading regional adoption of advanced water quality sensors owing to large-scale deployment of reverse osmosis desalination facilities requiring continuous monitoring of salinity, pH, conductivity, turbidity, and chemical contaminants throughout water treatment processes. South Africa remains one of the leading markets within Sub-Saharan Africa due to its relatively advanced municipal water infrastructure, mining sector monitoring requirements, and growing focus on environmental compliance and industrial wastewater management. Rising investments in smart city projects and digital water infrastructure during 2025 and 2026 are expected to further support market growth across the MEA region.
Latin America Water Quality Sensor Market Insights
Latin America is experiencing consistent growth in the Water Quality Sensor Market owing to increasing industrialization, expansion of municipal water treatment infrastructure, and rising environmental monitoring requirements across Brazil, Mexico, Argentina, Chile, and Colombia. Brazil dominated the regional market in 2025 due to its large industrial manufacturing base, extensive wastewater treatment needs, and growing investments in smart water management technologies. Rising deployment of water quality sensors across food & beverage, mining, chemicals, oil & gas, and municipal utility sectors is accelerating market demand throughout the region. Governments across Latin America are strengthening wastewater discharge regulations and increasing investments in sustainable water infrastructure to address pollution concerns and improve access to clean drinking water. In addition, increasing adoption of IoT-enabled monitoring systems, cloud-based water analytics platforms, and industrial process automation technologies during 2025 and 2026 is further contributing to strong regional market growth.
Water Quality Sensor Market Growth Drivers:
-
Tightening global water quality regulations and growing contamination incidents creating mandatory continuous monitoring investment across municipal and industrial water operations
The primary structural growth driver for the Water Quality Sensor Market is the tightening of water quality regulations across major economies that are creating mandatory continuous monitoring requirements for parameters and contamination events that were previously either unregulated or monitored only through infrequent manual sampling. The U.S. EPA's 2024 PFAS MCL regulations, the EU's updated Drinking Water Directive incorporating PFAS limits, and increasingly stringent industrial wastewater discharge standards across Asia Pacific collectively create unprecedented regulatory demand for continuous, real-time water quality monitoring infrastructure. The growing frequency of industrial contamination incidents, inadequate water infrastructure failures, and public health emergencies caused by waterborne pathogens and chemical contamination is creating both regulatory pressure and public demand for more comprehensive water quality monitoring systems that provide real-time early warning rather than retrospective detection.
Water Quality Sensor Market Restraints
-
Sensor fouling in challenging deployment environments, high calibration maintenance requirements, and skilled technical expertise constraints limiting adoption in developing markets
A significant restraint on the Water Quality Sensor Market is the fouling susceptibility of electrochemical sensors deployed in biologically active water environments, where biofilm formation, suspended solids deposition, and chemical scaling progressively degrade measurement accuracy between cleaning and calibration maintenance interventions. The maintenance burden of water quality sensor networks, requiring regular probe cleaning, calibration against certified reference standards, reagent replenishment for certain sensor technologies, and technical expertise to diagnose and rectify sensor performance issues, creates operational cost and capability constraints that limit deployment density and continuity of data quality particularly in resource-constrained monitoring programmes. In developing markets, the shortage of trained water quality instrument technicians capable of maintaining advanced sensor systems is a practical barrier to adoption that limits market penetration in the geographies with potentially the greatest water quality monitoring needs.
Water Quality Sensor Market Opportunities
-
PFAS and emerging contaminant sensor development, smart water network monitoring expansion, and aquaculture sector growth
The development of validated, field-deployable sensors for PFAS compounds and other emerging contaminants represents the most significant near-term product innovation opportunity in the water quality sensor market, as the global regulatory momentum toward tighter PFAS limits across drinking water, groundwater, and industrial discharge is creating urgent demand for monitoring solutions that go beyond laboratory analysis to provide continuous field measurement. Smart water network monitoring systems that integrate pressure, flow, acoustic leak detection, and water quality sensors into unified digital water management platforms represent a premium market opportunity that is progressively expanding as water utilities adopt digital twin models of their distribution networks. The rapidly expanding global aquaculture industry, producing over 90 million tonnes of seafood annually with intensive monitoring requirements for dissolved oxygen, pH, ammonia, and temperature, represents a growing and relatively underpenetrated water quality sensor application segment.
Recent Developments:
-
June 2025: Xylem (YSI) expanded its portfolio of multi-parameter water quality sondes for real-time surface water and groundwater monitoring, incorporating enhanced anti-fouling technologies and extended deployment intervals that reduce maintenance requirements in challenging environmental monitoring applications.
-
2025: Hach Company introduced enhanced TOC analyser platforms with integrated LIMS connectivity and automated regulatory compliance report generation, enabling water utility laboratories to satisfy increasingly stringent EPA and EU monitoring documentation requirements with reduced manual data management effort.
Water Quality Sensor Market Key Players
-
Xylem Inc.
-
Thermo Fisher Scientific Inc.
-
Danaher Corporation
-
HORIBA, Ltd.
-
Yokogawa Electric Corporation
-
Emerson Electric Co.
-
ABB Ltd.
-
Siemens AG
-
Endress+Hauser Group
-
Hach Company
-
Honeywell International Inc.
-
Evoqua Water Technologies
-
Teledyne Technologies Incorporated
-
Swan Analytical Instruments AG
-
Badger Meter, Inc.
-
Analytical Technology, Inc. (ATI)
-
Campbell Scientific, Inc.
-
Pentair plc
-
Aqua Metrology Systems Ltd.
-
Real Tech Inc.
Water Quality Sensor Market Report Scope:
| Report Attributes | Details |
|---|---|
| Market Size in 2025 | USD 6.09 Billion |
| Market Size by 2035 | USD 11.45 Billion |
| CAGR | CAGR of 6.51% From 2026 to 2035 |
| Base Year | 2025 |
| Forecast Period | 2026-2035 |
| Historical Data | 2022-2024 |
| Report Scope & Coverage | Market Size, Segments Analysis, Competitive Landscape, Regional Analysis, DROC & SWOT Analysis, Forecast Outlook |
| Key Segments | • By Sensor Type (Total Organic Carbon Sensors, Turbidity Sensors, pH Sensors, Dissolved Oxygen Sensors, Chlorine Residual Sensors, Multi-Parameter Sensors, Others) • By Application (Drinking Water Treatment, Wastewater Management, Industrial Process Water, Environmental Monitoring, Aquaculture, Others) • By End-User (Municipal, Industrial, Commercial, Others) |
| Regional Analysis/Coverage | North America (US, Canada), Europe (Germany, UK, France, Italy, Spain, Russia, Poland, Rest of Europe), Asia Pacific (China, India, Japan, South Korea, Australia, ASEAN Countries, Rest of Asia Pacific), Middle East & Africa (UAE, Saudi Arabia, Qatar, South Africa, Rest of Middle East & Africa), Latin America (Brazil, Argentina, Mexico, Colombia, Rest of Latin America). |
| Company Profiles | Xylem Inc., Thermo Fisher Scientific Inc., Danaher Corporation, HORIBA, Ltd., Yokogawa Electric Corporation, Emerson Electric Co., ABB Ltd., Siemens AG, Endress+Hauser Group, Hach Company, Honeywell International Inc., Evoqua Water Technologies, Teledyne Technologies Incorporated, Swan Analytical Instruments AG, Badger Meter, Inc., Analytical Technology, Inc. (ATI), Campbell Scientific, Inc., Pentair plc, Aqua Metrology Systems Ltd., Real Tech Inc. |
Frequently Asked Questions
Ans: The Water Quality Sensor Market is expected to grow at a CAGR of 6.51% from 2026 to 2035.
Ans: The Water Quality Sensor Market was valued at USD 6.09 billion in 2025.
Ans: Total Organic Carbon sensors dominated the Water Quality Sensor Market in 2025 with approximately 25.6% of global revenues, driven by their essential role in assessing organic contamination in drinking water, wastewater treatment, pharmaceutical water purification, and industrial process water quality management.
Ans: Drinking Water Treatment dominated the Water Quality Sensor Market in 2025 due to comprehensive multi-parameter monitoring requirements of modern treatment processes and mandatory regulatory compliance documentation obligations of public water utilities across all major economies.
Ans: North America dominated the global Water Quality Sensor Market in 2025 owing to the presence of advanced water treatment infrastructure, stringent environmental regulations, and widespread deployment of real-time water monitoring technologies.
Get in Touch
