image

Wearable Devices Supporting Line-of-Business Applications Market Size, Share & Segmentation By Device Type (Smartwatches, Fitness Trackers, Smart Glasses, Health Monitors, and Wearable Payment Devices), End-User Industry (Healthcare, Manufacturing, Retail, Logistics and Supply Chain, and Construction), Application Area (Employee Monitoring, Health and Safety Compliance, Asset Tracking, Field Service Management, and Business Process Optimization), Connectivity Technology (Bluetooth, Wi-Fi, Cellular, NFC (Near Field Communication), and RFID (Radio Frequency Identification)), Deployment Type (On-Premises Deployment, Cloud-Based Deployment, and Hybrid Deployment), and Region | Global Forecast 2025-2032

Date: June 2025 Report Code: SNS/ICT/7632 Page 300

Wearable Devices Supporting Line-of-Business Applications Market Report Scope & Overview:

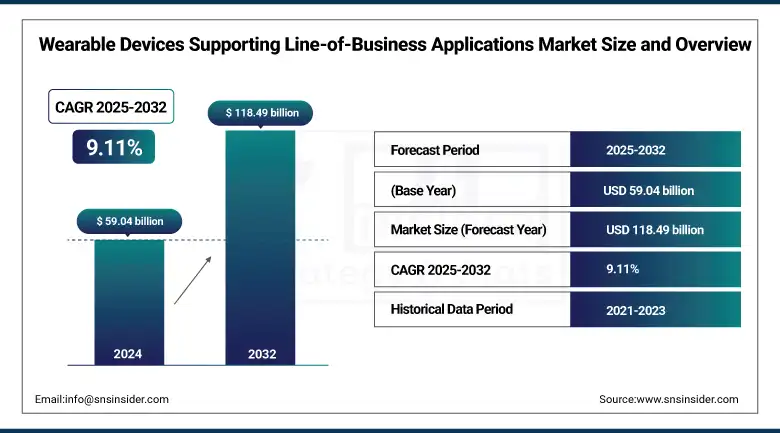
The Wearable Devices Supporting Line-of-Business Applications market size was valued at USD 59.04 billion in 2024 and is expected to reach USD 118.49 billion by 2032, expanding at a CAGR of 9.11% over the forecast period of 2025-2032.

Wearable Devices Supporting Line-of-Business Applications Market is expanding at a significant pace due to the rising adoption in the industry to enable smartwatches, fitness trackers, smart glasses, and health monitors. Products including these enable productivity, employee safety, and real-time data access in wearable devices supporting line-of-business applications market industry, such as healthcare, manufacturing, logistics, or construction. With support for wireless technologies, such as Bluetooth, Wi-Fi, cellular, and NFC, and cloud-based deployments, the RP-500 is designed for seamless integration and scalability. Americas dominates the market, the U.S. is the driving market, and APAC is the fastest growing, with the most opportunities. Main wearable devices supporting the line-of-business applications market companies, such as Apple, Samsung, Alphabet, Garmin, and Xiaomi continue to drive innovation as organizations move to insert wearables into the heart of their business in a way that is much more present and unique than in the past.

According to research, organizations using wearable devices have reported up to an 8.5% boost in workforce productivity, a 7.2% drop in operational errors, and a 30% reduction in workplace incidents, while asset-tracking wearables have cut inventory losses by up to 27%.

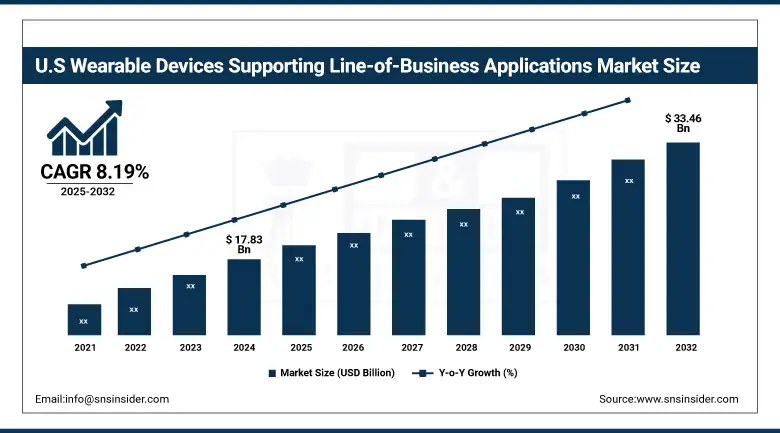
The U.S Wearable Devices Supporting Line-of-Business Applications market size reached USD 17.83 billion in 2024 and is expected to reach USD 33.46 billion in 2032 at a CAGR of 8.19% from 2025 to 2032.

The U.S. market is dominant due to the presence of a large number of technological firms, a high acceptance rate of enterprises for deploying these devices, and a number of big players, such as Apple, Alphabet, and Qualcomm. Wearables in the jobs industry, 67 American companies in healthcare, manufacturing, and logistics are embracing wearables for workforce surveillance, OSHA compliance, and operational efficiency. The country's advanced cloud infrastructure, high connectivity penetration, and government backing accelerate adoption. Coupled with big bets on R&D and early adoption of new technologies, the U.S. remains at the forefront of enterprise wearables and will drive share and growth in the coming years.

Market Dynamics:

Drivers:

  • Increasing Integration of Wearables to Improve Workforce Efficiency and Safety Across Industrial Sectors

The growing demand for real-time tracking, efficiency improvement, and safety adherence is encouraging the deployment of corporate wearable devices. Smartwatches, smart glasses, and health monitors are being put to use in sectors from manufacturing and healthcare to logistics and construction, to track employee activity, maintain safety standards, and facilitate the smooth running of operations. Such solutions contribute to minimizing operational downtime, improving decision-making, and providing the ability to manage a remote workforce. A significant trend is the use of AI and IoT in wearables, delivering predictive analytics and automating data-driven actions. More recently, wearable hardware vendors have teamed with industrial software companies to make it easier to integrate with ERP systems and cloud services.

According to research, organizations using smart wearables for safety compliance and remote monitoring have achieved a 30–40% drop in workplace accidents and up to 25% savings in field management costs across key industries.

Restraints:

  • Data Privacy and Security Concerns Limit the Full-Scale Adoption of Enterprise Wearable Technologies

Despite their advantages, wearable devices face significant concerns related to data security and employee privacy. The constant collection of personal and operational data poses risks of data breaches and non-compliance with data protection laws, such as GDPR and HIPAA. Enterprises are cautious about adopting these devices due to legal implications and employee resistance. The lack of standardized security protocols and end-to-end encryption across wearable platforms exacerbates these concerns. Recent incidents of data leaks from fitness apps and wearable platforms have heightened regulatory scrutiny and emphasized the need for stricter governance frameworks before broader enterprise adoption can be realized.

Opportunities:

  • Growing Use of Wearables in Healthcare for Remote Patient Monitoring and Clinical Workflow Optimization Creates Market Potential

A major growth opportunity lies in the expanding use of wearable devices in clinical environments. Healthcare providers are increasingly relying on wearables for remote patient monitoring, chronic disease management, and real-time vitals tracking, which helps reduce hospital readmissions and improve patient outcomes. Integration with EHR systems and telehealth platforms is also enabling streamlined clinical workflows. Recent wearable devices supporting line-of-business applications market trend include the FDA’s support for medical-grade wearables and investment by hospital networks in enterprise wearables. Companies including Apple and Alphabet are enhancing their healthcare-focused wearable capabilities, signaling a promising future for clinical adoption beyond consumer fitness use.

Challenges:

  • Lack of Standardization in Wearable Device Platforms Hampers Interoperability Across Enterprise Systems

A persistent challenge in the market is the absence of standardization across wearable platforms, which limits interoperability with enterprise applications such as ERP, CRM, and HRM systems. Many devices operate on proprietary software, complicating integration and increasing costs for customization. This fragmentation creates barriers for large-scale deployment and reduces scalability. Enterprises struggle to maintain consistent performance and data accuracy when managing diverse wearable ecosystems. Recent feedback from enterprise IT leaders highlights integration complexity as a top concern when evaluating wearable investments. Efforts are ongoing to develop universal APIs and industry-wide standards, but full harmonization remains a long-term hurdle.

Segment Analysis:

By Device Type

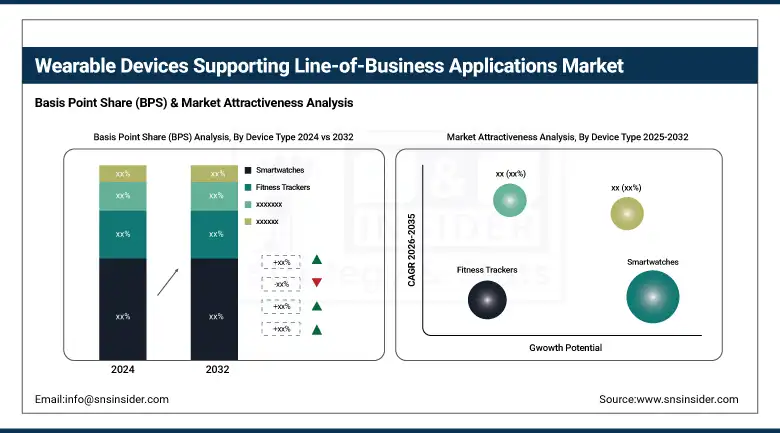
Smartwatches dominate the device type segment, accounting for 41.36% of revenue in 2024, driven by their multifunctionality in workforce productivity, real-time communication, and health monitoring. Enterprises across sectors use smartwatches for tracking employee movement, scheduling tasks, and ensuring safety compliance. Apple’s continued updates to its Apple Watch Series with enhanced biometric sensors and Samsung’s Galaxy Watch integrations with business management platforms exemplify ongoing innovation. These devices' ability to integrate seamlessly with enterprise systems through apps and APIs enhances workflow efficiency. The surge in remote workforces and health-centric workplace policies fuels demand, making smartwatches integral to enterprise wearable strategies.

Fitness trackers are experiencing the fastest CAGR at 10.14%, owing to their cost-effectiveness, ease of use, and growing deployment in health-centric enterprises. These devices are increasingly used in labor-intensive industries for monitoring employee wellness, fatigue levels, and physical exertion. Companies including Fitbit (under Alphabet) and Xiaomi have launched enterprise-focused trackers with extended battery life and enhanced health insights. Garmin's workplace wellness solutions are also gaining traction. The growing focus on occupational health and the integration of fitness trackers with workforce analytics tools are driving this segment’s rapid growth within the Wearable Devices Supporting Line-of-Business Applications Market.

By End-User Industry

Healthcare leads among end-user industries with a 35.72% revenue share in 2024 due to the rising deployment of wearables in clinical settings. Devices like smartwatches and health monitors are used for real-time vital monitoring, chronic condition management, and post-operative care. Apple and Fitbit have expanded their ECG and SpO2 monitoring capabilities, gaining interest from hospital networks and digital health platforms. The push for remote patient monitoring and value-based care drives this growth. Additionally, partnerships between wearable manufacturers and EHR vendors facilitate seamless health data integration, making wearables critical in modern healthcare delivery models.

The logistics and supply chain segment is growing at the fastest CAGR of 10.53%, propelled by the need for real-time tracking, hands-free communication, and workforce safety. Wearable devices including smart glasses and GPS-enabled smartwatches are being deployed to monitor driver health, optimize routes, and reduce downtime. Zebra Technologies and RealWear have launched rugged wearables tailored to logistics environments. The growing e-commerce and global supply chain complexities demand continuous data flow and operational visibility, making wearable integration vital for boosting productivity and minimizing human error across logistics operations.

By Application Area

Health and safety compliance is the leading application, holding a 39.29% share in 2024, fueled by stringent workplace safety regulations and increased emphasis on employee well-being. Wearables including heart rate monitors and smart helmets help detect fatigue, environmental hazards, and physiological stress in real-time. Companies, such as Kenzen and StrongArm Tech have launched wearables that proactively alert users and supervisors to potential health risks. These applications are particularly prevalent in industries including construction and manufacturing. The rising regulatory pressure and growing employer liability concerns make health and safety a cornerstone in enterprise wearable adoption.

Asset tracking is expanding at a CAGR of 10.53%, driven by the increasing use of wearable technology for equipment monitoring and location-based services. Devices embedded with RFID and GPS functionalities help track inventory and tools in real-time, reducing loss and improving asset utilization. Companies, such as Ubimax and ProGlove are innovating in smart gloves and AR wearables for inventory management. The growth of Industry 4.0 and the demand for automation in asset-intensive sectors, such as logistics and field services are significant drivers, as businesses seek to minimize errors and optimize asset visibility through wearable integration.

By Connectivity Technology

Bluetooth holds the largest market share at 49.27% due to its widespread compatibility, low power consumption, and ease of deployment. Most enterprise wearables utilize Bluetooth for data transfer between devices and mobile/desktop platforms. Recent enhancements in Bluetooth Low Energy (BLE) have extended battery life and improved data transmission speed. Companies including Qualcomm and Nordic Semiconductor continue to enhance Bluetooth chipsets for enterprise-grade wearables. As wearables require continuous communication with management systems and smartphones, Bluetooth’s reliability and cost-effectiveness make it the default connectivity standard in enterprise deployments.

NFC is growing at the fastest CAGR of 10.87%, largely driven by its secure, contactless capabilities ideal for payment authentication and access control in enterprises. NFC-enabled wearables allow employees to enter secure zones, track attendance, or authorize transactions seamlessly. Companies, such as Sony and NXP Semiconductors are embedding advanced NFC features into wearable chips, while Apple’s recent enhancements in Apple Watch NFC capabilities highlight the trend. The adoption of contactless technologies post-COVID and the integration of wearables into enterprise security systems are propelling NFC adoption across sectors such as retail, healthcare, and finance.

By Deployment Type

Cloud-based deployment dominates with 28.48% revenue share in 2024, driven by scalability, accessibility, and centralized data management. Cloud platforms allow real-time data sync across devices and analytics dashboards, making them ideal for large-scale enterprises. Companies including Microsoft Azure and AWS offer wearable-compatible cloud services, while Fitbit’s enterprise health solutions are integrated with Google Cloud. With the increasing reliance on real-time health, location, and performance data, cloud-based models provide the flexibility and computational power enterprises need to maximize the ROI of wearable technologies.

Hybrid deployment is the fastest-growing segment with a CAGR of 10.51%, as it offers a balance between on-premises control and cloud scalability. Enterprises with stringent data regulations or latency concerns prefer hybrid models to safeguard sensitive data locally while leveraging cloud-based analytics. Companies, such as IBM and Cisco are developing hybrid cloud environments tailored to wearable integration. The trend is especially relevant in sectors including healthcare and defense, where data privacy is critical. Hybrid deployments enable customized configurations, ensuring compliance without compromising on the functionality or responsiveness of wearable systems.

Regional Analysis:

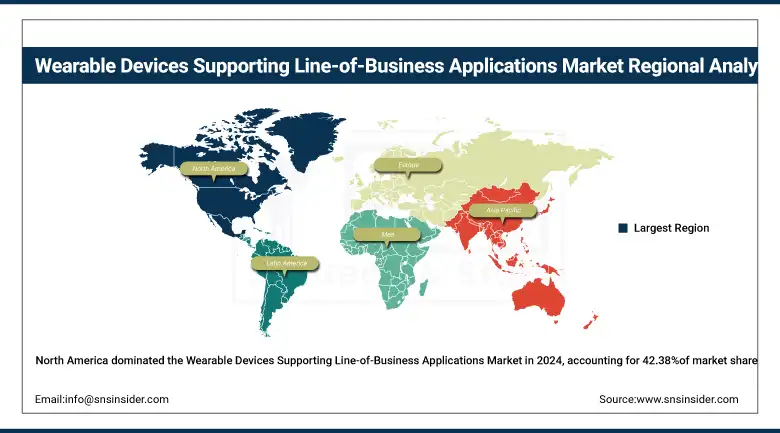
North America dominates the wearable devices supporting line-of-business applications market share of 42.38% in 2024. The region benefits from early technology adoption, strong investments in digital transformation, and mature infrastructure supporting IoT and connected devices. High demand for productivity, health monitoring, and safety compliance tools in industries including healthcare and logistics continues to boost adoption across enterprises. The U.S. leads the region due to its advanced technology landscape, significant R&D spending, and widespread use of enterprise wearables in critical sectors, such as healthcare, manufacturing, and field services.

Europe holds a substantial share of the market, driven by increasing emphasis on worker safety, stringent regulatory standards, and digital innovation in key industries, such as logistics and manufacturing. Enterprises are increasingly deploying wearables for health monitoring, compliance, and real-time performance tracking. Germany stands as the leading country in Europe, attributed to its industrial strength, focus on smart manufacturing (Industry 4.0), and integration of wearable technologies into production and workforce management systems.

Asia Pacific is the fastest-growing region, with a projected growth rate of 20.62% CAGR over 2025-2032. This growth is driven by industrial expansion, strong government support for digitalization, and a growing demand for cost-efficient wearable solutions across sectors like logistics, healthcare, and field services. China dominates the region due to its vast manufacturing ecosystem, significant investment in enterprise IoT, and leadership in wearable device production and deployment across industries.

The Middle East & Africa and Latin America regions are witnessing steady growth in enterprise wearable adoption, driven by demand in hazardous industries, healthcare, and logistics. Government-backed digital initiatives in the UAE and Brazil's industrial and health-tech expansion support early adoption. Growing safety awareness and mobile infrastructure also contribute to wearable devices supporting the line-of-business applications wearable devices supporting line-of-business applications market growth across both regions.

Key Players:

The major key players operating in the Wearable Devices Supporting Line-of-Business Applications Market are Apple Inc., Samsung Electronics Co., Ltd., Alphabet Inc. (via Google and Fitbit), Garmin Ltd., Xiaomi Corporation, LG Electronics Inc., Sony Corporation, Qualcomm Technologies, Inc., Fitbit Inc. (now part of Google/Alphabet), Adidas AG, and others.

Key Developments:

  • In June 2025, Samsung Electronics unveiled the Galaxy Ring, Galaxy Watch7, and Galaxy Watch Ultra, integrating Galaxy AI for enhanced health monitoring features such as sleep tracking, Energy Scores, and advanced wellness insights.

  • In April 2025, Xiaomi emerged as the global leader in wearable bands, shipping 8.7 million units in Q1 2025 a 44% YoY growth driven by its HyperOS integration, continuous product innovation, and strong market demand.

Wearable Devices Supporting Line-of-Business Applications Market Report Scope:

Report Attributes Details
Market Size in 2024 USD 59.04 Billion 
Market Size by 2032 USD 118.49 Billion 
CAGR CAGR of 9.11% From 2025 to 2032
Base Year 2024
Forecast Period 2025-2032
Historical Data 2021-2023
Report Scope & Coverage Market Size, Segments Analysis, Competitive Landscape, Regional Analysis, DROC & SWOT Analysis, Forecast Outlook
Key Segments •By Device Type (Smartwatches, Fitness Trackers, Smart Glasses, Health Monitors, Wearable Payment Devices)
•By End User Industry (Healthcare, Manufacturing, Retail, Logistics and Supply Chain, Construction)
•By Application Area (Employee Monitoring, Health and Safety Compliance, Asset Tracking, Field Service Management, Business Process Optimization)
•By Connectivity Technology (Bluetooth, Wi-Fi, Cellular, NFC (Near Field Communication), RFID (Radio Frequency Identification))
•By Deployment Type (On-Premises Deployment, Cloud-Based Deployment, Hybrid Deployment)
Regional Analysis/Coverage North America (US, Canada, Mexico), Europe (Germany, France, UK, Italy, Spain, Poland, Turkey, Rest of Europe), Asia Pacific (China, India, Japan, South Korea, Singapore, Australia, Rest of Asia Pacific), Middle East & Africa (UAE, Saudi Arabia, Qatar, South Africa, Rest of Middle East & Africa), Latin America (Brazil, Argentina, Rest of Latin America)
Company Profiles Apple Inc., Samsung Electronics Co., Ltd., Alphabet Inc. (via Google and Fitbit), Garmin Ltd., Xiaomi Corporation, LG Electronics Inc., Sony Corporation, Qualcomm Technologies, Inc., Fitbit Inc. (now part of Google/Alphabet), Adidas AG

Frequently Asked Questions

Ans: The market is expected to expand at a CAGR of 9.11% during the forecast period over 2025-2032, supported by innovations in wearable devices, rising safety standards, and increased demand for real-time operational visibility.

Ans: The market was valued at USD 59.04 billion in 2024, reflecting strong enterprise adoption and demand for connected workforce technologies.

Ans: A key growth driver is the increasing integration of wearable technologies to improve workforce productivity, safety, and real-time decision-making, particularly through AI and IoT-enabled functionalities across industrial sectors.

Ans: Smartwatches dominated the device type segment, accounting for 41.36% of the market revenue in 2024, due to their multifunctionality in health monitoring, task management, and seamless enterprise system integration.

Ans: North America dominated the market in 2024 with a 42.38% share, driven by strong digital infrastructure, early adoption of enterprise wearables, and significant R&D investment in technologies, such as IoT and cloud computing.

Table of Contents:

1. Introduction

1.1 Market Definition

1.2 Scope (Inclusion and Exclusions)

1.3 Research Assumptions

2. Executive Summary

2.1 Market Overview

2.2 Regional Synopsis

2.3 Competitive Summary

3. Research Methodology

3.1 Top-Down Approach

3.2 Bottom-up Approach

3.3. Data Validation

3.4 Primary Interviews

4. Market Dynamics Impact Analysis

4.1 Market Driving Factors Analysis

4.1.1 Drivers

4.1.2 Restraints

4.2 PESTLE Analysis

4.3 Porter’s Five Forces Model

5. Statistical Insights and Trends Reporting

5.1 AI & Predictive Analytics Penetration

5.2 Device Lifecycle & Replacement Stats

5.3 Enterprise Spend & Budget Trends

5.4 Wearables in High-Risk Zones

5.5 raining & Workforce Enablement

5.7 Regional Trends in Use Cases

6. Competitive Landscape

6.1 List of Major Companies, By Region

6.2 Market Share Analysis, By Region

6.3 Product Benchmarking

6.3.1 Product specifications and features

6.3.2 Pricing

6.4 Strategic Initiatives

6.4.1 Marketing and promotional activities

6.4.2 Distribution and supply chain strategies

6.4.3 Expansion plans and new product launches

6.4.4 Strategic partnerships and collaborations

6.5 Technological Advancements

6.6 Market Positioning and Branding

7. Wearable Devices Supporting Line-of-Business Applications Market Segmentation, By Device Type

7.1 Chapter Overview

7.2 Smartwatches

7.2.1 Smartwatches Market Trends Analysis (2021-2032)

7.2.2 Smartwatches Market Size Estimates and Forecasts to 2032 (USD Billion)

7.3 Fitness Trackers

7.3.1 Fitness Trackers Market Trends Analysis (2021-2032)

7.3.2 Fitness Trackers Market Size Estimates and Forecasts to 2032 (USD Billion)

7.4 Smart Glasses

7.4.1 Smart Glasses Market Trends Analysis (2021-2032)

7.4.2 Smart Glasses Market Size Estimates and Forecasts to 2032 (USD Billion)

7.5 Health Monitors

7.5.1 Health Monitors Market Trends Analysis (2021-2032)

7.5.2 Health Monitors Market Size Estimates and Forecasts to 2032 (USD Billion)

7.6 Wearable Payment Devices

7.6.1 Wearable Payment Devices Market Trends Analysis (2021-2032)

7.6.2 Wearable Payment Devices Market Size Estimates and Forecasts to 2032 (USD Billion)

8. Wearable Devices Supporting Line-of-Business Applications Market Segmentation, By End User Industry

8.1 Chapter Overview

8.2 Logistics and Supply Chain

8.2.1 Logistics and Supply Chain Market Trends Analysis (2021-2032)

8.2.2 Logistics and Supply Chain Market Size Estimates And Forecasts To 2032 (USD Billion)

8.3 Healthcare

8.3.1 Healthcare Market Trends Analysis (2021-2032)

8.3.2 Healthcare Market Size Estimates And Forecasts To 2032 (USD Billion)

8.4 Retail

8.4.1 Retail Market Trends Analysis (2021-2032)

8.4.2 Retail Market Size Estimates And Forecasts To 2032 (USD Billion)

8.5 Construction

8.5.1 Construction Market Trends Analysis (2021-2032)

8.5.2 Construction Market Size Estimates And Forecasts To 2032 (USD Billion)

8.6 Manufacturing

8.6.1 Manufacturing Market Trends Analysis (2021-2032)

8.6.2 Manufacturing Market Size Estimates And Forecasts To 2032 (USD Billion)

9. Wearable Devices Supporting Line-of-Business Applications Market Segmentation, By Connectivity Technology

9.1 Chapter Overview

9.2 Bluetooth

9.2.1 Bluetooth Market Trends Analysis (2021-2032)

9.2.2 Bluetooth Market Size Estimates And Forecasts To 2032 (USD Billion)

9.3 Wi-Fi

9.3.1 Wi-Fi Market Trends Analysis (2021-2032)

9.3.2 Wi-Fi Market Size Estimates And Forecasts To 2032 (USD Billion)

9.4 Cellular

9.4.1 Cellular Market Trends Analysis (2021-2032)

9.4.2 Cellular Market Size Estimates And Forecasts To 2032 (USD Billion)

9.5 NFC (Near Field Communication)

9.5.1 NFC (Near Field Communication) Market Trends Analysis (2021-2032)

9.5.2 NFC (Near Field Communication) Market Size Estimates And Forecasts To 2032 (USD Billion)

9.6 RFID (Radio Frequency Identification)

9.6.1 RFID (Radio Frequency Identification) Market Trends Analysis (2021-2032)

9.6.2 RFID (Radio Frequency Identification) Market Size Estimates And Forecasts To 2032 (USD Billion)

10. Wearable Devices Supporting Line-of-Business Applications Market Segmentation, By Deployment Type

10.1 Chapter Overview

10.2 Cloud-Based

10.2.1 Cloud-Based Market Trends Analysis (2021-2032)

10.2.2 Cloud-Based Market Size Estimates And Forecasts To 2032 (USD Billion)

10.3 On-premises

10.3.1 On-premises Market Trends Analysis (2021-2032)

10.3.2 On-premises Market Size Estimates And Forecasts To 2032 (USD Billion)

10.4 Hybrid

10.4.1 Hybrid Market Trends Analysis (2021-2032)

10.4.2 Hybrid Market Size Estimates And Forecasts To 2032 (USD Billion)

11. Wearable Devices Supporting Line-of-Business Applications Market Segmentation, By Application Area

11.1 Chapter Overview

11.2 Employee Monitoring

11.2.1 Employee Monitoring Market Trends Analysis (2021-2032)

11.2.2 Employee Monitoring Market Size Estimates And Forecasts To 2032 (USD Billion)

11.3 Health and Safety Compliance

11.3.1 Health and Safety Compliance Market Trends Analysis (2021-2032)

11.3.2 Health and Safety Compliance Market Size Estimates And Forecasts To 2032 (USD Billion)

11.4 Asset Tracking

11.4.1 Asset Tracking Market Trends Analysis (2021-2032)

11.4.2 Asset Tracking Market Size Estimates And Forecasts To 2032 (USD Billion)

11.5 Field Service Management

11.5.1 Field Service Management Market Trends Analysis (2021-2032)

11.5.2 Field Service Management Market Size Estimates And Forecasts To 2032 (USD Billion)

11.6 Business Process Optimization

11.6.1 Business Process Optimization Market Trends Analysis (2021-2032)

11.6.2 Business Process Optimization Market Size Estimates And Forecasts To 2032 (USD Billion)

12. Regional Analysis

12.1 Chapter Overview

12.2 North America

12.2.1 Trends Analysis

12.2.2 North America Wearable Devices Supporting Line-of-Business Applications Estimates And Forecasts, By Country (2021-2032) (USD Billion)

12.2.3 North America Wearable Devices Supporting Line-of-Business Applications Estimates And Forecasts, By Device Type (2021-2032) (USD Billion)

12.2.4 North America Wearable Devices Supporting Line-of-Business Applications Estimates And Forecasts, By End User Industry (2021-2032) (USD Billion)

12.2.5 North America Wearable Devices Supporting Line-of-Business Applications Estimates And Forecasts, By Connectivity Technology (2021-2032) (USD Billion)

12.2.6 North America Wearable Devices Supporting Line-of-Business Applications Estimates And Forecasts, By Deployment Type (2021-2032) (USD Billion)

12.2.7 North America Wearable Devices Supporting Line-of-Business Applications Estimates And Forecasts, By Application Area (2021-2032) (USD Billion)

12.2.8 USA

12.2.8.1 USA Wearable Devices Supporting Line-of-Business Applications Estimates And Forecasts, By Device Type (2021-2032) (USD Billion)

12.2.8.2 USA Wearable Devices Supporting Line-of-Business Applications Estimates And Forecasts, By End User Industry (2021-2032) (USD Billion)

12.2.8.3 USA Wearable Devices Supporting Line-of-Business Applications Estimates And Forecasts, By Connectivity Technology (2021-2032) (USD Billion)

12.2.8.4 USA Wearable Devices Supporting Line-of-Business Applications Estimates And Forecasts, By Deployment Type (2021-2032) (USD Billion)

12.2.8.5 USA Wearable Devices Supporting Line-of-Business Applications Estimates And Forecasts, By Application Area (2021-2032) (USD Billion)

12.2.9 Canada

12.2.9.1 Canada Wearable Devices Supporting Line-of-Business Applications Estimates And Forecasts, By Device Type (2021-2032) (USD Billion)

12.2.9.2 Canada Wearable Devices Supporting Line-of-Business Applications Estimates And Forecasts, By End User Industry (2021-2032) (USD Billion)

12.2.9.3 Canada Wearable Devices Supporting Line-of-Business Applications Estimates And Forecasts, By Connectivity Technology (2021-2032) (USD Billion)

12.2.9.4 Canada Wearable Devices Supporting Line-of-Business Applications Estimates And Forecasts, By Deployment Type (2021-2032) (USD Billion)

12.2.9.5 Canada Wearable Devices Supporting Line-of-Business Applications Estimates And Forecasts, By Application Area (2021-2032) (USD Billion)

12.2.10 Mexico

12.2.10.1 Mexico Wearable Devices Supporting Line-of-Business Applications Estimates And Forecasts, By Device Type (2021-2032) (USD Billion)

12.2.10.2 Mexico Wearable Devices Supporting Line-of-Business Applications Estimates And Forecasts, By End User Industry (2021-2032) (USD Billion)

12.2.10.3 Mexico Wearable Devices Supporting Line-of-Business Applications Estimates And Forecasts, By Connectivity Technology (2021-2032) (USD Billion)

12.2.10.4 Mexico Wearable Devices Supporting Line-of-Business Applications Estimates And Forecasts, By Deployment Type (2021-2032) (USD Billion)

12.2.10.5 Mexico Wearable Devices Supporting Line-of-Business Applications Estimates And Forecasts, By Application Area (2021-2032) (USD Billion)

12.3 Europe

12.3.1 Trends Analysis

12.3.2 Europe Wearable Devices Supporting Line-of-Business Applications Estimates And Forecasts, By Country (2021-2032) (USD Billion)

12.3.3 Europe Wearable Devices Supporting Line-of-Business Applications Estimates And Forecasts, By Device Type (2021-2032) (USD Billion)

12.3.4 Europe Wearable Devices Supporting Line-of-Business Applications Estimates And Forecasts, By End User Industry (2021-2032) (USD Billion)

12.3.5 Europe Wearable Devices Supporting Line-of-Business Applications Estimates And Forecasts, By Connectivity Technology (2021-2032) (USD Billion)

12.3.6 Europe Wearable Devices Supporting Line-of-Business Applications Estimates And Forecasts, By Deployment Type (2021-2032) (USD Billion)

12.3.7 Europe Wearable Devices Supporting Line-of-Business Applications Estimates And Forecasts, By Application Area (2021-2032) (USD Billion)

12.3.8 Poland

12.3.8.1 Poland Wearable Devices Supporting Line-of-Business Applications Estimates And Forecasts, By Device Type (2021-2032) (USD Billion)

12.3.8.2 Poland Wearable Devices Supporting Line-of-Business Applications Estimates And Forecasts, By End User Industry (2021-2032) (USD Billion)

12.3.8.3 Poland Wearable Devices Supporting Line-of-Business Applications Estimates And Forecasts, By Connectivity Technology (2021-2032) (USD Billion)

12.3.8.4 Poland Wearable Devices Supporting Line-of-Business Applications Estimates And Forecasts, By Deployment Type (2021-2032) (USD Billion)

12.3.8.5 Poland Wearable Devices Supporting Line-of-Business Applications Estimates And Forecasts, By Application Area (2021-2032) (USD Billion)

12.3.9 Turkey

12.3.9.1 Turkey Wearable Devices Supporting Line-of-Business Applications Estimates And Forecasts, By Device Type (2021-2032) (USD Billion)

12.3.9.2 Turkey Wearable Devices Supporting Line-of-Business Applications Estimates And Forecasts, By End User Industry (2021-2032) (USD Billion)

12.3.9.3 Turkey Wearable Devices Supporting Line-of-Business Applications Estimates And Forecasts, By Connectivity Technology (2021-2032) (USD Billion)

12.3.9.4 Turkey Wearable Devices Supporting Line-of-Business Applications Estimates And Forecasts, By Deployment Type (2021-2032) (USD Billion)

12.3.9.5 Turkey Wearable Devices Supporting Line-of-Business Applications Estimates And Forecasts, By Application Area (2021-2032) (USD Billion)

12.3.10 Germany

12.3.10.1 Germany Wearable Devices Supporting Line-of-Business Applications Estimates And Forecasts, By Device Type (2021-2032) (USD Billion)

12.3.10.2 Germany Wearable Devices Supporting Line-of-Business Applications Estimates And Forecasts, By End User Industry (2021-2032) (USD Billion)

12.3.10.3 Germany Wearable Devices Supporting Line-of-Business Applications Estimates And Forecasts, By Connectivity Technology (2021-2032) (USD Billion)

12.3.10.4 Germany Wearable Devices Supporting Line-of-Business Applications Estimates And Forecasts, By Deployment Type (2021-2032) (USD Billion)

12.3.10.5 Germany Wearable Devices Supporting Line-of-Business Applications Estimates And Forecasts, By Application Area (2021-2032) (USD Billion)

12.3.11 France

12.3.11.1 France Wearable Devices Supporting Line-of-Business Applications Estimates And Forecasts, By Device Type (2021-2032) (USD Billion)

12.3.11.2 France Wearable Devices Supporting Line-of-Business Applications Estimates And Forecasts, By End User Industry (2021-2032) (USD Billion)

12.3.11.3 France Wearable Devices Supporting Line-of-Business Applications Estimates And Forecasts, By Connectivity Technology (2021-2032) (USD Billion)

12.3.11.4 France Wearable Devices Supporting Line-of-Business Applications Estimates And Forecasts, By Deployment Type (2021-2032) (USD Billion)

12.3.11.5 France Wearable Devices Supporting Line-of-Business Applications Estimates And Forecasts, By Application Area (2021-2032) (USD Billion)

12.3.12 UK

12.3.12.1 UK Wearable Devices Supporting Line-of-Business Applications Estimates And Forecasts, By Device Type (2021-2032) (USD Billion)

12.3.12.2 UK Wearable Devices Supporting Line-of-Business Applications Estimates And Forecasts, By End User Industry (2021-2032) (USD Billion)

12.3.12.3 UK Wearable Devices Supporting Line-of-Business Applications Estimates And Forecasts, By Connectivity Technology (2021-2032) (USD Billion)

12.3.12.4 UK Wearable Devices Supporting Line-of-Business Applications Estimates And Forecasts, By Deployment Type (2021-2032) (USD Billion)

12.3.12.5 UK Wearable Devices Supporting Line-of-Business Applications Estimates And Forecasts, By Application Area (2021-2032) (USD Billion)

12.3.13 Italy

12.3.13.1 Italy Wearable Devices Supporting Line-of-Business Applications Estimates And Forecasts, By Device Type (2021-2032) (USD Billion)

12.3.13.2 Italy Wearable Devices Supporting Line-of-Business Applications Estimates And Forecasts, By End User Industry (2021-2032) (USD Billion)

12.3.13.3 Italy Wearable Devices Supporting Line-of-Business Applications Estimates And Forecasts, By Connectivity Technology (2021-2032) (USD Billion)

12.3.13.4 Italy Wearable Devices Supporting Line-of-Business Applications Estimates And Forecasts, By Deployment Type (2021-2032) (USD Billion)

12.3.13.5 Italy Wearable Devices Supporting Line-of-Business Applications Estimates And Forecasts, By Application Area (2021-2032) (USD Billion)

12.3.14 Spain

12.3.14.1 Spain Wearable Devices Supporting Line-of-Business Applications Estimates And Forecasts, By Device Type (2021-2032) (USD Billion)

12.3.14.2 Spain Wearable Devices Supporting Line-of-Business Applications Estimates And Forecasts, By End User Industry (2021-2032) (USD Billion)

12.3.14.3 Spain Wearable Devices Supporting Line-of-Business Applications Estimates And Forecasts, By Connectivity Technology (2021-2032) (USD Billion)

12.3.14.4 Spain Wearable Devices Supporting Line-of-Business Applications Estimates And Forecasts, By Deployment Type (2021-2032) (USD Billion)

12.3.14.5 Spain Wearable Devices Supporting Line-of-Business Applications Estimates And Forecasts, By Application Area (2021-2032) (USD Billion)

12.3.15 Rest Of Europe

12.3.15.1 Rest Of Western Europe Wearable Devices Supporting Line-of-Business Applications Estimates And Forecasts, By Device Type (2021-2032) (USD Billion)

12.3.15.2 Rest Of Western Europe Wearable Devices Supporting Line-of-Business Applications Estimates And Forecasts, By End User Industry (2021-2032) (USD Billion)

12.3.15.3 Rest Of Western Europe Wearable Devices Supporting Line-of-Business Applications Estimates And Forecasts, By Connectivity Technology (2021-2032) (USD Billion)

12.3.15.4 Rest Of Western Europe Wearable Devices Supporting Line-of-Business Applications Estimates And Forecasts, By Deployment Type (2021-2032) (USD Billion)

12.3.15.5 Rest Of Western Europe Wearable Devices Supporting Line-of-Business Applications Estimates And Forecasts, By Application Area (2021-2032) (USD Billion)

12.4 Asia Pacific

12.4.1 Trends Analysis

12.4.2 Asia Pacific Wearable Devices Supporting Line-of-Business Applications Estimates And Forecasts, By Country (2021-2032) (USD Billion)

12.4.3 Asia Pacific Wearable Devices Supporting Line-of-Business Applications Estimates And Forecasts, By Device Type (2021-2032) (USD Billion)

12.4.4 Asia Pacific Wearable Devices Supporting Line-of-Business Applications Estimates And Forecasts, By End User Industry (2021-2032) (USD Billion)

12.4.5 Asia Pacific Wearable Devices Supporting Line-of-Business Applications Estimates And Forecasts, By Connectivity Technology (2021-2032) (USD Billion)

12.4.6 Asia Pacific Wearable Devices Supporting Line-of-Business Applications Estimates And Forecasts, By Deployment Type (2021-2032) (USD Billion)

12.4.7 Asia Pacific Wearable Devices Supporting Line-of-Business Applications Estimates And Forecasts, By Application Area (2021-2032) (USD Billion)

12.4.8 China

12.4.8.1 China Wearable Devices Supporting Line-of-Business Applications Estimates And Forecasts, By Device Type (2021-2032) (USD Billion)

12.4.8.2 China Wearable Devices Supporting Line-of-Business Applications Estimates And Forecasts, By End User Industry (2021-2032) (USD Billion)

12.4.8.3 China Wearable Devices Supporting Line-of-Business Applications Estimates And Forecasts, By Connectivity Technology (2021-2032) (USD Billion)

12.4.8.4 China Wearable Devices Supporting Line-of-Business Applications Estimates And Forecasts, By Deployment Type (2021-2032) (USD Billion)

12.4.8.5 China Wearable Devices Supporting Line-of-Business Applications Estimates And Forecasts, By Application Area (2021-2032) (USD Billion)

12.4.9 India

12.4.9.1 India Wearable Devices Supporting Line-of-Business Applications Estimates And Forecasts, By Device Type (2021-2032) (USD Billion)

12.4.9.2 India Wearable Devices Supporting Line-of-Business Applications Estimates And Forecasts, By End User Industry (2021-2032) (USD Billion)

12.4.9.3 India Wearable Devices Supporting Line-of-Business Applications Estimates And Forecasts, By Connectivity Technology (2021-2032) (USD Billion)

12.4.9.4 India Wearable Devices Supporting Line-of-Business Applications Estimates And Forecasts, By Deployment Type (2021-2032) (USD Billion)

12.4.9.5 India Wearable Devices Supporting Line-of-Business Applications Estimates And Forecasts, By Application Area (2021-2032) (USD Billion)

12.4.10 Japan

12.4.10.1 Japan Wearable Devices Supporting Line-of-Business Applications Estimates And Forecasts, By Device Type (2021-2032) (USD Billion)

12.4.10.2 Japan Wearable Devices Supporting Line-of-Business Applications Estimates And Forecasts, By End User Industry (2021-2032) (USD Billion)

12.4.10.3 Japan Wearable Devices Supporting Line-of-Business Applications Estimates And Forecasts, By Connectivity Technology (2021-2032) (USD Billion)

12.4.10.4 Japan Wearable Devices Supporting Line-of-Business Applications Estimates And Forecasts, By Deployment Type (2021-2032) (USD Billion)

12.4.10.5 Japan Wearable Devices Supporting Line-of-Business Applications Estimates And Forecasts, By Application Area (2021-2032) (USD Billion)

12.4.11 South Korea

12.4.11.1 South Korea Wearable Devices Supporting Line-of-Business Applications Estimates And Forecasts, By Device Type (2021-2032) (USD Billion)

12.4.11.2 South Korea Wearable Devices Supporting Line-of-Business Applications Estimates And Forecasts, By End User Industry (2021-2032) (USD Billion)

12.4.11.3 South Korea Wearable Devices Supporting Line-of-Business Applications Estimates And Forecasts, By Connectivity Technology (2021-2032) (USD Billion)

12.4.11.4 South Korea Wearable Devices Supporting Line-of-Business Applications Estimates And Forecasts, By Deployment Type (2021-2032) (USD Billion)

12.4.11.5 South Korea Wearable Devices Supporting Line-of-Business Applications Estimates And Forecasts, By Application Area (2021-2032) (USD Billion)

12.4.12 Singapore

12.4.12.1 Singapore Wearable Devices Supporting Line-of-Business Applications Estimates And Forecasts, By Device Type (2021-2032) (USD Billion)

12.4.12.2 Singapore Wearable Devices Supporting Line-of-Business Applications Estimates And Forecasts, By End User Industry (2021-2032) (USD Billion)

12.4.12.3 Singapore Wearable Devices Supporting Line-of-Business Applications Estimates And Forecasts, By Connectivity Technology (2021-2032) (USD Billion)

12.4.12.4 Singapore Wearable Devices Supporting Line-of-Business Applications Estimates And Forecasts, By Deployment Type (2021-2032) (USD Billion)

12.4.12.5 Singapore Wearable Devices Supporting Line-of-Business Applications Estimates And Forecasts, By Application Area (2021-2032) (USD Billion)

12.4.13 Australia

12.4.13.1 Australia Wearable Devices Supporting Line-of-Business Applications Estimates And Forecasts, By Device Type (2021-2032) (USD Billion)

12.4.13.2 Australia Wearable Devices Supporting Line-of-Business Applications Estimates And Forecasts, By End User Industry (2021-2032) (USD Billion)

12.4.13.3 Australia Wearable Devices Supporting Line-of-Business Applications Estimates And Forecasts, By Connectivity Technology (2021-2032) (USD Billion)

12.4.13.4 Australia Wearable Devices Supporting Line-of-Business Applications Estimates And Forecasts, By Deployment Type (2021-2032) (USD Billion)

12.4.13.5 Australia Wearable Devices Supporting Line-of-Business Applications Estimates And Forecasts, By Application Area (2021-2032) (USD Billion)

12.4.14 Rest Of Asia Pacific

12.4.14.1 Rest Of Asia Pacific Wearable Devices Supporting Line-of-Business Applications Estimates And Forecasts, By Device Type (2021-2032) (USD Billion)

12.4.14.2 Rest Of Asia Pacific Wearable Devices Supporting Line-of-Business Applications Estimates And Forecasts, By End User Industry (2021-2032) (USD Billion)

12.4.14.3 Rest Of Asia Pacific Wearable Devices Supporting Line-of-Business Applications Estimates And Forecasts, By Connectivity Technology (2021-2032) (USD Billion)

12.4.14.4 Rest Of Asia Pacific Wearable Devices Supporting Line-of-Business Applications Estimates And Forecasts, By Deployment Type (2021-2032) (USD Billion)

12.4.14.5 Rest Of Asia Pacific Wearable Devices Supporting Line-of-Business Applications Estimates And Forecasts, By Application Area (2021-2032) (USD Billion)

12.5 Middle East And Africa

12.5.1 Trends Analysis

12.5.2 Middle East And Africa Wearable Devices Supporting Line-of-Business Applications Estimates And Forecasts, By Country (2021-2032) (USD Billion)

12.5.3 Middle East And Africa Wearable Devices Supporting Line-of-Business Applications Estimates And Forecasts, By Device Type (2021-2032) (USD Billion)

12.5.4 Middle East And Africa  Wearable Devices Supporting Line-of-Business Applications Estimates And Forecasts, By End User Industry (2021-2032) (USD Billion)

12.5.5 Middle East And Africa Wearable Devices Supporting Line-of-Business Applications Estimates And Forecasts, By Connectivity Technology (2021-2032) (USD Billion)

12.5.6 Middle East And Africa Wearable Devices Supporting Line-of-Business Applications Estimates And Forecasts, By Deployment Type (2021-2032) (USD Billion)

12.5.7 Middle East And Africa Wearable Devices Supporting Line-of-Business Applications Estimates And Forecasts, By Application Area (2021-2032) (USD Billion)

12.5.8 UAE

12.5.8.1 UAE Wearable Devices Supporting Line-of-Business Applications Estimates And Forecasts, By Device Type (2021-2032) (USD Billion)

12.5.8.2 UAE Wearable Devices Supporting Line-of-Business Applications Estimates And Forecasts, By End User Industry (2021-2032) (USD Billion)

12.5.8.3 UAE Wearable Devices Supporting Line-of-Business Applications Estimates And Forecasts, By Connectivity Technology (2021-2032) (USD Billion)

12.5.8.4 UAE Wearable Devices Supporting Line-of-Business Applications Estimates And Forecasts, By Deployment Type (2021-2032) (USD Billion)

12.5.8.5 UAE Wearable Devices Supporting Line-of-Business Applications Estimates And Forecasts, By Application Area (2021-2032) (USD Billion)

12.5.9 Saudi Arabia

12.5.9.1 Saudi Arabia Wearable Devices Supporting Line-of-Business Applications Estimates And Forecasts, By Device Type (2021-2032) (USD Billion)

12.5.9.2 Saudi Arabia Wearable Devices Supporting Line-of-Business Applications Estimates And Forecasts, By End User Industry (2021-2032) (USD Billion)

12.5.9.3 Saudi Arabia Wearable Devices Supporting Line-of-Business Applications Estimates And Forecasts, By Connectivity Technology (2021-2032) (USD Billion)

12.5.9.4 Saudi Arabia Wearable Devices Supporting Line-of-Business Applications Estimates And Forecasts, By Deployment Type (2021-2032) (USD Billion)

12.5.9.5 Saudi Arabia Wearable Devices Supporting Line-of-Business Applications Estimates And Forecasts, By Application Area (2021-2032) (USD Billion)

12.5.10 Qatar

12.5.10.1 Qatar Wearable Devices Supporting Line-of-Business Applications Estimates And Forecasts, By Device Type (2021-2032) (USD Billion)

12.5.10.2 Qatar Wearable Devices Supporting Line-of-Business Applications Estimates And Forecasts, By End User Industry (2021-2032) (USD Billion)

12.5.10.3 Qatar Wearable Devices Supporting Line-of-Business Applications Estimates And Forecasts, By Connectivity Technology (2021-2032) (USD Billion)

12.5.10.4 Qatar Wearable Devices Supporting Line-of-Business Applications Estimates And Forecasts, By Deployment Type (2021-2032) (USD Billion)

12.5.10.5 Qatar Wearable Devices Supporting Line-of-Business Applications Estimates And Forecasts, By Application Area (2021-2032) (USD Billion)

12.5.11 South Africa

12.5.11.1 South Africa Wearable Devices Supporting Line-of-Business Applications Estimates And Forecasts, By Device Type (2021-2032) (USD Billion)

12.5.11.2 South Africa Wearable Devices Supporting Line-of-Business Applications Estimates And Forecasts, By End User Industry (2021-2032) (USD Billion)

12.5.11.3 South Africa Wearable Devices Supporting Line-of-Business Applications Estimates And Forecasts, By Connectivity Technology (2021-2032) (USD Billion)

12.5.11.4 South Africa Wearable Devices Supporting Line-of-Business Applications Estimates And Forecasts, By Deployment Type (2021-2032) (USD Billion)

12.5.11.5 South Africa Wearable Devices Supporting Line-of-Business Applications Estimates And Forecasts, By Application Area (2021-2032) (USD Billion)

12.5.12 Rest Of Africa

12.5.12.1 Rest Of Africa Wearable Devices Supporting Line-of-Business Applications Estimates And Forecasts, By Device Type (2021-2032) (USD Billion)

12.5.12.2 Rest Of Africa Wearable Devices Supporting Line-of-Business Applications Estimates And Forecasts, By End User Industry (2021-2032) (USD Billion)

12.5.12.3 Rest Of Africa Wearable Devices Supporting Line-of-Business Applications Estimates And Forecasts, By Connectivity Technology (2021-2032) (USD Billion)

12.5.12.4 Rest Of Africa Wearable Devices Supporting Line-of-Business Applications Estimates And Forecasts, By Deployment Type (2021-2032) (USD Billion)

12.5.12.5 Rest Of Africa Wearable Devices Supporting Line-of-Business Applications Estimates And Forecasts, By Application Area (2021-2032) (USD Billion)

12.6 Latin America

12.6.1 Trends Analysis

12.6.2 Latin America Wearable Devices Supporting Line-of-Business Applications Estimates And Forecasts, By Country (2021-2032) (USD Billion)

12.6.3 Latin America Wearable Devices Supporting Line-of-Business Applications Estimates And Forecasts, By Device Type (2021-2032) (USD Billion)

12.6.4 Latin America Wearable Devices Supporting Line-of-Business Applications Estimates And Forecasts, By End User Industry (2021-2032) (USD Billion)

12.6.5 Latin America Wearable Devices Supporting Line-of-Business Applications Estimates And Forecasts, By Connectivity Technology (2021-2032) (USD Billion)

12.6.6 Latin America Wearable Devices Supporting Line-of-Business Applications Estimates And Forecasts, By Deployment Type (2021-2032) (USD Billion)

12.6.7 Latin America Wearable Devices Supporting Line-of-Business Applications Estimates And Forecasts, By Application Area (2021-2032) (USD Billion)

12.6.8 Brazil

12.6.8.1 Brazil Wearable Devices Supporting Line-of-Business Applications Estimates And Forecasts, By Device Type (2021-2032) (USD Billion)

12.6.8.2 Brazil Wearable Devices Supporting Line-of-Business Applications Estimates And Forecasts, By End User Industry (2021-2032) (USD Billion)

12.6.8.3 Brazil Wearable Devices Supporting Line-of-Business Applications Estimates And Forecasts, By Connectivity Technology (2021-2032) (USD Billion)

12.6.8.4 Brazil Wearable Devices Supporting Line-of-Business Applications Estimates And Forecasts, By Deployment Type (2021-2032) (USD Billion)

12.6.8.5 Brazil Wearable Devices Supporting Line-of-Business Applications Estimates And Forecasts, By Application Area (2021-2032) (USD Billion)

12.6.9 Argentina

12.6.9.1 Argentina Wearable Devices Supporting Line-of-Business Applications Estimates And Forecasts, By Device Type (2021-2032) (USD Billion)

12.6.9.2 Argentina Wearable Devices Supporting Line-of-Business Applications Estimates And Forecasts, By End User Industry (2021-2032) (USD Billion)

12.6.9.3 Argentina Wearable Devices Supporting Line-of-Business Applications Estimates And Forecasts, By Connectivity Technology (2021-2032) (USD Billion)

12.6.9.4 Argentina Wearable Devices Supporting Line-of-Business Applications Estimates And Forecasts, By Deployment Type (2021-2032) (USD Billion)

12.6.9.5 Argentina Wearable Devices Supporting Line-of-Business Applications Estimates And Forecasts, By Application Area (2021-2032) (USD Billion)

12.6.10 Rest Of Latin America

12.6.10.1 Rest Of Latin America Wearable Devices Supporting Line-of-Business Applications Estimates And Forecasts, By Device Type (2021-2032) (USD Billion)

12.6.10.2 Rest Of Latin America Wearable Devices Supporting Line-of-Business Applications Estimates And Forecasts, By End User Industry (2021-2032) (USD Billion)

12.6.10.3 Rest Of Latin America Wearable Devices Supporting Line-of-Business Applications Estimates And Forecasts, By Connectivity Technology (2021-2032) (USD Billion)

12.6.10.4 Rest Of Latin America Wearable Devices Supporting Line-of-Business Applications Estimates And Forecasts, By Deployment Type (2021-2032) (USD Billion)

12.6.10.5 Rest Of Latin America Wearable Devices Supporting Line-of-Business Applications Estimates And Forecasts, By Application Area (2021-2032) (USD Billion)

13. Company Profiles

     13.1 Alteryx

13.1.1 Company Overview

13.1.2 Financial

13.1.3 Products/ Services Offered

13.1.4 SWOT Analysis

    13.2 AWS   

13.2.1 Company Overview

13.2.2 Financial

13.2.3 Products/ Services Offered

13.2.4 SWOT Analysis

   13.3 Google

13.3.1 Company Overview

13.3.2 Financial

13.3.3 Products/ Services Offered

13.3.4 SWOT Analysis

  13.4 IBM

13.4.1 Company Overview

13.4.2 Financial

13.4.3 Products/ Services Offered

13.4.4 SWOT Analysis

  13.5 Informatica

13.5.1 Company Overview

13.5.2 Financial

13.5.3 Products/ Services Offered

13.5.4 SWOT Analysis

  13.6 Microsoft Corporation

13.6.1 Company Overview

13.6.2 Financial

13.6.3 Products/ Services Offered

13.6.4 SWOT Analysis

 13.7 Oracle

13.7.1 Company Overview

13.7.2 Financial

13.7.3 Products/ Services Offered

13.7.4 SWOT Analysis

 13.8 SAP

13.8.1 Company Overview

13.8.2 Financial

13.8.3 Products/ Services Offered

13.8.4 SWOT Analysis

 13.9 SAS

13.9.1 Company Overview

13.9.2 Financial

13.9.3 Products/ Services Offered

13.9.4 SWOT Analysis

  13.10 Talend

13.10.1 Company Overview

13.10.2 Financial

13.10.3 Products/ Services Offered

13.10.4 SWOT Analysis

14. Use Cases and Best Practices

15. Conclusion

An accurate research report requires proper strategizing as well as implementation. There are multiple factors involved in the completion of good and accurate research report and selecting the best methodology to compete the research is the toughest part. Since the research reports we provide play a crucial role in any company’s decision-making process, therefore we at SNS Insider always believe that we should choose the best method which gives us results closer to reality. This allows us to reach at a stage wherein we can provide our clients best and accurate investment to output ratio.

Each report that we prepare takes a timeframe of 350-400 business hours for production. Starting from the selection of titles through a couple of in-depth brain storming session to the final QC process before uploading our titles on our website we dedicate around 350 working hours. The titles are selected based on their current market cap and the foreseen CAGR and growth.


The 5 steps process:

Step 1: Secondary Research:

Secondary Research or Desk Research is as the name suggests is a research process wherein, we collect data through the readily available information. In this process we use various paid and unpaid databases which our team has access to and gather data through the same. This includes examining of listed companies’ annual reports, Journals, SEC filling etc. Apart from this our team has access to various associations across the globe across different industries. Lastly, we have exchange relationships with various university as well as individual libraries.

Secondary Research

Step 2: Primary Research

When we talk about primary research, it is a type of study in which the researchers collect relevant data samples directly, rather than relying on previously collected data.  This type of research is focused on gaining content specific facts that can be sued to solve specific problems. Since the collected data is fresh and first hand therefore it makes the study more accurate and genuine.

We at SNS Insider have divided Primary Research into 2 parts.

Part 1 wherein we interview the KOLs of major players as well as the upcoming ones across various geographic regions. This allows us to have their view over the market scenario and acts as an important tool to come closer to the accurate market numbers. As many as 45 paid and unpaid primary interviews are taken from both the demand and supply side of the industry to make sure we land at an accurate judgement and analysis of the market.

This step involves the triangulation of data wherein our team analyses the interview transcripts, online survey responses and observation of on filed participants. The below mentioned chart should give a better understanding of the part 1 of the primary interview.

Primary Research

Part 2: In this part of primary research the data collected via secondary research and the part 1 of the primary research is validated with the interviews from individual consultants and subject matter experts.

Consultants are those set of people who have at least 12 years of experience and expertise within the industry whereas Subject Matter Experts are those with at least 15 years of experience behind their back within the same space. The data with the help of two main processes i.e., FGDs (Focused Group Discussions) and IDs (Individual Discussions). This gives us a 3rd party nonbiased primary view of the market scenario making it a more dependable one while collation of the data pointers.

Step 3: Data Bank Validation

Once all the information is collected via primary and secondary sources, we run that information for data validation. At our intelligence centre our research heads track a lot of information related to the market which includes the quarterly reports, the daily stock prices, and other relevant information. Our data bank server gets updated every fortnight and that is how the information which we collected using our primary and secondary information is revalidated in real time.

Data Bank Validation

Step 4: QA/QC Process

After all the data collection and validation our team does a final level of quality check and quality assurance to get rid of any unwanted or undesired mistakes. This might include but not limited to getting rid of the any typos, duplication of numbers or missing of any important information. The people involved in this process include technical content writers, research heads and graphics people. Once this process is completed the title gets uploader on our platform for our clients to read it.

Step 5: Final QC/QA Process:

This is the last process and comes when the client has ordered the study. In this process a final QA/QC is done before the study is emailed to the client. Since we believe in giving our clients a good experience of our research studies, therefore, to make sure that we do not lack at our end in any way humanly possible we do a final round of quality check and then dispatch the study to the client.

Key Segments: 

   By Device Type

  • Smartwatches

  • Fitness Trackers

  • Smart Glasses

  • Health Monitors

  • Wearable Payment Devices

    By End User Industry

  • Healthcare

  • Manufacturing

  • Retail

  • Logistics and Supply Chain

  • Construction

   By Application Area

  • Employee Monitoring

  • Health and Safety Compliance

  • Asset Tracking

  • Field Service Management

  • Business Process Optimization

   By Connectivity Technology

  • Bluetooth

  • Wi-Fi

  • Cellular

  • NFC (Near Field Communication)

  • RFID (Radio Frequency Identification)

   By Deployment Type

  • On-Premises Deployment

  • Cloud-Based Deployment

  • Hybrid Deployment

Request for Segment Customization as per your Business Requirement: Segment Customization Request

Regional Coverage: 

North America

  • US

  • Canada

  • Mexico

Europe

  • Germany

  • France

  • UK

  • Italy

  • Spain

  • Poland

  • Turkey

  • Rest of Europe

Asia Pacific

  • China

  • India

  • Japan

  • South Korea

  • Singapore

  • Australia

  • Rest of Asia Pacific

Middle East & Africa

  • UAE

  • Saudi Arabia

  • Qatar

  • South Africa

  • Rest of Middle East & Africa

Latin America

  • Brazil

  • Argentina

  • Rest of Latin America

Request for Country Level Research Report: Country Level Customization Request

Available Customization 

With the given market data, SNS Insider offers customization as per the company’s specific needs. The following customization options are available for the report: 

  • Detailed Volume Analysis 

  • Criss-Cross segment analysis (e.g. Product X Application) 

  • Competitive Product Benchmarking 

  • Geographic Analysis 

  • Additional countries in any of the regions 

  • Customized Data Representation 

  • Detailed analysis and profiling of additional market players

Explore Key Insights.


  • Analyzes market trends, forecasts, and regional dynamics
  • Covers core offerings, innovations, and industry use cases
  • Profiles major players, value chains, and strategic developments
  • Highlights innovation trends, regulatory impacts, and growth opportunities
Request an Analyst Call