Wheelchair Market Size & Overview:
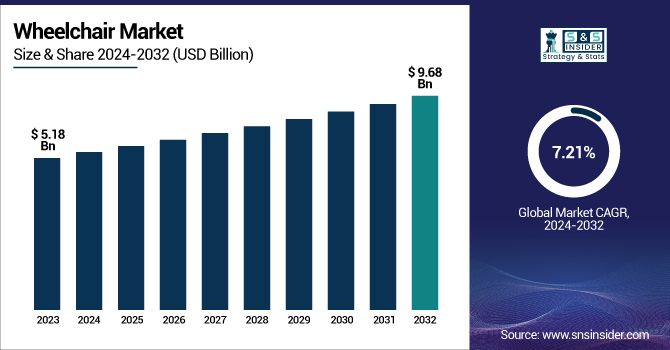
The Wheelchair Market is anticipated to grow from USD 5.18 billion in 2023 to USD 9.68 billion by 2032, at a CAGR of 7.21% over the forecast period. Directly affecting world demand, this paper emphasizes the growing frequency of mobility disabilities and rising disability rates. Along with annual units sold, the study looks at wheelchair usage penetration and acceptance patterns across countries, highlighting the notable increase in both established and developing markets. It also examines regional healthcare and assistive device spending, accounting for government initiatives, insurance coverage, personal investments, and out-of-pocket costs. While development in rehabilitation and long-term care institutions is increasing institutional demand, the paper also looks at how aging population trends are accelerating the need for mobility solutions.
Get More Information on Wheelchair Market - Request Sample Report
US Wheelchair Market Overview
The US Wheelchair Market is expected to grow at a compound annual growth rate (CAGR) of 6.34% during the period 2024-2032, from its 2023 value of USD 1.53 billion to USD 2.65 billion. Driven by an aging population, favorable reimbursement systems, and rising expenditures in customized mobility solutions, the wheelchair market is seeing ongoing expansion in the United States.
Market Dynamics
Drivers
-
The wheelchair market is driven by a growing aging population, rising disability prevalence, and advancements in assistive technologies.
One of the main drivers pushing the wheelchair industry is the growing worldwide geriatric population. The World Health Organization states that the population aged 60 and older will hit 2.1 billion by 2050, up from 1 billion in 2020. Mobility impairments caused by age, including arthritis, stroke, and Parkinson's disease, heavily drive the demand for wheelchairs. Additionally, an increase in accident- and injury-related disabilities, e.g., spinal cord injuries (affecting more than 250,000 individuals each year in the United States alone), further drives the market. Advancements in technology are also crucial, particularly the use of intelligent and powered wheelchairs equipped with voice-control capabilities, navigation sensors, and posture-adjusting systems. All these are enhancing user autonomy and quality of life, thus rendering wheelchairs increasingly attractive. In addition, growing awareness and access to healthcare services and assistive equipment, through government assistance programs, including Medicare and Americans with Disabilities Act (ADA) compliance programs, are driving increased product adoption. Together, these are building demand in both home and institutional environments, fueling steady growth in the global wheelchair market.
Restraints
-
High costs, lack of accessibility in low-income regions, and reimbursement limitations act as major restraints for the wheelchair market.
One of the strongest constraints on the wheelchair market is the expense of high-tech and powered wheelchair models, which can cost between USD 1,500 and more than USD 15,000. These prices tend to price high-tech models out of the reach of many, especially in low- and middle-income nations. Furthermore, access to suitable wheelchairs remains limited in underserved areas, where infrastructure, distribution networks, and healthcare services are underdeveloped. A 2021 WHO report pointed out that just 10% of individuals who require assistive devices in developing countries end up having them. Furthermore, insurance and reimbursement restrictions in various countries limit patients' access. In the United States, for instance, Medicare only covers certain wheelchairs and demands evidence of medical need, which hinders the process. Likewise, payment policies in much of Asia and Africa are either non-existent or weakly supportive. Customization and fitting services, which are essential to wheelchair use and comfort, are likewise underfinanced, further discouraging buying. Such economic and structural deterrents still discourage equal access to wheelchairs, particularly among the economically poorer and rural areas.
Opportunities
-
Emerging markets, smart wheelchair innovations, and supportive policy frameworks offer substantial growth opportunities for the industry.
The wheelchairs market is experiencing high demand due to intense opportunities created through fast urbanization and enhanced healthcare infrastructure in growing economies like India, Brazil, and Indonesia. As more and more investments are being made in rehabilitation centers and old-age homes, the market for wheelchairs is about to surge extremely. Additionally, the spread of smart technologies is revolutionizing the sector. For instance, firms such as WHILL Inc. and Sunrise Medical are introducing AI-powered and app-enabled wheelchairs that appeal to tech-conscious customers and those interested in improved mobility solutions. Also, increasing e-commerce penetration enables consumers in distant locations to get access to various wheelchair products, enhancing market reach. Another future opportunity is through public-private partnerships for inclusive mobility. The WHO's "Global Cooperation on Assistive Technology (GATE)" initiative is an example that calls for innovation, capacity development, and universal accessibility to assistive products. Additionally, a growing demand for inclusive design and universal accessibility in urban planning is expected to drive wheelchair uptake in public spaces, educational institutions, and workplaces. All together, these advances offer a wide scope for growth, particularly for companies specializing in affordability, digital compatibility, and patient-specific customization.
Challenges
-
Despite growing demand, the wheelchair market faces challenges in design standardization, user training, and long-term maintenance.
One of the most significant challenges facing the wheelchair industry is the absence of worldwide design and product standardization. With varied user requirements ranging from pediatric to bariatric to sports uses, manufacturers tend to make highly specialized models, which creates challenges in simplifying production and maintenance. Poor user training is another issue; numerous users, particularly in developing nations, have minimal or no instruction for correct wheelchair usage, resulting in accidents or abandonment. Improper wheelchair use can elevate the risk of pressure ulcers, spinal deformity, and repetitive strain injury, as seen in a study published in Disability and Rehabilitation: Assistive Technology. Maintenance and repair services are likewise poorly established in much of the world. Even in industrialized markets, users tend to experience delays in repair because of a shortage of trained technicians or spare parts, restricting mobility and independence. Furthermore, social stigma related to wheelchair use still impacts adoption, especially in traditional societies. Lastly, product lifecycle issues such as recycling, disposal, and material sustainability are rapidly becoming more critical issues, particularly as demand increases worldwide. Addressing these multifaceted issues is essential for long-term market stability and user satisfaction.
Wheelchair Market Segmentation Analysis
By Product
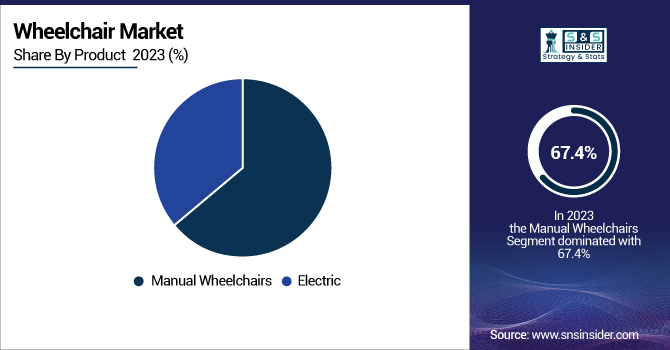
With roughly 67.4% of the total income, the category for manual wheelchairs controlled the worldwide market in 2023. Its low maintenance requirements, affordability, simplicity of use, and more general availability in both developed and underdeveloped areas help to explain this supremacy. Commonly recommended for temporary mobility problems, manual wheelchairs are chosen for personal and institutional use because of their lightweight and folding features.
The category for electric wheelchairs is expected to expand quickest over the coming years. Rising demand for improved comfort, user freedom, and advanced mobility solutions—especially among those with chronic disabilities and older populations—drives this development. Adoption of electric wheelchairs is being driven even more by growing innovation in areas including terrain adaptation, joystick controls, and voice-activated functions.
By Category
With a 74.4% revenue share, the adult group dominated 2023. This is mostly related to the worldwide rising older population and the great frequency of movement problems in adults resulting from diseases such as arthritis, stroke, and spinal cord injuries. Wheelchairs in this category are likewise in constant demand since the adult demographic also includes those healing from accidents or surgery.
The pediatric market is predicted to expand significantly throughout the forecast period meantime. Key drivers supporting the expansion of this segment are growing awareness of childhood mobility diseases like cerebral palsy and muscular dystrophy, as well as growing availability of customized pediatric wheelchair designs.
By Application
With a market share of 38.4%, the category of rehabilitation centers turned up as the biggest revenue producer in 2023. For those healing from accidents or operations, these centers are quite important for long-term mobility support and post-operative care. Wheelchair demand in this market is greatly increased by the increasing number of rehabilitation facilities, especially in metropolitan areas, as well as by their highly volume buying policies.
Still, from 2024 to 2032, the hospital category is predicted to increase the fastest. Along with better healthcare infrastructure and investments in patient mobility solutions, rising hospital admissions connected to orthopedic and neurological diseases drive this spike. This industry is moving ahead, especially with the growing emphasis on patient-centric care and mobility assistance inside hospital settings.
Regional Insights
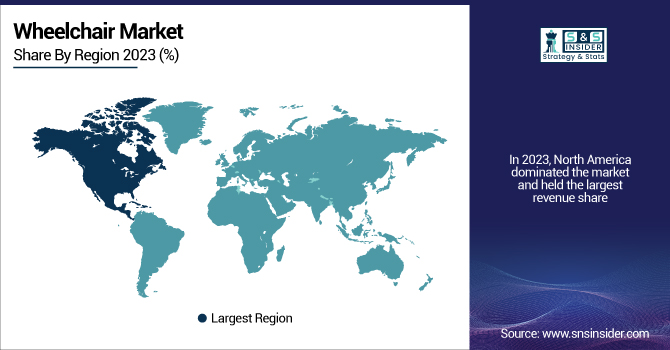
With its advanced healthcare infrastructure, outrageous healthcare expenditure, and favorable reimbursement regulations, North America dominated the worldwide wheelchairs market in 2023. Its dominance also stems from top market players, rising geriatric population, and strong government programs in favor of assistive mobility devices. Particularly notable is the United States, where programs like Medicare and the Americans with Disabilities Act (ADA) provide subsidies for wheelchair use and accessibility, therefore fostering great degrees of adoption.
The Asia Pacific market is probably going to have the fastest increase over the projection period. Rising awareness of mobility solutions, a fast-aging population, and increasing investments in healthcare infrastructure all help to drive this development. Rising numbers of disabilities, road traffic accidents, and chronic ailments have led China, India, and Japan to experience great demand. For instance, the United Nations projects that by 2025, around 25% of Asia's population will be aged 60 and above, significantly influencing the demand for mobility aids. Furthermore, influencing market potential among developing Asian countries are government-driven initiatives to improve accessibility for the disabled, as well as the explosion in rehabilitation services.
Get Customized Report as per Your Business Requirement - Enquiry Now
Key Players in the Wheelchair Market
-
Carex Health Brands, Inc. – Carex Classic Wheelchair, Carex Transport Chair
-
Drive Medical Design & Manufacturing – Silver Sport Wheelchair, Cruiser III Wheelchair, Fly Lite Transport Chair, IntelliPAP Travel Wheelchair
-
Graham-Field Health Products Inc. – Everest & Jennings Advantage Wheelchair, Lumex Hybrid LX Rollator/Transport Chair
-
Invacare Corporation – Tracer SX5, TDX SP2 Power Wheelchair, Top End Crossfire All Terrain, AVIVA FX Power Wheelchair
-
Medline Industries, LP – Medline K4 Lightweight Wheelchair, Excel 2000 Wheelchair, Medline Ultralight Transport Chair
-
Sunrise Medical LLC – Quickie Q500 M Power Wheelchair, Zippie Voyage, Quickie 2, Breezy Ultra 4
-
Karman Healthcare – Ergo Flight, S-115 Ergonomic Wheelchair, XO-202 Standing Wheelchair, KM5000 Reclining Wheelchair
-
Quantum Rehab – Edge 3 Power Chair, 4Front 2 Power Wheelchair, Q6 Edge Z
-
Numotion – Custom Manual Wheelchairs, Power Assist Devices, Complex Power Chairs (via OEM partnerships)
-
Pride Mobility Products Corp. – Jazzy Elite ES, Go Chair, Jazzy Air 2, Jazzy Passport
-
Seating Matters – Phoenix Chair, Monaco Chair, Atlanta Chair, Sorrento Chair
Recent Developments
In December 2024, Medtrade exhibitor Pride Mobility recently debuted the lightweight and compact Go Go Super Portable and the Jazzy Ultra-Light power wheelchair. The Go Go Super Portable is a mobility scooter that is easy to fold, charge, and store.
In Sept 2024, Sunrise Medical is pleased to announce the launch of the Red Dot award-winning Empulse R90 push assist device. This sleek, simple, and smart push device powers manual wheelchairs with ease, allowing riders to go longer distances, receive assistance up ramps, preserve energy, and prevent shoulder strain.
In July 2024, Drive DeVilbiss Healthcare (DDH) is pleased to announce the acquisition of Mobility Designed, Inc.'s full portfolio of products. This strategic acquisition will enhance DDH's portfolio of innovative medical equipment while integrating cutting-edge industrial design expertise directly into its operations.
In March 2024, Medline, a market-leading manufacturer and supplier of medical supplies and solutions, announced the successful acquisition of the manufacturing rights and intellectual property of AG Cuffill from Hospitech Respiration Ltd. The compact and intuitive syringe-like device provides an accurate solution for measuring both pressure and volume of airway cuffs in all clinical settings.
| Report Attributes | Details |
| Market Size in 2023 | USD 5.18 billion |
| Market Size by 2032 | USD 9.68 billion |
| CAGR | CAGR of 7.21% From 2024 to 2032 |
| Base Year | 2023 |
| Forecast Period | 2024-2032 |
| Historical Data | 2020-2022 |
| Report Scope & Coverage | Market Size, Segments Analysis, Competitive Landscape, Regional Analysis, DROC & SWOT Analysis, Forecast Outlook |
| Key Segments | • By Product [Manual, Electric] • By Category [Adult, Pediatric] • By Application [Homecare, Hospitals, Ambulatory Surgical Centers, Rehabilitation Centers] |
| Regional Analysis/Coverage | North America (US, Canada, Mexico), Europe (Eastern Europe [Poland, Romania, Hungary, Turkey, Rest of Eastern Europe] Western Europe] Germany, France, UK, Italy, Spain, Netherlands, Switzerland, Austria, Rest of Western Europe]), Asia Pacific (China, India, Japan, South Korea, Vietnam, Singapore, Australia, Rest of Asia Pacific), Middle East & Africa (Middle East [UAE, Egypt, Saudi Arabia, Qatar, Rest of Middle East], Africa [Nigeria, South Africa, Rest of Africa], Latin America (Brazil, Argentina, Colombia, Rest of Latin America) |
| Company Profiles | Carex Health Brands, Inc., Drive Medical Design & Manufacturing, Graham-Field Health Products Inc., Invacare Corporation, Medline Industries, LP, Sunrise Medical LLC, Karman Healthcare, Quantum Rehab, Numotion, Pride Mobility Products Corp., Seating Matters. |
Frequently Asked Questions
Ans: Yes, you may request customization based on your company's needs.
Ans: The leading participants in the wheelchair market are Carex Health BrandsInc., Drive Medical Design & Manufacturing, Graham-Field Health Products Inc., Invacare, Medline
Ans: The growing senior population, the increasing number of ailments needing a wheelchair, and the growing handicapped population are key drivers driving wheelchair market growth.
Ans: According to our analysis, the Wheelchair Market is anticipated to reach USD 9.68 billion By 2032.
Ans: The Wheelchair Market is expected to grow at 7.21% CAGR from 2024 to 2032.
Get in Touch
