Wi-Fi 6 Market Report Scope & Overview:
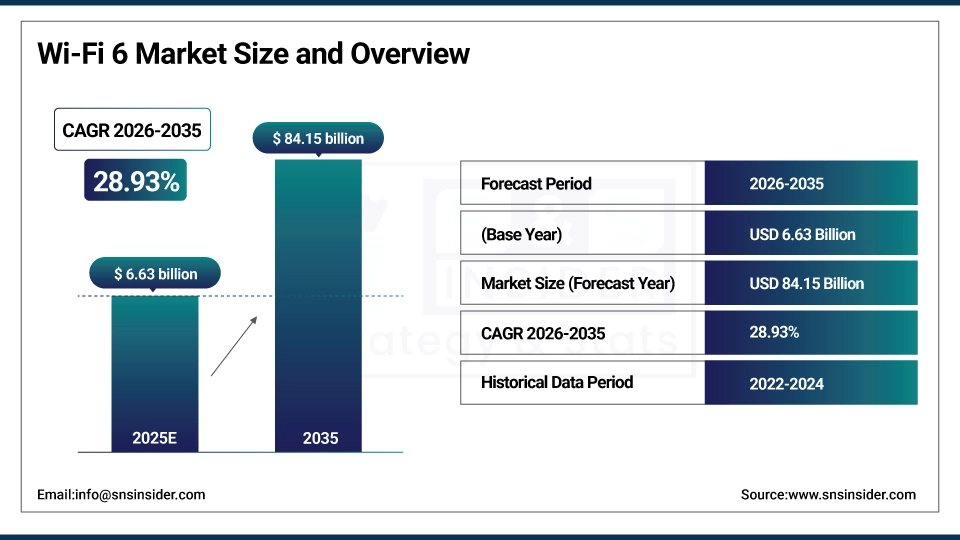
The Wi-Fi 6 Market Size was valued at USD 6.63 billion in 2025E and is expected to reach USD 84.15 billion by 2035, growing at a CAGR of 28.93% from 2026-2035.
The Wi-Fi 6 Market is growing rapidly due to increasing demand for high-speed, low-latency wireless connectivity across enterprises, homes, and public networks. Expansion of IoT devices, smart home solutions, and cloud-based applications, along with rising adoption in telecom, healthcare, and education sectors, is driving growth. Technological advancements in network efficiency and capacity further fuel market expansion.
Wi-Fi 6 Market Size and Growth Projection
-
Market Size in 2025E: USD 6.63 Billion
-
Market Size by 2035: USD 84.15 Billion
-
CAGR: 28.93% from 2026 to 2035
-
Base Year: 2025
-
Forecast Period: 2026–2035
-
Historical Data: 2022–2024
To Get more information on Wi-Fi 6 Market - Request Free Sample Report
Wi-Fi 6 Market Trends
-
Rising demand for high-speed, low-latency, and reliable wireless connectivity is driving the Wi-Fi 6 market.
-
Growing adoption across enterprise, residential, and public networks is boosting market growth.
-
Expansion of smart homes, IoT devices, and connected infrastructure is fueling Wi-Fi 6 deployment.
-
Advancements in MU-MIMO, OFDMA, and target wake time (TWT) technologies are enhancing efficiency and network performance.
-
Increasing focus on network security, seamless roaming, and backward compatibility is shaping market trends.
-
Collaborations between chipset manufacturers, device OEMs, and service providers are accelerating innovation and adoption.
-
Growing demand for next-generation applications such as AR/VR, cloud gaming, and HD video streaming is supporting global market expansion.
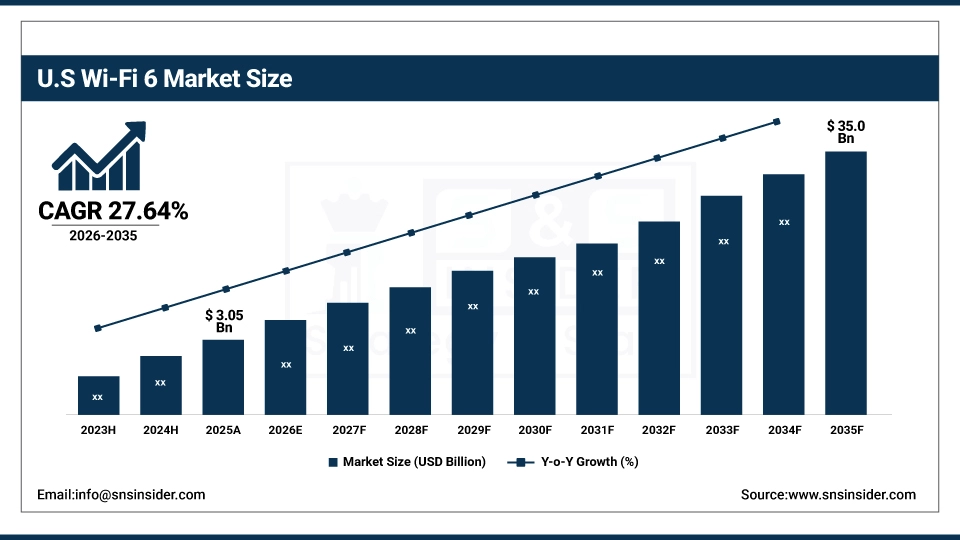
U.S. Wi-Fi 6 market Size Outlook
The U.S. Wi-Fi 6 market size was valued at an estimated USD 3.05 billion in 2025 and is projected to reach USD 35 billion by 2035, growing at a CAGR of 27.64% over the forecast period 2026–2035. Market growth is driven by the rapid increase in connected devices, rising demand for high-speed and low-latency wireless connectivity, and growing deployment of smart homes, smart offices, and IoT ecosystems. Accelerated adoption across enterprise networks, educational institutions, healthcare facilities, and public infrastructure is further boosting market expansion. Additionally, advancements in Wi-Fi 6 and Wi-Fi 6E technologies, increased investments in next-generation networking infrastructure, and expanding use cases in cloud computing, streaming, and gaming strengthen the robust growth outlook of the U.S. Wi-Fi 6 market.
Wi-Fi 6 Market Growth Drivers:
-
Synergy Between 5G and Wi-Fi 6: Driving the Future of Connectivity
The increasing adoption of 5G networks is significantly propelling the growth of the Wi-Fi 6 market, as both technologies complement each other to deliver enhanced data speeds, reduced latency, and seamless connectivity. 5G offers faster speeds, lower latency, and more reliable connectivity compared to previous cellular networks, making it essential for supporting the exponential rise in data traffic from IoT devices, smartphones, and connected systems. Wi-Fi 6 (802.11ax) further amplifies these benefits by optimizing wireless performance, especially in high-density environments such as stadiums, airports, and offices.
Wi-Fi 6 Market Restraints:
-
The complexity of deployment in high-density environments is a major challenge limiting the growth of the Wi-Fi 6 market.
The Wi-Fi 6 market faces significant challenges due to the complexity involved in its deployment, especially in high-density environments like stadiums, airports, office buildings, and other areas with heavy foot traffic. Unlike previous Wi-Fi versions, Wi-Fi 6 incorporates advanced technologies, such as Orthogonal Frequency Division Multiple Access (OFDMA) and Multi-User, Multiple Input, Multiple Output (MU-MIMO), which require a more sophisticated network design to support higher device density and manage increased traffic. This necessitates meticulous planning, including thorough site surveys, to ensure that the infrastructure is optimized for the best performance.
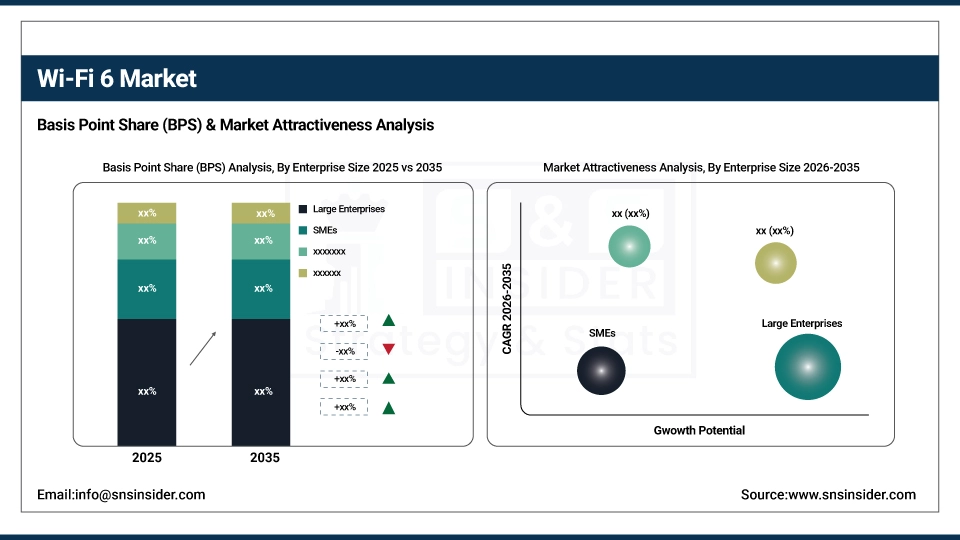
Wi-Fi 6 Market Segment Analysis
By Enterprise Size, Large Enterprises dominated with ~65% share in 2024; SMEs fastest growing (CAGR)
In 2025, the large enterprises segment dominated the Wi-Fi 6 market, accounting for approximately 65% of the total market share. This is due to the growing need for high-performance, scalable, and reliable networking solutions in large-scale operations. Large enterprises, including multinational corporations, government organizations, and tech giants, require robust wireless networks to support a wide range of devices, applications, and high-density environments. Wi-Fi 6 offers superior capacity, faster speeds, and improved efficiency, making it an ideal solution for managing the increased traffic generated by IoT devices, mobile devices, and cloud-based applications.
By Location, Outdoor dominated with ~55% share in 2025; Indoor fastest growing (CAGR)
In 2025, the outdoor segment dominated the Wi-Fi 6 market, accounting for approximately 55% of the total market share. The growing demand for high-speed, reliable connectivity in outdoor spaces such as stadiums, public parks, outdoor events, and large public areas has significantly boosted this trend. Wi-Fi 6's ability to handle high-density traffic and provide seamless coverage in expansive environments makes it the ideal choice for outdoor deployments. Its advanced features like Orthogonal Frequency Division Multiple Access (OFDMA) and Multi-User MIMO (MU-MIMO) allow for efficient spectrum management, ensuring uninterrupted connectivity even in crowded outdoor settings.
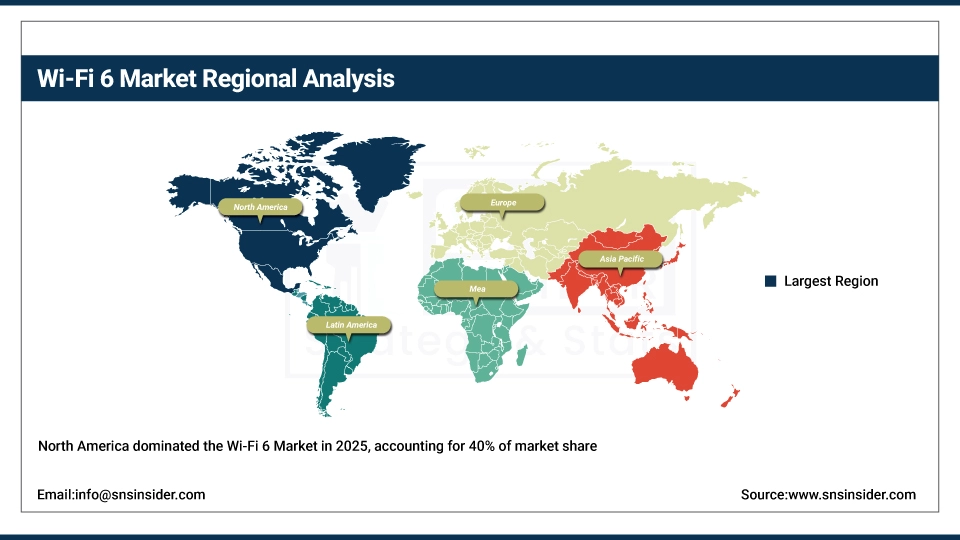
Regional Analysis
North America Wi-Fi 6 Market Insight
In 2025, North America dominated the Wi-Fi 6 market, accounting for approximately 40% of the global revenue share. This dominance can be attributed to several factors, including the region's early adoption of cutting-edge technologies, strong infrastructure, and high demand for high-speed, reliable connectivity in both enterprise and consumer sectors. North American businesses, particularly in industries like technology, healthcare, education, and retail, have been quick to adopt Wi-Fi 6 to meet the growing need for seamless connectivity in high-density environments.
Get Customized Report as per Your Business Requirement - Enquiry Now
Asia Pacific Wi-Fi 6 Market Insights
Asia-Pacific is the fastest-growing region in the Wi-Fi 6 market, expected to witness substantial growth from 2026 to 2035. This rapid expansion is driven by increasing urbanization, a surge in smart city initiatives, and the growing demand for high-speed internet across key countries like China, India, Japan, and South Korea. The region’s heavy investment in technological advancements and infrastructure development, including the expansion of 5G networks, is creating a favorable environment for Wi-Fi 6 adoption.
Europe Wi-Fi 6 Market Insights
The Europe Wi-Fi 6 Market is witnessing strong growth due to increasing adoption in enterprises, smart homes, and public infrastructure. Rising deployment of high-speed wireless networks, IoT devices, and cloud-based services is driving demand. Additionally, advancements in energy-efficient, high-capacity routers and access points, coupled with government initiatives to enhance digital connectivity and 5G integration, are further supporting regional market expansion.
Middle East & Africa and Latin America Wi-Fi 6 Market Insights
The Wi-Fi 6 Market in the Middle East & Africa and Latin America is growing steadily, driven by rising demand for high-speed connectivity in enterprises, educational institutions, and smart city projects. Increasing adoption of IoT devices, cloud services, and wireless network upgrades is fueling growth. Investments in digital infrastructure, coupled with expanding telecom and healthcare sectors, are further supporting regional market development and technology deployment.
Wi-Fi 6 Market Competitive Landscape:
Cisco Systems, Inc.
Cisco Systems, Inc. is a global leader in networking, cybersecurity, and IT infrastructure solutions. The company provides enterprise-grade routers, switches, wireless systems, and software-defined networking, enabling secure, scalable, and high-performance digital environments. Cisco focuses on innovation in cloud, AI, and 5G technologies, supporting businesses, service providers, and public institutions with reliable connectivity, operational efficiency, and enhanced user experiences.
-
2024: Became the official Wi‑Fi 6 infrastructure partner of Allianz Arena, deploying 1,500 Wi‑Fi 6 access points to enhance fan experience and support next-generation digital services.
Hewlett Packard Enterprise / Aruba Networks
Hewlett Packard Enterprise (HPE) Aruba Networks specializes in networking, security, and AI-driven edge solutions. Its portfolio includes wired and wireless infrastructure, cloud-managed networking, and IoT solutions for enterprises, campuses, and stadiums. Aruba focuses on secure, high-performance wireless environments and edge intelligence to optimize connectivity, analytics, and automation in modern digital ecosystems.
-
2025: Deployed outdoor Wi‑Fi 6E at Notre Dame Stadium with over 1,100 indoor/outdoor access points, expanding connectivity and enabling AI and IoT applications for enhanced fan experiences.
TP‑Link Technologies Co., Ltd.
TP‑Link Technologies Co., Ltd. is a leading manufacturer of networking devices, including routers, switches, access points, and range extenders for consumers and businesses. The company emphasizes affordability, reliability, and high-speed connectivity, serving global markets with innovative Wi‑Fi and smart home networking solutions. TP‑Link continues to develop portable, high-performance networking devices to meet the growing demand for mobile and remote connectivity.
-
2024: Launched the TL‑WR1502X, a pocket-size Wi‑Fi 6 travel router offering Gig+ speeds via an Intel-based chipset, designed for on-the-go connectivity.
Netgear, Inc.
Netgear, Inc. provides advanced networking solutions for homes, small businesses, and enterprises. Its offerings include Wi-Fi access points, switches, routers, and network management software, designed to deliver reliable, high-performance connectivity. The company focuses on wireless innovation, scalability, and simplified network management to meet the growing demands of cloud, IoT, and high-density environments.
-
2025: Released the WAX610W wall-mount access point with business-class Wi‑Fi 6 performance (up to 1.8 Gbps), optimized for hospitality, multi-dwelling units, and classroom deployments.
Qualcomm Incorporated
Qualcomm Incorporated is a global leader in semiconductor and telecommunications technologies, driving innovation in mobile, networking, and wireless solutions. Its products include processors, modems, and Wi-Fi/Bluetooth chipsets, supporting 5G, Wi‑Fi 6/7, and advanced IoT applications. Qualcomm focuses on high-speed connectivity, AI integration, and energy-efficient solutions to enable next-generation networking experiences across consumer, enterprise, and service-provider markets.
-
2023: Collaborated with Charter Communications to deliver an advanced Wi‑Fi router platform leveraging Wi‑Fi 6 and emerging Wi‑Fi 7 technologies, supporting multigig speeds for Spectrum Internet customers.
Top 20 Wi-Fi 6 Companies are:
-
Cisco Systems, Inc. (Wi-Fi 6 Routers, Access Points)
-
Aruba Networks (Hewlett Packard Enterprise) (Aruba Wi-Fi 6 Access Points, Aruba Instant On Routers)
-
Netgear, Inc. (Nighthawk Wi-Fi 6 Routers, Orbi Wi-Fi 6 Mesh System)
-
Ubiquiti Networks, Inc. (UniFi Wi-Fi 6 Access Points)
-
TP-Link Technologies Co., Ltd. (Archer AX Series Wi-Fi 6 Routers, Deco Mesh Wi-Fi 6 System)
-
Qualcomm Incorporated (Qualcomm Wi-Fi 6 Chipsets)
-
Broadcom Inc. (Wi-Fi 6 Chipsets, Network Solutions)
-
Huawei Technologies Co., Ltd. (Wi-Fi 6 Routers, APs, and Enterprise Solutions)
-
D-Link Corporation (DIR-X Wi-Fi 6 Routers)
-
Intel Corporation (Wi-Fi 6 Network Cards and Chipsets)
-
Samsung Electronics Co., Ltd. (Wi-Fi 6 Smartphones, Tablets, and Laptops)
-
Xiaomi Corporation (Mi Wi-Fi 6 Routers, Mi AIoT Devices)
-
Linksys (Belkin International) (Velop Wi-Fi 6 Mesh System, Wi-Fi 6 Routers)
-
AsusTek Computer Inc. (RT-AX Wi-Fi 6 Routers, ZenWiFi Mesh Systems)
-
Zyxel Communications Corp. (Wi-Fi 6 Routers, Access Points, Mesh Systems)
-
CommScope Holding Company, Inc. (Ruckus Wi-Fi 6 APs, Network Solutions)
-
Meraki (Cisco) (Wi-Fi 6 Access Points, Cloud-Managed Solutions)
-
TP-Link Omada (Omada Wi-Fi 6 Access Points, Cloud Managed Solutions)
-
Google (Alphabet Inc.) (Nest Wi-Fi 6 Routers)
-
Amazon (Amazon eero) (eero Pro 6 Wi-Fi Mesh System)
| Report Attributes | Details |
| Market Size in 2025E | USD 6.63 Billion |
| Market Size by 2035 | USD 84.15 Billion |
| CAGR | CAGR of 28.93% From 2026 to 2035 |
| Base Year | 2025 |
| Forecast Period | 2026-2035 |
| Historical Data | 2022-2024 |
| Report Scope & Coverage | Market Size, Segments Analysis, Competitive Landscape, Regional Analysis, DROC & SWOT Analysis, Forecast Outlook |
| Key Segments | • By Component (Solution, Service) • By Enterprise Size(Large Enterprises, SMEs) • By Location (Outdoor ,Indoor ) • By Industry Vertical (IT and Telecom, Education, Retail and E Commerce, Healthcare, Government, Travel and Hospitality, Transportation and Hospitality, Manufacturing, Other) |
| Regional Analysis/Coverage | North America (US, Canada, Mexico), Europe (Eastern Europe [Poland, Romania, Hungary, Turkey, Rest of Eastern Europe] Western Europe] Germany, France, UK, Italy, Spain, Netherlands, Switzerland, Austria, Rest of Western Europe]), Asia Pacific (China, India, Japan, South Korea, Vietnam, Singapore, Australia, Rest of Asia Pacific), Middle East & Africa (Middle East [UAE, Egypt, Saudi Arabia, Qatar, Rest of Middle East], Africa [Nigeria, South Africa, Rest of Africa], Latin America (Brazil, Argentina, Colombia, Rest of Latin America) |
| Company Profiles | Cisco Systems, Inc., Aruba Networks (Hewlett Packard Enterprise), Netgear, Inc., Ubiquiti Networks, Inc., TP-Link Technologies Co., Ltd., Qualcomm Incorporated, Broadcom Inc., Huawei Technologies Co., Ltd., D-Link Corporation, Intel Corporation, Samsung Electronics Co., Ltd., Xiaomi Corporation, Linksys (Belkin International), AsusTek Computer Inc., Zyxel Communications Corp., CommScope Holding Company, Inc., Meraki (Cisco), TP-Link Omada, Google (Alphabet Inc.), and Amazon (Amazon eero). |
| Key Drivers | • Synergy Between 5G and Wi-Fi 6: Driving the Future of Connectivity. |
| Restraints | • The complexity of deployment in high-density environments is a major challenge limiting the growth of the Wi-Fi 6 market. |
Frequently Asked Questions
Ans: The Wi-Fi 6 Market is projected to grow at a CAGR of 28.93% from 2026 to 2035, driven by rising demand for high-speed, low-latency wireless connectivity.
Ans: In 2025, the Wi-Fi 6 Market was valued at USD 6.63 billion, reflecting strong adoption across enterprises, smart homes, and public networks.
Ans: Market growth is primarily driven by expanding IoT devices, smart homes, cloud applications, and 5G integration, enhancing high-speed, reliable connectivity.
Ans: The Large Enterprises segment dominated in 2025 with around 65% share, owing to extensive deployment of Wi-Fi 6 for high-speed enterprise networks.
Ans: North America dominated the Wi-Fi 6 Market in 2025, accounting for approximately 40% share, due to early adoption and advanced network infrastructure.
Get in Touch
